Published online 27 February 2013 in Wiley Online Library (wileyonlinelibrary.com) DOI: 10.1002/met.1375
Numerical modelling of heavy rainfall event over Madeira Island in Portugal:
sensitivity to different micro physical processes
Hari Prasad Dasari
a* and Rui Salgado
a,baCentro de Geof´ısica de ´Evora, Universidade de ´Evora, Portugal bDepartamento de F´ısica, Universidade de ´Evora, Portugal
ABSTRACT: Madeira Island, Portugal, experienced intense heavy rainfall on 20 February 2010 which caused loss of more
than 40 lives and great damage. This is recorded as one of the major flash flood events during the past three decades. This heavy rainfall episode is simulated using the Advanced Research Weather Research Forecasting (ARW) model at a cloud resolving grid resolution of 1 km. A nested two-way interactive four-domain configuration centred on the island and forced laterally by the 6 hourly NCEP FNL 1◦ data are used. Four experiments with different cloud microphysical parameterizations are performed to examine the model sensitivity to cloud microphysics on heavy rainfall simulations. Analysis of the synoptic meteorological conditions indicated that the extreme rainfall resulted due to the effect of regional orography on the prevailing large scale flow with conditionally unstable moist air. Results indicate that the model is able to reproduce the heavy rainfall with good agreement. The experiment with the Ferrier scheme produced more rainfall than the other three experiments, as well as overestimating the quantity of rainfall. Analysis of simulated cloud microphysical properties indicated that the model-produced heavy rainfall is sensitive to different cloud microphysics schemes. Model quantitative rainfall comparisons at different stations indicate that the Lin and Thompson schemes produced a more realistic simulation of heavy rainfall with relatively better correlation and higher threat score than the other two schemes. The associated dynamic and thermodynamic parameters are well produced in these two simulations.
KEY WORDS heavy rainfall; mesoscale model; microphysics; hydrometeors
Received 16 May 2012; Revised 9 July 2012; Accepted 25 October 2012
1. Introduction
The regional weather of Madeira is mainly influenced by the hilly terrain and the ambient synoptic atmospheric conditions. This island was recently affected by a record heavy rainfall event in February 2010 which led to flash floods, loss of life and huge infrastructural damage. Guttman (2010) reported this event as a consequence of the interaction of a passing large-scale synoptic atmospheric flow with southwesterly surface winds, moisture advection over the Atlantic Ocean and the triggering of moist convection by the regional orography of the Island. The localized heavy rainfall in Madeira is often related to complex interactions between the local topography and the synoptic scale circulation. High resolution numerical models can be employed as useful tools to understand such complex interactions and related dynamical and physical processes. In Numerical Weather Prediction (NWP) models, proper representation of precipitation physical mechanisms is crucial in predicting precipitation. Rainfall prediction in NWP models is made by representing grid resolvable processes through an explicit representation of clouds and precipitation processes and by the parameter-ization of sub-grid scale precipitation due to convection. At very high resolution (on the order of 1 km) cumulus parameterization is not needed as most of the convective
* Correspondence: Hari Prasad. D., Centro de Geof´ısica de ´Evora, Universidade de ´Evora, ´Evora, Portugal.
E-mail: [email protected], [email protected]
precipitation could be explicitly represented through parameterized microphysical processes. The increased resolution enables the model to represent mesoscale features explicitly, rather than by convection parameterization. Bulk microphysics parameterization methods are commonly used in NWP models (Koenig and Murray, 1976; Lin et al., 1983; Ferrier, 1994; Walko et al., 1995; Morrison et al., 2005, 2009) due to computational advantages and most of these schemes assume the hydrometeor size spectra follow a prescribed exponential or gamma distribution (Cotton et al., 1986; Walko
et al., 1995). Several studies attempted to examine the
vari-ations in the precipitation species parameters of cloud water mixing ratio, rainwater mixing ratio and cloud ice and their modifications during precipitation (McCumber et al., 1991; Gilmore et al., 2004a, 2004b; Hong, 2004; Hong et al., 2004; Grubisic et al., 2005; Hong and Lim, 2006; Hong et al., 2006; Liu et al., 2006; Liu and Moncrieff, 2007). McCumber et al. (1991) compared several ice parameterizations in two types of tropical convective systems. They reported that three ice classes produce better results relative to two ice classes or ice-free conditions. Grubisic et al. (2005) examined the skill of the MM5 model at 1.5 km resolution in complex orography, during a heavy rainfall event over Sierra Nevada and investigated the sensitivity of different microphysical parameterizations and horizontal resolutions. The sensitivity of summertime convective predictions to bulk microphysics parameterizations at fine grid spacing was studied by Liu et al. (2006). Gilmore
et al. (2004a) showed the sensitiveness of accumulated
precipitation to the parameterization of hail/graupel in the model and the importance of hail/graupel on heavy rainfall
simulation. Liu and Moncrieff (2007) investigated the effects of cloud microphysics parameterizations on warm season rainfall simulation, assessing the sensitivity of summer time convection to the bulk microphysics parameterizations at fine grid resolution. The relative importance of ice-phase microphysics and sedimentation velocity for hydrometers is reported by Hong and Lim (2006) in a bulk microphysics scheme, the single momentum six-class microphysics scheme (WSM6) for a heavy rainfall event over Korea.
A few studies have examined the Madeira heavy rainfall event. Luna et al. (2011) studied the predictive capability of the ARW model on the Madeira rainfall event with very high resolution of 1 km. In their study, the importance of horizontal resolution and the nesting of domains on heavy rainfall prediction were discussed. It was reported that the heavy precipitation was due to orographic induced convective clouds and modelling of microphysical parameters was found to be important. Fragoso et al. (2012) investigated the 20 February Madeira flash-floods with regard to the synoptic/large-scale meteorological context focusing on the dynamical controls. They showed that strong humidity convergence at lower levels (at and below 700 hPa) was an important dynamical ingredient that contributed to enhancing upward movements and higher precipitation generation. Couto et al. (2012) analysed these events together with the other extreme precipitations events which occurred in the 2009/2010 winter. The authors found that in six out of the seven cases analysed the passage of a cold front and the presence of atmospheric rivers, acting to increase moisture in the lower atmospheric levels, together with the orographic lifting, induced the heavy precipitation events.
The intent of the present study is to examine the relative performance of various cloud microphysics parameterizations on the simulation of this heavy rainfall event over Madeira using the Advanced Research Weather Research and Fore-casting (ARW) model. In the following, a description of the synoptic features of the Madeira rainfall event along with anal-ysis using ECMWF data is given in Section 2, a description of the model and its configuration is given in the Section 3, the results of numerical study are described in the Section 4 and finally the study is summarized in Section 5.
2. Description of the Madeira and associated rainfall event
Madeira is a Portuguese island situated in the North Atlantic Ocean and located about 980 km from Lisbon. The island has an area of 741 km2 with a mean altitude of 1220 m (the highest altitude is 1862 m at Pico Ruivo). Madeira Island was recently affected by the worst flash floods in the history of this Portuguese archipelago. The heavy rainfall that occurred on 20 February 2010 in a relatively short time, combined with Madeira’s geography of steep slopes slanting towards the coast, complicated the water runoff and ground drainage, leading to the formation of mudslides and flooding that swept out everything in their path. The disaster caused more than 40 deaths, several missing and huge infrastructure damage.
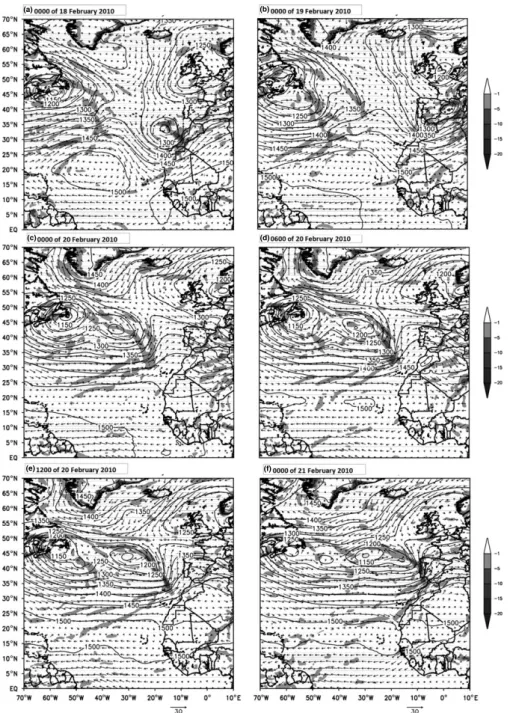
To understand the large scale atmospheric flow and its influ-ence on heavy rainfall over Madeira, the European Centre for Medium-Range Weather Forecasts (ECMWF) IFS meteo-rological analysis data available at 25 km horizontal resolution (Figure 1) from 0000 18 February to 0000 21 February 2010 were analysed. At 0000 18 February, the wind flow at the 850 hPa level shows two low pressure systems located approx-imately at 45◦ N, 60◦ W and at 34◦N, 17◦ W over the west
and east side of the North Atlantic Ocean. At this level, conver-gence is noticed over two low pressure regions and diverconver-gence over the ridge region. This synoptic condition prevailed for over 18 h, i.e. up to 1800 on 18 February, with slight variations. By 0000 on 19 February the low pressure system over the east side completely moved over the European land mass and the west-ern system further moved to north. A merging region of strong westerly flow and flow from the northeast at 32◦ N, 10◦ W is noticed. At 0000 on 20 February, the day of heaviest rain-fall over Madeira, the two low pressure regions were located at 47◦ N, 58◦ W and at 45◦ N, 35◦ W. A strong westerly flow was established between 25 and 40◦ N along the North Atlantic Ocean. After 6 h these two low pressure systems fur-ther intensified and moved slightly to the southeast. The eastern low pressure system moved almost 5◦ E to 43◦N, 30◦E. At 1200 on 20 February, the low pressure systems further inten-sified with slight eastward movement. At this time the inflow region of the eastern low pressure system was located directly over Madeira and led to strong convergence over this region. Because of this synoptic pattern, local mesoscale convection developed and Madeira’s orography assisted its further intensi-fication leading to the heavy rainfall over the island. By 0000 on 21 February a convergence zone separating westerly and east-erly flow was observed along 45◦ N over the North Atlantic Ocean. The low pressure system picked up moisture during its passage over the Atlantic Ocean which helped orographically-triggered convection and yielded heavy rainfall over Madeira. The region of convergence was noted to extend up to 500 hPa (the middle troposphere) until the 20 February and complete divergence, which further accentuated low level convergence, was found at 200 hPa. Although the vertical extent of the system was not very high, the low level convergence was able to pump moisture from the North Atlantic Ocean into the atmosphere. During the passage of the system, Madeira’s orography helped its intensification (through mechanical uplifting and condensa-tion processes) and led to the heavy rainfall on 20 February over the island.
An official report from the National Weather Service (Guttman, 2010) showed that the heavy rainfall was associ-ated with a plume of deep moisture (Figure 2(a)) which came across the Atlantic Ocean with strong southwesterly flow and passed over Madeira. The plume of moisture is visible in the total precipitable water (Figure 2(a)) obtained from the Atmo-spheric InfraRed Sounder (AIRS), as explained in Couto et al. (2012). It was reported that the precipitable water (PW) anoma-lies over 42 mm from the ‘rum-runner express’ were of the order of 4–5 standard deviations above normal (Figure 2(b)). The high latitude block over Greenland, the southward shift of the westerlies and a low pressure system that was located over the central Atlantic basin were attributed as the causative factors contributing to this heavy rainfall event.
3. Description of the model and numerical experiments
The Advanced Research Weather Research and Forecasting model (ARW) developed by NCAR, USA, is used in the present study. It is a limited area, primitive equation, non-hydrostatic and terrain following sigma co-ordinate model. The description of the model is given in Skamarock et al. (2008). The model is configured with four nested domains (Figure 3) with horizontal resolutions of 27, 9, 3 and 1 km. The initial and boundary conditions are adopted from NCEP FNL analysis data available at 1◦resolution. Model topography is taken from
(a) (b)
(c) (d)
(e) (f)
Figure 1. Wind flow (m s−1), Geopotential height (m) in contours and divergence (×10−5s−1, shaded) at the 850 hPa level for different timings from ECMWF IFS data.
USGS data (Figure 4). A total of 41 vertical levels is used, with 30 levels below 500 hPa to resolve boundary layer fluxes reasonably. In all four experiments the model is integrated for 72 h starting from 1200 on 19 February 2010. Simulated rainfall is compared with the observations collected from the Portuguese Institute of Meteorology. In the present study real boundary conditions derived from FNL analysis are used so that the model performance of simulating the rainfall is not biased by the use of forecast boundary conditions such as GFS data. The model physics options included the Dudhia short wave radiation scheme (Dudhia, 1989) RRTM long wave radiation scheme (Mlawer et al. 1997), YSU non-local scheme (Hong
et al., 2006) for PBL turbulence and the Kain-Fritsch scheme
(Kain and Fritsch, 1993) for convection. Four experiments with different explicit moisture schemes (Kessler, Lin, Ferrier and Thompson) were conducted with the ARW model to study the
simulated precipitation sensitivity to microphysics. The Kessler scheme (Kessler, 1969) is a simple warm rain scheme as it has no ice phase. This includes water vapour, cloud water droplets and rain. Purdue-Lin (Lin et al., 1983) is a relatively sophisticated scheme, which includes water vapour, cloud water droplets, cloud ice particles, rain, snow and graupel. The Ferrier scheme (Ferrier et al., 1995) predicts changes in water vapour mixing ratios and condensation products in the form of cloud rain, cloud water, cloud ice and precipitation ice particles. The individual hydrometeor fields are combined into a unique total condensation product, which together with the water vapour are advected in the model. The Thompson scheme (Thompson
et al., 2004, 2006) assumes that the snow size distribution
depends upon both ice water content and temperature and both are represented as a sum of exponential and gamma distributions. In this scheme, snow assumes a non-spherical
Figure 2. Total precipitable water vapour (a) obtained from the Atmospheric InfraRed Sounder (AIRS) for 20 February 2010 by Couto et al. (2012) and monthly average (February) of total precipitable water (b) for the period 1979–2009 from NCEP/DOE AMIP-II Reanalysis (Reanalysis-2).
Figure 3. Model domains chosen in this study.
shape with a bulk density which differs from all other bulk schemes that consider spherical shape with a constant density.
4. Results and discussion
The model-produced spatial distribution of total rainfall over the inner domain in the period 0000 on 20 February to 0000 on 21 February 2010, along with observations, are presented in Figure 5. Observations from different stations show that the maximum rainfall was observed at two locations near the top of the mountains. The first maximum is about 40 cm day−1 observed at the southeast peak (Areeiro) of Madeira mountain and the second maximum is about 24 cm day−1 observed near the northwest peak of the mountain. In the foothills of the mountains, slightly lower rainfall of around 10 cm day−1 is observed. Model-simulated accumulated rainfall shows that all four schemes are able to produce heavy rainfall over Madeira, agreeing with the pattern in observations. However, experiments with the Ferrier scheme are noted to produce
the highest rainfall of all the four experiments, with rainfall quantities of more than 40 cm day−1and with two conspicuous spatial maxima. This experiment produced higher amounts of rainfall than the observations and with higher spatial extent of maximum rainfall than the other three experiments. Next to the Ferrier scheme, the Kessler scheme produced a rainfall maximum of about 35 cm day−1 and it also produced two localized spatial maxima, though with less extent and with slightly higher quantities than the observations. The remaining two experiments (with the Lin and Thompson schemes), have also each produced maximum rainfall of about 35 cm day−1, but in very localized areas, agreeing reasonably with observations. In general, the model has simulated rainfall distribution in good agreement with the station observations.
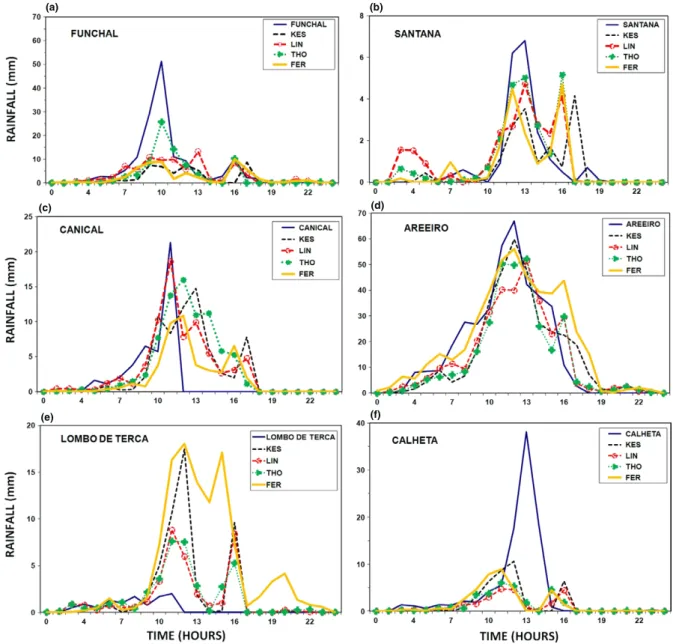
Model-produced hourly rainfall for all four experiments from 0000 on 20 February to 0000 on 21 February 2010, at six differ-ent stations, is presdiffer-ented in Figure 6, along with the correspond-ing rainfall observations. Stations Funchal, Santana, Canic¸al, Lombo de Terc¸a and Calheta are distributed in the southeastern, northern, eastern, northwestern foot hill plains, respectively, whereas Areeiro is situated on the east central peak of the island. At Funchal and Calheta stations the simulations show rainfall lower by 30 and 60% than that observed. Though all experiments produced less rainfall than the observations, the Lin and Thompson schemes seem to produce relatively higher rainfall amounts (nearly 20% more) than the other two exper-iments. The simulated rainfall at Santana and Areeiro stations is noted to be in good agreement with the observations. Exper-iments with the Ferrier scheme produced nearly 15% higher rainfall than the other three experiments at Areeiro, whereas at Santana, the experiment using the Lin and Thompson schemes produced relatively slightly higher amounts of rainfall. For San-tana, although all the experiments followed a similar trend with respect to the initiation, timing of peak rainfall and cessation in agreement with the observations, the simulations seem to produce an extended duration of rainfall. At Lombo de Terc¸a station all the simulations exaggerated by nearly 2–10 times higher rainfall compared to observed quantities. Experiments with Ferrier and Kessler schemes, especially, produced nearly 80% more rainfall relative to the observations as well as to the other two experiments. At Canic¸al station the simulated
Figure 4. Model topography along with different station locations.
(a) (b)
(c) (d)
Figure 5. (a–d) Model simulated accumulated rainfall (cm day−1, in shaded) along with the station observations (shown in numbers) during the period 0000 of 20 February to 0000 of 21 February 2010 for different experiments.
(a) (b)
(c) (d)
(e) (f)
Figure 6. Model simulated hourly rainfall (mm h−1) at different stations 0000 of 20 February to 0000 of 21 February 2010 for different experiments.
rainfall with the Lin scheme exhibited a similar trend to that of observations, whereas the other three schemes produced a 5% lower amount of rainfall. In general, the model underesti-mated rainfall at Funchal and Calheta, the foothill stations on the southern and western parts of the mountain and overesti-mated it at the Lombo de Terc¸a northwestern foothill station. At the other stations the model-produced rainfall values are noted to be in good agreement with observed rainfall. From the above results it is clear that at most of the stations the experiments with Lin and Thompson schemes produced reasonable rainfall simulation with 5–20% errors, and experiments with the other two schemes produced 50–60% higher rainfall than the obser-vations at the foothills of the mountains. As per obserobser-vations, the maximum rainfall occurred at 1000 on 20 February at the southern station (Funchal) and southeastern station (Canic¸al), and at 1200 and 1300 at Areeiro, Santana and Calheta sta-tions, suggesting the passage of the system from the southeast to northwest.
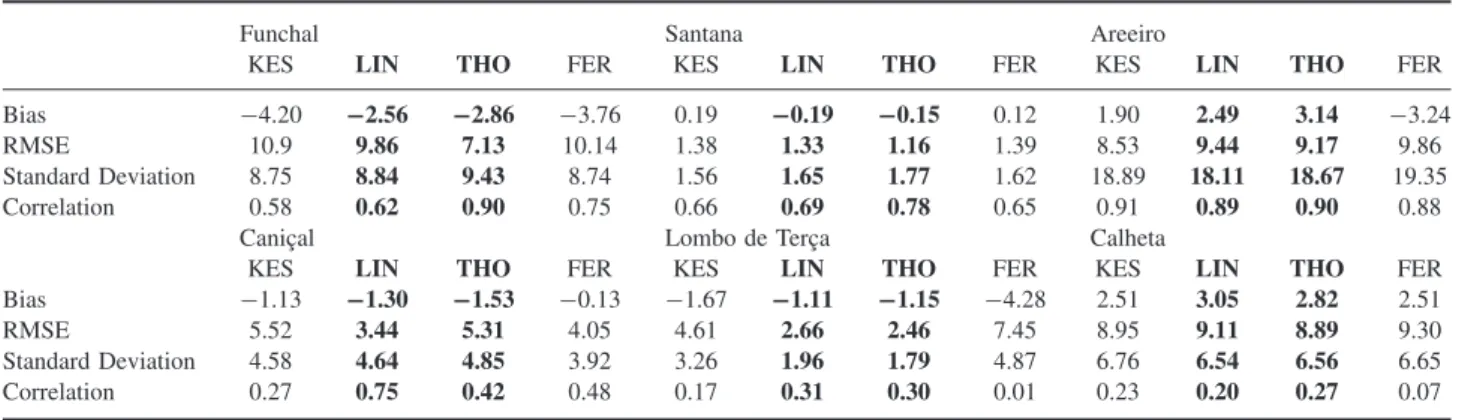
Error statistics comprising BIAS, root mean square error (RMSE), standard deviation of the Error (STDE) and
correlation co-efficients (Murphy and Winkler, 1987; Jolliffe and Stephenson, 2003) are computed between model-produced hourly rainfall and corresponding rainfall observations at six stations for all four experiments (Table 1). In all experiments and at most stations (except Canic¸al and Lombo de Terc¸a) the BIAS values are negative, indicating underestimation of rainfall in simulation at the respective stations. At Funchal, the model shows negative BIAS (−4.2 for Kessler, −2.56 for Lin,−2.86 for Thompson and −3.76 for Ferrier) with higher RMSE (10.9 for Kessler, 9.86 for Lin, 7.13 for Thompson and 10.14 for Ferrier) and good correlation (0.58 for Kessler, 0.62 for Lin, 0.90 for Thompson and 0.75 for Ferrier). At Areeiro station, three experiments show negative BIAS (−1.9 for Kessler,−2.49 for Lin and −3.14 for Thompson) and only the Ferrier scheme shows a positive bias (3.24). At this station the RMSE values are within the range of 8–10 and all experi-ments show good correlations (0.88–0.9) with more than 95% confidence. At Calheta station all experiments show negative BIAS with higher RMSE and lower correlations and at Canic¸al and Lombo de Terc¸a stations all experiments produce positive
Table 1. Statistics between model rainfall and observations for different station.
Funchal Santana Areeiro
KES LIN THO FER KES LIN THO FER KES LIN THO FER
Bias −4.20 −2.56 −2.86 −3.76 0.19 −0.19 −0.15 0.12 1.90 2.49 3.14 −3.24
RMSE 10.9 9.86 7.13 10.14 1.38 1.33 1.16 1.39 8.53 9.44 9.17 9.86
Standard Deviation 8.75 8.84 9.43 8.74 1.56 1.65 1.77 1.62 18.89 18.11 18.67 19.35
Correlation 0.58 0.62 0.90 0.75 0.66 0.69 0.78 0.65 0.91 0.89 0.90 0.88
Canic¸al Lombo de Terc¸a Calheta
KES LIN THO FER KES LIN THO FER KES LIN THO FER
Bias −1.13 −1.30 −1.53 −0.13 −1.67 −1.11 −1.15 −4.28 2.51 3.05 2.82 2.51
RMSE 5.52 3.44 5.31 4.05 4.61 2.66 2.46 7.45 8.95 9.11 8.89 9.30
Standard Deviation 4.58 4.64 4.85 3.92 3.26 1.96 1.79 4.87 6.76 6.54 6.56 6.65
Correlation 0.27 0.75 0.42 0.48 0.17 0.31 0.30 0.01 0.23 0.20 0.27 0.07
KES= Kessler scheme; LIN = Lin scheme; THO = Thompson scheme; FER = Ferrier scheme.
BIAS with lower correlations. All experiments give lower error metrics for Santana station than the remaining stations. At this station good correlations (0.6–0.7) are found. Threat scores are computed for hourly rainfall between model and observations for 24 h period (Table 2). Relatively higher threat scores are obtained with the experiments using the Lin or Thompson schemes than those with Kessler or Ferrier schemes. The frequency of hits is noted to be more with Ferrier scheme than with Lin and Thompson schemes at the heavy rainfall station Areeiro. Considering threat score and other statistical metrics experiments, the Lin and Thompson schemes are found to perform better for simulation of the Madeira heavy rainfall event than the other two schemes.
The simulated wind fields and geopotential height at 850 hPa, from the coarse domain 1 of 27 km resolution at different times on 20 February, are presented in Figure 7 for the exper-iment with the Kessler scheme. Large-scale features from the Kessler experiment alone are discussed, as all four experiments show nearly similar patterns. The results from the simulation at 0000 show a cyclonic circulation with well organized spi-ral bands and inflow regions marked with convergence zones of the cyclonic system. At 0600 the cyclonic system fur-ther extended towards southeast direction and intensified as
seen from increments in the closed geopotential contours (e.g. 1200 gpm). A strong well organized inflow of the cyclonic system was simulated by the model and at 1200 the system was further intensified and inflow region increased. After 6 h, i.e. at 1800, the system embedded in the westerly flow moved towards the north and the inflow region crossed Madeira. The outflow region, located in the northern part of Madeira, is also simulated but with low intensity. From the above results it can be concluded that the low pressure system, located over the upstream western areas of Madeira, was slowly moved towards the island by the large scale westerly flow and intensified. Dur-ing this time, the inflow regions with strong convergence of the convective storm hit Madeira for a few hours which, in associa-tion with the orography of the island, led to the development of the mesoscale convective system and consequent heavy rainfall. At higher levels, the wind pattern from domain 1 shows strong westerly flow (not shown) along the Madeira region from all the experiments.
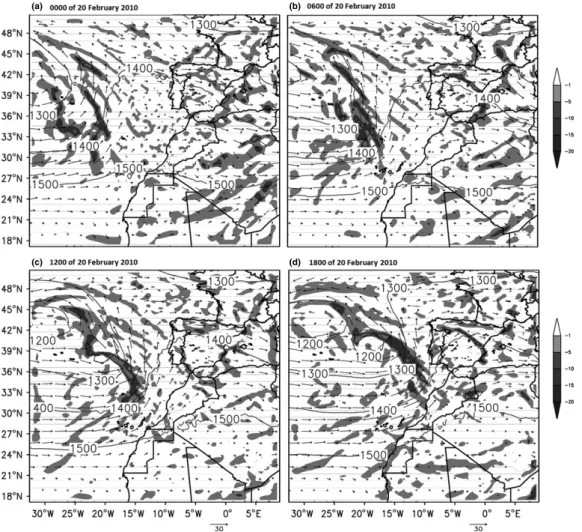
To understand the mesoscale convective system develop-ment over Madeira and its characteristics, different parameters from the high resolution (1 km) domain 4 were analysed. The time-height section (32.735◦ N, 16.875◦ W) of flow conver-gence (Figure 8) from all four experiments show that moisture Table 2. Threat score between model and observed hourly rainfall (ranges are taken as 0–5 and > 5–60 mm h−1).
No. of observations No. of hits Threat score
IM KES LIN THO FER KES LIN THO FER KES LIN THO FER
Funchal 17 19 16 19 19 15 16 17 16 0.714 0.94 0.89 0.8 7 5 8 5 5 3 7 5 0 0.33 0.87 0.71 0 Santana 22 24 24 22 24 22 22 21 22 0.91 0.91 0.91 0.91 2 0 0 2 0 0 0 1 0 0 0 0.33 0 Areeiro 11 12 12 12 8 9 11 11 8 0.64 0.91 0.91 0.72 12 12 12 12 16 9 11 11 12 0.6 0.85 0.85 0.75 Canic¸al 21 18 19 17 21 17 18 16 19 0.77 0.81 0.73 0.82 3 6 5 7 3 2 2 2 1 0.28 0.33 0.25 0.20 Lombo de Terc¸a 24 20 21 21 17 17 21 21 17 0.70 0.87 0.87 0.70 0 4 3 3 7 0 0 0 0 0 0 0 0 Calheta 20 20 23 22 22 18 20 20 19 0.82 0.87 0.91 0.82 4 4 1 2 2 2 1 1 1 0.33 0.25 0.5 0.2
(a) (b)
(c) (d)
Figure 7. Model wind flow (m s−1), geopotential height (meters, in contours) and divergence (×10−5 s−1, in shaded) at 850 hPa level from 27 km domain for the experiment with Kessler scheme.
convergence slowly build up at lower levels from 0000 on 20 February with the occurrence of its maximum around 1100 of the same day. The moisture convergence is confined below the pressure level of 600 hPa and is concentrated in the layer 850–750 hPa. This pattern is observed in all four experiments, with the Ferrier scheme producing slightly less intensive con-vergence than the rest. These results indicate that the moisture build up started at around 0300 until about 0900, before the occurrence of the heavy rainfall, and that moisture was being advected from the Atlantic Ocean by the westerly large-scale flow. In all the experiments, the maximum rainfall was simu-lated at approximately 32.735◦N, 16.875◦W around 0900 on 20 February 2010, which was chosen to be a representative time to examine the characteristics of the convective system further. The low level convergence of the moisture persisted almost the whole day in all experiments.
Simulated vertical velocity and relative humidity are pre-sented in an east–west vertical section along 32.735◦N for all four experiments in Figure 9. A strong vertical motion is seen in all the experiments near the location of the storm centre, as expected. In all cases strong upward motion followed by the downward motions are observed. Strong vertical motions with velocity of about 0.5–3 m s−1 are noted between the 800 and 600 hPa pressure levels. The strongest upward motions are pro-duced by the Thompson and Ferrier schemes. The simulated relative humidity values show that the air is relatively humid to the west of the convective system in all experiments and that
the air with more than 90% of RH extends up to 500 to 400 hPa pressure level.
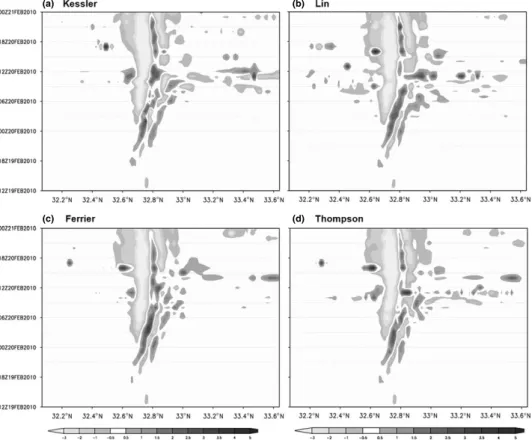
The zonal progression of the region of higher vertical motion with time at 16.875◦ W is analysed using vertical velocities at 3.5 km, which is the height of maximum vertical velocity noticed in all four experiments. The results show (Figure 10) the northward propagation of the updrafts followed by down-drafts along the core of system with time. At the latitude of Madeira the zone of highest vertical velocities occurred around 1200 on 20 February in all simulations, coinciding with the incidence of heavy rainfall. The simulated vertical velocity propagation along the latitude with time is of nearly 25–35 km in a day. These features are observed in almost all experiments, with slight variations in their intensities.
The time-section plot of potential temperature along 32.735◦ N shows the steep vertical gradients from the surface up to 500 to 400 hPa level, reaching nearly 30 K on the leeside of the mountain in all experiments (Figure 11). A strong thermal front with an axis of warmer temperatures is noticed around 16.8◦ W longitude. This front is associated with steep temperature gradients and with rapid fall in temperature on both eastern and western adjacent regions. The steep gradients in potential temperature create a more unstable-stable-unstable atmosphere at low level, indicating triggering of convection in cold air and outbreaks of strong fluxes of heat and moisture from the ocean to the atmosphere, thus providing a source of energy for sustained active convection. A rainwater mixing ratio
(a)
hPa hPa
hPa hPa
(b)
(c) (d)
Figure 8. Time-height section of moisture convergence (×10−6s−1) at the location 32.738◦ N; 16.875◦W for the period 1200 on 19 February to 0000 on 21 February 2010. Convergence (+ve) regions are shaded and divergence (−ve) is plotted as contours for different experiments.
(a) hPa hPa hPa hPa (b) (c) (d)
Figure 9. Vertical cross section of vertical velocity (m s−1) in shaded and relative humidity (%) in contours along 32.738◦ N at 0900 on 20 February 2010 for different experiments.
(a) (b)
(c) (d)
Figure 10. Time-latitude plot showing propagation of vertical velocity at 3.5 km for different experiments.
(a)
hPa
hPa
(b)
(c) (d)
Figure 11. Vertical cross section of rainwater (g kg−1) in shaded and potential temperature (K) in contours along 32.738◦ N at 0900 on 20 February 2010 for different experiments.
(a) (b)
(c) (d)
hPa
hPa
Figure 12. Vertical cross section of positive vorticity (×10−5s−1) in shaded and negative divergence (×10−5s−1) in contours along 32.738◦N at 0900 on 20 February 2010 for different experiments.
greater than 0.4 g kg−1extending over a few kilometres in the east–west direction is also noticed on the windward side in all experiments (Figure 11). This zone of higher rainwater mixing ratio is seen to extend vertically up to 700hPa in the experiment with the Ferrier scheme, 750 hPa in the experiment with the Lin Scheme and up to 750 hPa in the other two experiments.
The vertical section of wind divergence and vorticity along 32.735◦N shows that a strong low and mid level convergence exists (Figure 12). Conversely, in between and at the upper level, divergence is noticed, which promotes evacuation of the ascending air mass in the storm centre leading to further intensification of the system. This feature is well observed in all experiments but with slight intensity variations. The strong convergence leads to strong positive vorticity, which is simulated by the model at the core of the convective system in all experiments. The convergence seems to be more intense in the experiments using the Ferrier and Thompson schemes.
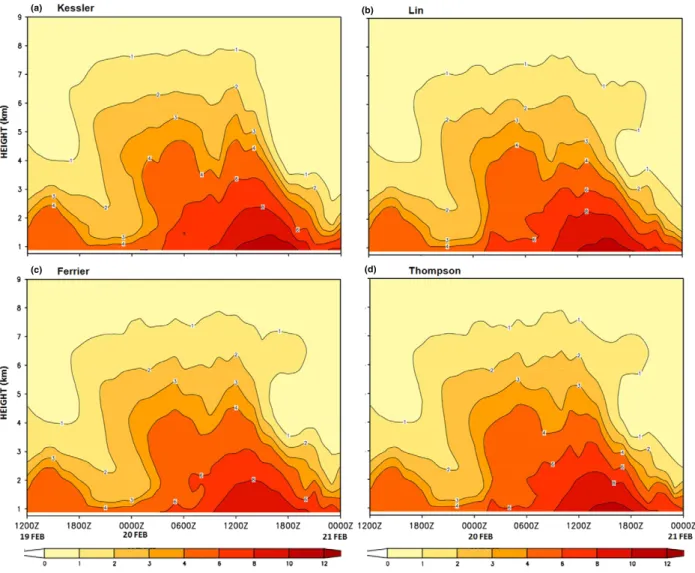
Figure 13 shows the time-height section of the atmospheric water vapour pumped up to higher levels (3–6 km) due to the passage of the convective system. The accumulation of water vapour in the atmosphere is seen to concentrate around 1200 on 20 February, coinciding with the timing of the occurrence of heavy rainfall over the island. Although these features are
similarly noted in all four experiments, experiments with the Kessler and Lin schemes produced relatively more atmospheric water vapour in the higher levels than the other two schemes did. It is expected that the pumping of water vapour at the 3–6 km level will increase the production of hydrometeors and, thus, higher reflectivity in the middle layers. The time-height section of the maximum radar reflectivity is presented in Figure 14, which shows the temporal evolution of the convective storm. The maximum reflectivity is about 40 dBZ with the Ferrier, Thompson and Lin experiments and about 50 dBZ with the Kessler scheme. The vertical extent of the core of maximum reflectivity is higher in the case of Kessler and reached almost 5–6 km, whereas in the other three experiments it reached only about 3–3.5 km. In all three experiments the radar reflectivity values start increasing from 0600 on the 20 February up to its maximum value between 0900 and 1200, indicating synchronization of microphysical processes in all the experiments. The simulated radar reflectivity peak will give an idea about the presence of maximum hydrometers at this level. The simulated vertical profiles of different hydrometeors over the place with maximum rainfall values for the different experiments at 0900 on the 20 February 2010 are presented in Figure 15. From Figure 15(a), the experiment with the Kessler
(a) (b)
(c) (d)
Figure 13. Time-height section of model produced atmospheric water vapour (g kg−1) at 32.738◦N and 16.875◦ W for different experiments.
scheme produced more cloud water with a maximum of about 0.45 g kg−1located at 10.5 km, whereas the Lin and Thompson schemes produced their maximum cloud water values at 6.5 km. It is noted that the Lin scheme produced a lower cloud water amount of about 0.2 g kg−1 whereas the Thompson scheme produces a maximum of about 0.4 g kg−1, and the Ferrier scheme did not produce any cloud water. The vertical profile of rainwater (Figure 15(b)) shows similar vertical variation in rainfall and that rainfall amounts increase below 3 km towards the surface. It is noted that the Thompson and Lin schemes produced less rainwater values relative to the Ferrier and Kessler schemes. The cloud snow is simulated by the model mainly at 7 km height in all three experiments, but with slight differences in the amounts (Figure 15(c)). The Ferrier scheme produced a relatively higher amount (0.25 g kg−1) whereas the Lin and Thompson schemes produced lower amounts (0.15 and 0.1 g kg−1, respectively). In all three experiments, the trends in vertical profiles are more or less the same. The Lin scheme produced a maximum of cloud ice (0.03 g kg−1) at 7.5 km whereas the Thompson scheme produced very negligible amounts of cloud ice (< 0.01 g kg−1) at 11 km (Figure 15(d)). For the graupel (Figure 15(e)), the Lin experiment produced a maximum amount of 0.1 g kg−1at 6 km, whereas the Thompson scheme hardly simulated graupel. From the above analysis it is clear that the experiment with Lin scheme seems to resolve all the hydrometeors, giving reasonable simulation of the observed
rainfall amounts. The excessive amounts of rainfall simulated with the Ferrier and Kessler schemes appear to be related to the excessive generation of cloud water with them. The Thompson scheme seems to produce reasonable amounts based purely on the generation of cloud snow. Of course, it is hard to infer the relative merits of different microphysics schemes with limited available observations.
Finally, based on the detailed analysis of all parameters and the results obtained, it can be asserted that the heavy rainfall episode over Madeira occurred under the influence of a passing low pressure system over the Atlantic ocean, associated moisture advection and the triggering of moist convection through interaction with the island’s complex orography. The horizontal extent of this convective system is nearly 30 km, with a vertical extent up to 5 km.
5. Summary and conclusions
In this study the ARW model is used to simulate at a very high resolution of 1 km the heavy rainfall episode which occurred over Madeira on 20 February 2010, with the aim of studying the sensitivity of model-simulated rainfall to different cloud microphysics schemes. The results of simulations up to 1 km fine resolution demonstrated the potential of the model to reproduce the rainfall distribution in space and time in all
(a) (b)
(c) (d)
Figure 14. Time-height section of model produced radar reflectivity (dBZ) at 32.738◦N and 16.875◦ W for different experiments.
four experiments performed. The experiment with the Ferrier scheme produced a wider area of maximum rainfall, followed by the Kessler, Thompson and Lin schemes. In all these three experiments the location of maxima and their intensity are very similar, with slight variations in their areal extent. Comparisons of rainfall amounts at six different stations distributed in the foothills and plateau of the island with station rainfall data indicated that the model was able to reproduce the temporal distribution at most stations. Overall, the experiment with the Ferrier scheme produced about 30% more rainfall than the other experiments. The error statistics revealed that the Lin and Thompson schemes produced higher threat scores, lower BIAS, lower RMSE, lower STDE and higher correlations, indicating better performance with the Lin and Thompson schemes for the simulation of Madeira heavy rainfall. The large-scale features from all experiments are noted to have a similar pattern and were found to be in good agreement with ECMWF data.
The simulated dynamic and thermodynamic features could explain the development and structure of the mesoscale con-vective system associated with regional orography embedded in the large-scale atmospheric flow. The present simulations of the mesoscale convective system demonstrated the significance of application of cloud resolving grid and associated explicit microphysics. The analysis of several dynamical and thermody-namic variables in a vertical section enabling an understanding of the structure of the mesoscale convective system and the
differences among the four experiments. It has been found that small isolated regions of strong upward motion followed by downward motions and higher relative humidity increased the amount of latent heat during the development of convective system, with stronger dynamical forcing. The simulations showed that the zonal propagation of vertical velocity associ-ated with the mesoscale convective system along the longitude with time is about 25–35 km in a day. A frontal formation with strong horizontal gradient of potential temperatures associated with high relative humidity and with rainwater mixing ratio greater than 0.4 g kg−1 is simulated in all four experiments. Cyclonic vorticity, flow and moisture convergence over Madeira are simulated during the episode. The time variations of moisture convergence, atmospheric water vapour and radar reflectivity were analysed at specific locations of observed maximum rainfall, which indicated accumulation of moisture below 600 hPa in a few hours prior to the occurrence of heavy rainfall. The time-height section of simulated atmospheric water vapour during the episode shows water vapour reaching maximum values in the 3–6 km layer, indicating the pumping of the atmospheric water vapour to higher levels due to orographic lifting. Because of this, the model also produced more radar reflectivity at these levels indicating the presence of maximum hydrometeors. Significant variations are noticed in hydrometeor profiles among the four experiments. It has been found that the Lin scheme simulated all hydrometeors
(a) (b)
(c)
(e)
(d)
Figure 15. Vertical profiles of different hydrometers species (light solid line with squares-Kessler; light solid line with open circles-Lin; light solid with filled circles-Ferrier; dark solid line with open circles-Thompson) for different experiments (units are g kg−1). (a) Cloud water, (b)
rainwater, (c) cloud snow, (d) cloud ice and (e) graupel.
equally well, whereas the Kessler scheme produced higher cloud water concentration at 11 km, the Ferrier scheme pro-duced more in-cloud snow concentration at 7 km. Overall, the results show that the experiments with the Lin and Thompson schemes performed better than the other two experiments,
with respect to location and amount of maximum rainfall, and associated dynamic and thermodynamic features. It is to be mentioned that modelling of different types of hydrometeors is an uncertain area (Petersen and Rutledge, 2001; Khain et al., 2005; Morrison et al., 2005), especially modelling of the ice
phase, inclusion of graupel and the impact of aerosol chemistry on heterogeneous ice and droplet nucleation. At this stage it cannot be concluded clearly which scheme is better for this study. However, it allows understanding of the importance of microphysical parameters, which can be used to parameterize the cloud physics and which, in turn, may contribute to the reduction of uncertainties in the simulation of different hydrometeors contributing to location specific rainfall.
Acknowledgements
The authors are grateful to the Portuguese Institute of Mete-orology and ECMWF for MARS database account. The first author is also thankful to FCT (Portugal) for funding through CIENCIA-2008 program. The work of the second author is co-financed through FEDER (Programa Operacional Fac-tores de Competitividade – COMPETE) and National fund-ing through FCT–Fundac¸˜ao para a Ciˆencia e a Tecnologia in the framework of project FCOMP-01-0124-FEDER-009303 (PTDC/CTE-ATM/102142/2008). The authors also wish to acknowledge the anonymous reviewers for many useful sug-gestions to improve the manuscript.
References
Cotton WR, Tripoli GJ, Rauber RM, Mulvihill EA. 1986. Numerical simulation of the effects of varying ice crystal nucleation rates and aggregation processes on orographic snowfall. J. Appl. Meteorol. 25: 1658–1680.
Couto FT, Salgado R, Costa MJ. 2012. Analysis of intense rainfall events on Madeira Island during the 2009/2010 winter. Nat. Hazards Earth Syst. Sci. 12: 2225–2240. doi:10.5194/nhess-12-2225-2012. Dudhia J. 1989. Numerical study of convection observed during the
winter monsoon experiment using a mesoscale two-dimensional model. J. Atmos. Sci. 46: 3077–3107.
Ferrier BS. 1994. A double-moment multiple-phase four-class bulk ice scheme part I: description. J. Atmos. Sci. 51: 249–280.
Ferrier BS, Tao WK, Simpson J. 1995. A double-moment multiple-phase four-class bulk ice scheme part II: simulations of convective storms in different large-scale environments and comparisons with other bulk parameterizations. J. Atmos. Sci. 52: 1001–1033. Fragoso M, Trigo RM, Pinto JG, Lopes SS, Lopes A, Ulbrich S, Magro
C. 2012. The 20 February Madeira flash-floods: synoptic analysis and extreme rainfall assessment. Nat. Hazards Earth Syst. Sci. 12: 715–730.
Gilmore MS, Straka JM, Rasmussen EN. 2004a. Precipitation and evo-lution sensitivity in simulated deep convective storms: comparisons between liquid-only and simple ice and liquid phase microphysics. Mon. Weather Rev. 132: 1897–1916.
Gilmore MS, Straka JM, Rasmussen EN. 2004b. Precipitation uncertainty due to variations in precipitation particle parameters within a simple microphysics scheme. Mon. Weather Rev. 132: 2610–2627.
Grubisic V, Vellore RK, Huggins AW. 2005. Quantitative precipitation forecasting of wintertime storms in the sierra Nevada: sensitivity to the microphysical parameterization and horizontal resolution. Mon. Weather Rev. 133: 2834–2859.
Guttman R. 2010. The Madeira Island Floods of 20 February 2010 . National Weather Service. http://cms.met.psu.edu/sref/severe/ 2010/20Feb2010.pdf
Hong SY. 2004. Comparison of heavy rainfall mechanisms in Korea and the central United States. J. Meteorol. Soc. Jpn. 82: 1469–1479.
Hong SY, Dudhia J, Chen SH. 2004. A revised approach to ice-microphysical processes for the bulk parameterization of cloud and precipitation. Mon. Weather Rev. 132: 103–120.
Hong SY, Lim JO. 2006. The WRF single-moment 6-class micro-physics scheme (WSM6). J. Korean Meteorol. Soc. 42: 129–151. Hong SY, Noh Y, Dudhia J. 2006. A new vertical diffusion package
with an explicit treatment of entrainment processes. Mon. Weather Rev. 134: 2318–2341.
Jolliffe IT, Stephenson DB. 2003. Forecast Verification. A practi-tioner’s Guide in Atmospheric Science. John Wiley and Sons Ltd; 240 pp.
Kain J, Fritsch M. 1993. Convective parameterization for mesoscale models: the kain–fritsch scheme. The representation of cumulus convection in numerical models. Meteorol. Monogr. Am. Meteorol. Soc. 24: 165–170.
Kessler E. 1969. On the distribution and continuity of water substance in atmospheric circulation. Meteorol. Monogr. Am. Meteorol. Soc. 32: 84 pp.
Khain A, Rosenfeld D, Pokrovsky A. 2005. Aerosol impact on the dynamics and microphysics of deep convective clouds. Q. J. R. Meteorol. Soc. 131: 2639–2663.
Koenig LR, Murray FW. 1976. Ice-bearing cumulus cloud evolution: numerical simulation and general comparison against observations. J. Appl. Meteorol. 15: 747–762.
Lin YL, Farley RD, Orville HD. 1983. Bulk parameterization of the snow field in a cloud model. J. Clim. Appl. Meteorol. 22: 1065–1092. Liu CH, Moncrieff MW. 2007. Sensitivity of cloud-resolving simula-tions of warm-season convection to cloud microphysics parameteri-zations. Mon. Weather Rev. 135: 2854–2868.
Liu CH, Moncrieff MW, Tuttle JD, Carbone RE. 2006. Explicit and parameterized episodes of warm-season precipitation over the continental United States. Adv. Atmos. Sci. 23: 91–105.
Luna T, Rocha A, Carvalho AC, Ferreira JA, Sousa J. 2011. Modelling the extreme precipitation event over Madeira Island on 20 February 2010. Nat. Hazards Earth Syst. Sci. 11(2437–2452): 2011. McCumber M, Tao WK, Simpson J, Penc R, Soong ST. 1991.
Com-parison of ice-phase microphysical parameterization schemes using numerical simulations of tropical convection. J. Appl. Meteorol. 30: 985–1004.
Mlawer EJ, Taubman SJ, Brown PD, Iacono MJ, Clough SA. 1997. Radiative transfer for inhomogeneous atmospheres: RRTM, a val-idated correlated -k model for the longwave. J. Geophys. Res. 102(D14): 16,663–16,682.
Morrison H, Curry JA, Khvorostyanov VI. 2005. A new double-moment microphysics parameterization for application in cloud and climate models part I: description. J. Atmos. Sci. 62: 1665–1677. Morrison H, Thompson G, Tatarskii V. 2009. Impact of cloud
microphysics on the development of trailing stratiform precipitation in a simulated squall line: comparison of one and two-moment schemes. Mon. Weather Rev. 137: 991–1006.
Murphy AH, Winkler RL. 1987. A general framework for forecast verification. Mon. Weather Rev. 115: 1330–1338.
Petersen WA, Rutledge SA. 2001. Regional variability in tropical convection: observations from TRMM. J. Climate 14: 3566–3586. Skamarock WC, Klemp JB, Dudhia J, Gill D, Barker D, Duda M,
Huang X, Wang W, Powers J. 2008. A Description of the Advanced Research WRF Version 3 Technical Note TN-475+STR. NCAR. Thompson G, Field PR, Hall WD, Rasmussen RM. 2006. A new bulk
microphysical parameterization for WRF and MM5. In Proceedings of the Seventh Weather Research and Forecasting Model Workshop. NCAR Mesoscale and Microscale Meteorology Division: Boulder, CO; 1–11.
Thompson G, Rasmussen RM, Manning K. 2004. Explicit forecasts of winter precipitation using an improved bulk microphysics scheme part I: description and sensitivity analysis. Mon. Weather Rev. 132: 519–542.
Walko RL, Cotton WR, Meyers MP, Harrington JY. 1995. New RAMS cloud microphysics parameterization part I: the single-moment scheme. Atmos. Res. 38: 29–62.