SMART TOURISM – CITY TOURISM RADAR
Ana Filipa Marques de Lobão Bernardo
A Tourism Monitoring Tool at the City of Lisbon
Master Thesis presented as partial requirement for
obtaining the Master’s degree in Information Management
with specialization in Knowledge Management and Business
Intelligence
ii
NOVA Information Management School
Instituto Superior de Estatística e Gestão de Informação
Universidade Nova de Lisboa
SMART TOURISM – CITY TOURISM RADAR
A Tourism Monitoring Tool at the City of Lisbon
by
Filipa Lobão
Master Thesis presented as partial requirement for obtaining the Master’s degree in Information Management, with a specialization in Knowledge Management and Business Intelligence
Co-Advisor: Doutor Miguel de Castro Neto Co-Advisor: Doutora Manuela Aparício
iii
ACKNOWLEDGEMENTS
Finally, the time has come to reach the acknowledgements of this work.
I would like to thank my advisors, Professor Manuela Aparício and Professor Miguel Neto, for their advices, encouragement and support during this thesis. Your feedback and inspiration made it possible.
To my parents, who've always believed me, encouraged me to pursue my goals and motivated me through hard times.
To my friends, who also went on rough times, but always cheered and encouraged me to pursue this thesis.
To my partner, who celebrated each accomplishment with his endless patience and constant positive way.
iv
ABSTRACT
The increasing demand for Lisbon has led to an uncontrolled access to the city’s main attractions, which is reflected in the number of visitors that can be encountered at the city. Smart Tourism Destinations are gaining relevance in Smart Cities in everyday life, and technology is intricated more than ever in the cities and its citizens. Open Governance is a vital concept in any modern city and data is shared and available like never before. It is proposed a conceptual model to a city tourism dashboard and its materialization using Open Data from the city’s public portal, produced by the Lisbon City Council and other partners. It is also suggested a method to the conception of this tool and the main indicators that must be included based on the actual state of the art. It concludes with a proposal of future developments to perform on the smart tourism destinations area.
KEYWORDS
Information and Communication Technologies (ICTs); Information Management; Open Data; Open Governance; Smart Tourism Destinations; Tourism Monitoring Tool.
v
RESUMO
O aumento da procura de Lisboa como destino turístico conduziu a um acesso descontrolado aos seus principais pontos turísticos, refletindo-se no elevado número de visitantes que se visitam a cidade. As
Smart Tourism Destinations estão a ganhar cada vez mais importância no dia-a-dia das Smart Cities, e
a tecnologia está cada vez mais intrínseca nas cidades e nos seus cidadãos. Open Governance é um conceito vital em qualquer cidade atual, já que existem dados e informação disponíveis hoje em dia como nunca existiram antes. Neste trabalho, é proposta uma framework conceptual para visualizar a informação adequada à tomada de decisão no turismo de uma cidade onde são apresentados os principais indicadores que devem ser incluídos na mesma, com base no estado de arte atual. É também sugerido um método de instanciação desta ferramenta, utilizando dados abertos do portal público de dados abertos produzidos pela Câmara Municipal de Lisboa e por outras entidades. Este trabalho é concluído com uma proposta de futuros desenvolvimentos a realizar na área de Smart Tourism
Destinations.
PALAVRAS-CHAVE
Dados abertos; Destinos de Turismo Inteligentes; Ferramenta de Monitorização de Turismo; Gestão de Informação; Governança aberta; Tecnologias de Informação e Comunicação (TICs).
vi
INDEX
1.
Introduction ... 7
1.1.
Background and Problem Identification... 7
1.2.
Research Question and Objectives ... 7
1.3.
Study Relevance and Importance ... 8
1.4.
Thesis Methodology ... 9
2.
Literature Review ... 11
2.1.
Data management ... 11
2.1.1.
Open Data ... 11
2.1.2.
Intelligence Systems ... 13
2.2.
Smart Structures ... 15
2.2.1.
Smart Cities ... 16
2.2.2.
Smart Tourism Destinations ... 17
2.2.3.
Tourism Management ... 18
3.
Dashboard Research Methodology ... 21
3.1.
Conceptual Model ... 21
3.1.1.
Tool Design ... 21
3.1.2.
Conceptual Model Proposal ... 21
3.1.3.
Proposed Mock-ups ... 27
3.2.
Data Collection and Preparation ... 29
3.3.
Indicators Construction, Treatment and Relations ... 35
4.
Empirical Output ... 40
4.1.
Lisbon as a Smart Tourism Destination ... 40
4.1.1.
Lisbon Open Data portal ... 40
4.1.2.
TravelBI portal on national tourism ... 41
4.2.
Proposed Tourism Monitoring Tool ... 42
5.
Discussion ... 47
vii
5.2.
Data Preparation ... 47
6.
Conclusions ... 49
6.1.
Research findings ... 49
6.2.
Present Limitations and Future Research ... 50
References ... 51
viii
LIST OF FIGURES
Figure 1: Thesis methodology proposal. ... 9
Figure 2: NEC Global three-stage process evolution process of a city. (Accessed on 21
stNovember 2017 at http://www.nec.com/en/global/ad/campaign/smartcity/). ... 15
Figure 3: Methodological approach on the tourism management tool design. ... 21
Figure 4: Conceptual model proposal diagram. ... 26
Figure 5: Expenditures category mock-up proposal. ... 27
Figure 6: Travel category mock-up proposal. ... 27
Figure 7: Visit category mock-up proposal... 28
Figure 8: Activities/Satisfaction category mock-up proposal. ... 28
Figure 9: Accommodation category mock-up proposal. ... 29
Figure 10: Airbnb (July 2017) dataset attributes and created measures (view from PowerBI
relationships tab). ... 35
Figure 11: Nights per accommodation (2016 and 2017) dataset (view from PowerBI
relationships tab). ... 35
Figure 12: Guest per accommodation (2016 and 2017) dataset attributes and created
measures (view from PowerBI relationships tab). ... 36
Figure 13: Nights per country (2016 and 2017) dataset attributes and created measures (view
from PowerBI relationships tab). ... 36
Figure 14: Guests per country (2016 and 2017) dataset attributes and created measures (view
from PowerBI relationships tab). ... 37
Figure 15: Lisbon Hotels addresses (2017) dataset attributes and created measures (view from
PowerBI relationships tab). ... 38
Figure 16: Parishes (up to date) file attributes and created measures (view from PowerBI
relationships tab). ... 38
Figure 17: Airbnb (July 2017) – Parishes many to one relation (view from PowerBI relationships
tab). ... 39
Figure 18: Parishes - Lisbon Hotels addresses (2017) one to many relation (view from PowerBI
relationships tab). ... 39
Figure 19: Lisboa Aberta front page displaying the available dataset categories. ... 41
Figure 20: TravelBI front page displaying the current measures on the Portuguese tourism
data. ... 42
Figure 21: Accommodations per Lisbon Parish final report (at PowerBI report tab). ... 43
Figure 22: Guests per country final report (at PowerBI report tab). ... 43
ix
Figure 24: Occupancy per accommodation final report (at PowerBI report tab). ... 45
Figure 25: Stay per accommodation final report (at PowerBI report tab). ... 46
x
LIST OF TABLES
Table 1: Thesis objectives. ... 8
Table 2: Open Data literature review. ... 12
Table 3: Intelligence Systems literature review. ... 14
Table 4: Smart Cities literature review ... 16
Table 5: Smart Tourism Destinations literature review. ... 17
Table 6: Tourism Management literature review. ... 19
Table 7: Proposed conceptual model on the indicators to present on a smart tourism
destination. ... 22
Table 8: Countries analysed for tourism dashboards. ... 29
xi
LIST OF ABBREVIATIONS AND ACRONYMS
BI
Business Intelligence
CML
Câmara Municipal de Lisboa (Lisbon City Council)
CSV
Comma Separated Values file
DR
Demand Response
DW
Data Warehouse
GPS
Global Positioning System
ICTs
Information and Communication Technologies
INE
Instituto Nacional de Estatística (Portuguese Statistics Institute)
IoT
LAC
Internet of Things
Limits of Acceptable Change
MDSS
Marketing Decision Support System
STDs
Smart Tourism Destinations7
1. INTRODUCTION
1.1.
B
ACKGROUND ANDP
ROBLEMI
DENTIFICATIONAccording to Eurocities (2016), citizens are at the hearth of a Smart City process and technologies are the key enablers. People are the sensors that provide anonymous data, availability of city services and events detection (Goodchild, 2007). Haklay (2013) proposed four levels of citizen participation. The first level is crowdsourcing, the second is distributed intelligence, the third is the participatory science, and the fourth is the extreme participation, characterized by the level of citizenship collaboration. In most cities, citizen science is still in the earliest phase, and by rethinking governance, design and creation, there’s an increase of innovative solutions, where data has tremendous importance, while standards and interoperability are crucial for a Smart City (Mitchell, Villa, Stewart-Weeks, & Lange, 2013).
Nowadays, the stream of tourists at any trendy destination is increasing every day, leading to problems on the number of people that circulate, even on smaller or more traditional cities. It is a priority to investigate on tourism demand growth and the social impacts of tourism (Faulkner & Tideswell, 1997). Several investigators have researched on tourism management and smart tourism destinations, but the findings somehow present limitations in the way that further research is needed to validate findings and to expand the theoretical contributions of such (Buhalis & Amaranggana, 2014). Also, "the
application of the concept of sustainable development as an achievable and practical objective for tourism has not yet matured." (Ko, 2005, p. 431). As so, a need has emerged to take a further look on
this matter, which has motivated this Masters’ Thesis. Its aim is to research whether it is possible to build an artefact to help monitor the tourism of Lisbon using Open Data from the city Open Data Portal, and also propose the indicators that should be included in such.
1.2. R
ESEARCHQ
UESTION ANDO
BJECTIVESAlthough there are currently some Portuguese organizations working on this topic, namely the Lisbon City Council (Câmara Municipal de Lisboa – CML), Turismo de Portugal and Turismo de Lisboa associations, none provides a conceptual model on how to monitor the city tourism yet. Further study was required on how different stakeholders can benefit from a city tourism monitoring tool and this motivated the research question of this work.
Several questions emerge on using Lisbon tourism’s Open Data to observe the city tourism. As so, the main objective of this thesis is to investigate if an auxiliary tool that helps monitoring the tourism inside the city can be built using Lisbon Open Data. In this context, it is proposed a model to measure and to help monitoring the urban tourism in the city. As a research approach after a theoretical background review, other examples from other countries dashboards on tourism were analysed. This research may represent an important stage by warning to the need for a deeper knowledge of the tourism development at a particular city, and how can it be explored and managed more intelligently by different participants. Below, the next table summarizes this thesis main objectives.
8 Table 1: Thesis objectives.
Specific Goals How is Lisbon benefitting? How are the citizens
benefitting?
Develop a conceptual model to monitor the tourism in Lisbon using Open Data from the Lisbon
Open Data Portal
Able to monitor the local dynamics and development
Evolution of the city in an intelligent manner
Materialize the proposed model in an empirical tool
Able to see and take insights based on the local data
Information is shared visually and is not “just” data
Propose a conceptual model that is usable with Open Data from other
cities
Lisbon as an example to other cities in the Smart Tourism
Destinations topic
Information visually available
1.3. S
TUDYR
ELEVANCE ANDI
MPORTANCEAccording to Turismo de Portugal (2017) in an analysis to the number of nights spent in Portugal in the first quarter of 2017, the frequency increased to 3,3 nights per visitors who came from outside the country, led by Lisbon, having amplified the visitors originated from Brazil, the United Kingdom, the United States of America, Spain and Germany. This growth triggered the tourism sector income to nearly 715 million euros, and the hotel occupancy rate to more than 55%. Considering the above, it may be relevant to search for motives for non-Portuguese visitors to demonstrate such a high interest in this country. Furthermore, it may be even more motivating to track the good examples found on Smart Cities all over the world, but especially from the citizens’ countries who visit it.
Let’s consider Brazil, where the city of Natal, a Smart City, was tested during the 2014 FIFA World Cup. By collecting, processing, sharing, storing and analysing the tourists’ behaviour, and also their location, an infrastructure was developed to plan and manage the city, but also to provide an improved visitor experience during the event (Cacho et al., 2016). The app collected information and had sections like the city guide, allowing the tourist to share touristic information, and was connected to a Business
Intelligence infrastructure, providing information on: the areas of interest for tourists; the areas of
interest for tourists in different periods; and the meeting point among different groups of tourists. This project was extremely relevant for the authors to provide practical implications for the cities that currently develop to become Smart Tourism Destinations (STD), and it is stated that one of the next steps would be to analyse the resulting data and collect new data about the smart initiatives on the city, besides the regular visitor and location based information, in order to improve the cities’ infrastructures (Corrêa, 2013; Paper, 2015; Rennó, 2014). This seems to be an important point that the present thesis may help contributing to.
9 However, not only foreign countries develop Smart City projects. Portugal is the first country to have a Smart Island project developed by Vodafone (2017), and a truly living laboratory for this research field at Azores, as well as many other Smart Cities initiatives on a national scale (INTELI, 2014). As so, not only visitors but also the Portuguese citizens may benefit with this initiative, but also international interest is captured with multinational organizations. It is, thus, easy to imagine the main advantages not only for the tourism sector, but also for the public mobility and transports, customer service, and citizens’ satisfaction with such initiative.
The two main questions of Who will be interested in the results of this thesis? and Who can benefit
from the findings? can now be clarified, as the present work aims to serve the best interest of all
citizens and to benefit them by adding new meaning to the existing information, allowing for its exploration, and also find new possible improvements for the city of Lisbon.
1.4. T
HESISM
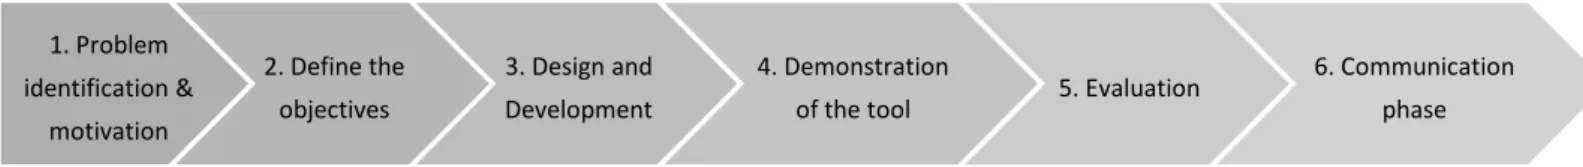
ETHODOLOGYThe following activity plan sums up the methodology steps proposed for this thesis development. It is based on the Design Science Research Methodology presented by Vaishnavi, Kuechler & Petter (2004).
Figure 1: Thesis methodology proposal.
1. Problem Identification and Motivation
As stated previously, tourism is increasing in Lisbon but few insights are currently made on the Open Data available at the city council open data portal. As no tourism conceptual model has been proposed, an artefact is suggested on how to monitor it would be valuable to help achieving a better understanding and gain information of the city tourism patterns.
2. Define the objectives for a solution
After analysing if it is possible to build an artefact to monitor the tourism of Lisbon using Open Data, the main objectives for a solution are to develop a conceptual model to monitor the tourism in Lisbon using Open Data from the Lisbon Open Data Portal, demonstrate it in an empirical tool and propose it in a way that it can be used within other cities using Open Data.
1. Problem identification & motivation 2. Define the objectives 3. Design and Development 4. Demonstration
of the tool 5. Evaluation
6. Communication phase
10
3. Design and development
The design of the monitoring tool will be based choosing among the indicators identified at six tourism dashboards form different countries. This will help gaining insights on the existing work and to start designing the artefact.
4. Demonstration of the tool
Mock-ups will be produced and chosen to demonstrate the monitoring tool upon design and development of the artefact. A dashboard will be developed using Microsoft Power BI software (Microsoft, 2019) to assess for the usage of the conceptual model in several reports, using Lisbon Open Data.
5. Evaluation
After materializing the conceptual model, an evaluation on how well the artefact supports the solution to the problem will be performed, that is, if nowadays the proposed conceptual model answers to the possibility of monitoring the city of Lisbon using Open Data. The initial objectives for the solution will be compared to the actual solution, by assessing its results in the empirical tool descripted above.
6. Communication phase
Upon the evaluation phase is completed on how well the conceptual model answers the initial problem, its utility and novelty will be presented, along with the current limitations and possible future development suggestions, to researchers and relevant audiences in a conference or a scientific magazine.
This thesis will be managed in order to achieve the proposed goals and to follow as much as possible the methodology described at this section, along with other upcoming methods.
11
2. LITERATURE REVIEW
On this chapter, it is presented the literature review that contains the main references and theoretical concepts found in this thesis. It starts with an analysis on data management, covering the Open Data and Intelligence Systems topics, followed by an exploration on Smart Structures, which cover the Smart Cities, the Smart Tourism Destinations and the Tourism Management subjects.
2.1. D
ATA MANAGEMENTThe concept of Business Intelligence (BI) is defined differently, as it depends on which area it is being used. According to Côrte-real, Neto, & Fátima (2012), some authors define Business Intelligence as a productive process with a base made of information and knowledge as the result, others define it as a concept that comprises architectures, tools, databases, applications and methodologies. As so, the concept presents a uniqueness for each organization, being influenced by its business rules.
On Britto & Júnior (2006) study on implementing and keeping a continuous improvement program of data quality on data warehouses, the authors explore data quality dimensions, the main problems when acquiring data, its wrong usability, poor quality and its impact, and the challenges on data quality for a Data Warehouse. Organized and clean data is not given its proper importance yet, as the same data may be interpreted differently by users and the management teams are not yet aware of it. Although a framework for data quality when building a Data Warehouse is proposed by the authors, data quality can only be kept if users make its usage a routine, and understand the solution itself. This way, data quality can be measured, analysed and improved throughout time, improving the organization results. It is, thus, an urge that good practices are promoted and tracked at the user level, so data follows the correct path for higher quality. At the present work, this component of BI could be tracked by the city council Chief Information Officer and a robust team that controls quality and assures all users, at the organization and outside of it, have the same understanding on data.
Following this topic, Côrte-real et al. (2012) proposed a model that assesses an organization using BI, allowing it to maximize IT resources fully. Maturity measures the ability of an organization for continuous improvement at a certain area. Maturity models may be subjective, as they focus on BI effects on specific and possibly problematic areas only, and do not indicate how to improve a situation, but they can be adapted to an organizational culture and maturity factors, as well as on its economic position, technical architecture and users’ needs. This way, at the present thesis, this concept may be useful to help assessing the city council ability of improving the accessibility to the open data.
2.1.1. Open Data
According to the Open Data Guide (Dietrich et al., 2012, p.6), “Open data is data that can be freely
used, re-used and redistributed by anyone - subject only, at most, to the requirement to attribute and sharealike.” Open data is defined by the Open Definition as having:
12 1. Availability and Access: the data must be available as a whole and at no more than a reasonable reproduction cost, preferably by downloading over the internet. The data must also be available in a convenient and modifiable form.
2. Re-use and Redistribution: the data must be provided under terms that permit re-use and redistribution, including the intermixing with other datasets.
3. Universal Participation: everyone must be able to use, re-use and redistribute - there should be no discrimination against fields of endeavour or against persons or groups. For example, ‘non-commercial’ restrictions that would prevent ‘commercial’ use, or restrictions of use for certain purposes (e.g. only in education), are not allowed.
4. Machine Readability: Data must be available in form readily processable by a computer and where the individual elements of the work can be easily accessed and modified.
Open Data is defined, according to Open Knowledge International, as non-confidential data, produced with public money, that can be edited and used by everyone, without restrictions on its usage or distribution (Janssen, Charalabidis, & Zuiderwijk, 2012; Neto, Neves, Rego, & Cartaxo, 2017). “Open
means anyone can freely access, use, modify, and share for any purpose (subject, at most, to requirements that preserve provenance and openness)” (Open Knowledge Foundation, 2009, n.a.).
The Open Government concept proposed by Sandoval-Almazan, Luna-Reyes, Rojas-Romero, Gil-Garcia & Lun (Sandoval-Almazan, Luna-Reyes, Rojas-Romero, Gil-Garcia, & Luna, 2012) implies a change from the traditional principle of accountability to a state of citizen empowerment, which was studied by exploring the use of open data and mobile apps in the top countries according to the UN 2010 e-Government Survey. The findings were that although not all countries offered mobile apps to their citizens, several apps created citizen value, where private companies and citizens are getting involved in the creation of such. All these tools and applications potentiate the e-government to allow citizens to create and access content and communicate to government officials, which can add value to the existing information and allow citizens to generate networks that can solve urgent public problems. All the above can be an illustration for the national panorama and constitute a mode of integrating the citizens on the local issues that a city may face. However, public free apps are important to be publicized, as citizens will choose it only if its importance is made available and promoted publicly. This way, the app interacts and establishes a direct contact between open data and the citizens. At the next table, the concepts of Open Data and Open Government are explored.
Table 2: Open Data literature review.
Authors Keywords Concepts Study Objectives
Sandoval-Almazan, Gil-Garcia, Lunas-Reyes, Lunas, &
Rojas-Romero (2012)
Government apps, apps, mobile apps
Change in focus from the traditional principle of accountability to a concept
of citizen empowerment.
Explore the use of open data and mobile apps in the top
countries (UN 2010 e-Government Survey).
13
Authors Keywords Concepts Study Objectives
Janssen, Charalabidis, & Zuiderwijk (2012) Systems theory; institutional theory; adoption; diffusion; open
data; open government; governance; transformation
Open data - privacy-restricted and non-confidential data produced with public money and made
available without any restrictions on its usage or
distribution.
Benefits of and barriers to open-data systems using people’s experiences with
open data obtained from interviews and a group
session."
Neto, Neves, Rego, & Cartaxo (2017)
Open data; smart cities; Portugal
Open data - data that can be used, modified and shared
by an individual for any purpose.
"Provide an overview of the open data landscape in
Portuguese cities”
Where does the community positions Open Data? Janssen et al. (2012) analysed Open Data systems benefits and barriers by interviewing people and promoting group sessions on their study. A step was taken from a closed to an open system of public data, as the government also benefits while learning with the public feedback, and these systems reinforce existing structures instead of changing them. However, Janssen et al. (2012, p. 260) state that “Open Data has no value itself, it only becomes
valuable when used", and the barriers presented on its use, complexity, legislation, quality and
participation, may make the data private in practical terms. The data provider is not where the success for the Open Data lies, but on its quality, and the use it can have in real case scenarios. As so, open data traits have to improve along with a culture of open government but also with tools and infrastructures to use this data and help users make sense of it. This way, the public engagement may exceed the current level, and promote the use of collective intelligence of all the citizens.
At Portugal, a study on the Open Data national scenario was performed by Neto et al. (2017). It is known that the public sector is following the public entities strategy on providing Open data to the citizens. Recently, a Portuguese telecommunication company just released a portal on tourism where locally positioning data is displayed in striking interactive dashboards, allowing to know where most tourist go when visiting Portugal. This data is private and was collected based on the company’s users GPS signal, so it has a huge commercial importance and unfortunately is not yet available as Open Data. Nevertheless, there are three Open Data portals in the country, organized by Lisbon (http://lisboaaberta.cm-lisboa.pt/), Porto (https://dadosabertos.cm-porto.pt/) and Oeiras (http://dadosabertos.cm-oeiras.pt/), that display datasets from different sectors and a Data Index that gives insights on data quality and possibilities of improvement. However, the current legislation at Portugal is what compels the municipalities to display Open Data, which makes it a legal obligation, and not so much of a business enhancer, possibly compromising the current Open data quality at the country.
2.1.2. Intelligence Systems
As stated before, adding value to Smart Cities solutions that make the decision-making process more efficient is a current need to make these more effective. But in which way do decision support systems contribute to Smart Cities?
14 Silva, Khan, & Han (2017) promote the Smart City concept as an enhancer of the urban citizens life quality, involving other city areas like community, transportation, healthcare and parking, among others. The authors add that the collaboration of these solutions with Big Data analytics assures a more flexible and real-time data processing, leading to more intelligent decisions. A framework to deploy solutions that enable real-time decision making, data collection autonomous processes, and user-centric energy customizing is proposed, using data originated in daily operational activities on a city, and later on, real-time data that comes from connected devices within the city suburbs.
Unquestionably, Big Data can be used for future Smart Cities development and planning based on the existing data from various sources. The proposed system can efficiently process data independently of its size, and generates warning events in real time, but does not reflect a general solution to every system present in a smart city, as it was designed for specific goals. The next table sums up some concepts from Intelligence Systems.
Table 3: Intelligence Systems literature review.
Authors Keywords Concepts Study Objectives
Wöber (2003)
Marketing decision support systems (MDSS);
Tourism statistics; Internet
Marketing decision support system (MDSS - supports organizations in collecting,
storing, processing, and disseminating information, and in the decision-making
process by providing forecasts and decision
models.
Provide insights into a successful implementation
of a MDSS in tourism, and discuss the information
needs in tourism management.
Silva, Khan, & Han (2017)
Smart City; Smart City architecture
Smart City enhances the quality of life of urban citizens, involving multiple
disciplines, that is, smart community, smart transportation, smart healthcare, smart parking,
and many more.
Exploit realistic smart city architecture to enhance data processing efficacy to enable real-time decision-making.
Yoo, Goo, Huang, Nam, &
Woo (2017)
Smart tourism technology, Elaboration
likelihood model, Self-efficacy, Human-computer Interaction, Travel decision support
satisfaction
Smart tourism technologies (STTs) in this study refer to any forms of IT that tourists
interact for information search, transaction, communication, and content
generation.
Answer “What central and peripheral routes in STTs
influence tourists' travel decision support
15 Other systems that are helpful on supporting an organization in storing, processing, and disseminating information are the Marketing Decision Support System (MDSS), as these provide forecasts and decision models. Wöber (2003) displays a case of success when implementing a MDSS at a tourism scenario and the necessary information in tourism management. According to the author, it is necessary to have a database that contains tourism market research data, several program models to convert methods/models to simple outcomes, and administrative programs that assist the maintenance of the database and control what activities users search for at this sector, obtaining market research data for those activities. A program is presented, with a relatively user-friendly interface and few technical knowledges required to operate it, but the major problem lies on the methods to measure so. The user behaviour data shows the need to improve data processing in tourism market research results at the present and future focus.
Another concept on intelligence systems are the Smart Tourism Technologies (STTs), which are any forms of IT that tourists interact whit when looking for information, transaction, communication and content generation. The recent study of Yoo, Goo, Huang, Nam, & Woo (2017) aims to understand the connection between STTs and tourist’s behaviour and emotions, by collecting data at an individual level from a travel club at South Korea and contributing the current literature in tourism. The authors identified the factors that influence the tourist decision support satisfaction in the smart tourism context as the used technology self-efficacy, which controls the STT-supported travel planning and decision-making process. This model may be limited, as the sample was small and may reflect the uniqueness of the travel club population, but it also shows that that self-efficacy toward STT use plays a critical role in determining which decision route a user is taking, which has not been investigated before as a critical factor that determines the information processing when using STTs.
2.2. S
MARTS
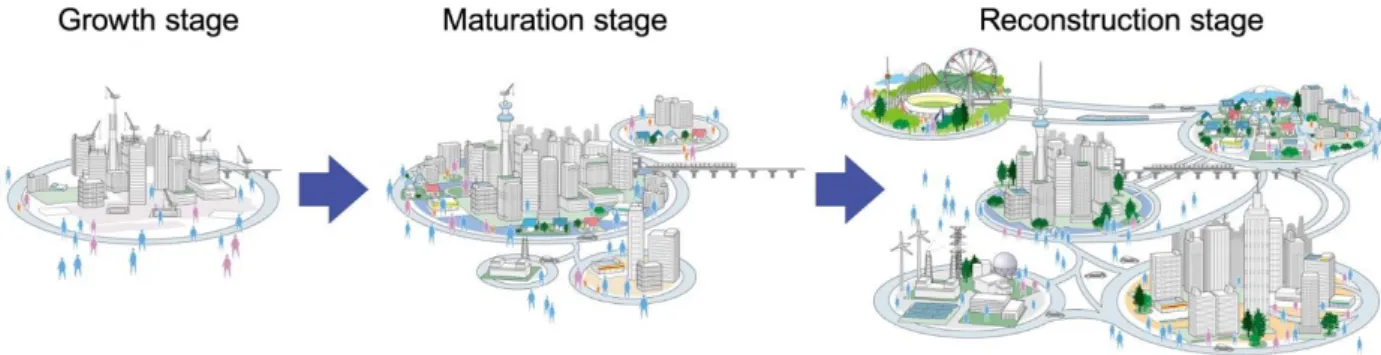
TRUCTURESThe Smart City concept emerged on the problems that modern cities faced as a result of a higher influx of citizens in the urban areas. As so, living in a city has become an increasing challenge, both to citizens and governance (Perera, Zaslavsky, Christen, & Georgakopoulos, 2013). Some companies have started to develop solutions to support cities as they evolve, such as NEC Global that states that cities have a three-stage process when evolving, displayed at the next figure.
Figure 2: NEC Global three-stage process evolution process of a city. (Accessed on 21st November 2017 at http://www.nec.com/en/global/ad/campaign/smartcity/).
16 The initial growth stage is marked by the quick development of the city infrastructure, to answer industrial growth and an increase in its population. The second stage is where a maturation phase prevails, where a stabilization in the city development is presented, quality is prioritized, which didn’t occur before, and goods and services are improved. The final stage, as the city, goes through a reconstruction phase, and a renewal of its services and further development, there is a collaboration among cities to meet new challenges and to work on satisfying residents’ expectations (NEC Global, 2017).
2.2.1. Smart Cities
It is not only important to understand Smart Cities applications, benefits and advantages, but also the current technologies and its capabilities on merging in different phases of Smart Cities solutions. As so, the concepts of Smart and Intelligent City are explored in the table below.
Table 4: Smart Cities literature review
Authors Keywords Concepts Study Objectives
Deakin & Waer (2011)
Innovation and creative partnerships; intelligent cities; networks; smart
cities; smart communities; methodology
Intelligent city is the application of electronic and
digital technologies to communities; the use and
inclusion of information technologies to transform life
in a region (..) promoting innovation, learning, knowledge and problem
solving."
Reflect upon the anxieties currently
surrounding such developments, (…) that have
more to do with cities meeting the corporate needs of marketing campaigns than
the social intelligence required for them to be
smart.
Komninos (2011)
Amplification intelligence; Amsterdam Smart City; Bletchley Park; Cyberport
Hong Kong; instrumentation intelligence; intelligent cities; intelligent ecosystems; orchestration intelligence; smart cities
‘Smart’ and ‘intelligent’ are easily assigned to any digital
application associated with cities – often just for marketing purposes – without making clear what
intelligence is being improved and how.
Spatial intelligence - ability of a community to use its
intellectual capital, institutions and material infrastructure to deal with a
range of problems and challenges.
Discuss the use of ICTs and institutional frameworks that
support innovation ecosystems of cities and increase the problem-solving
capability of communities and cities.
17 Starting by exploring the concept of a Smart City, what makes a city truly smart or intelligent? Deakin & Al Waer (2011) compared both notions by taking Hollands (2008) work on the stated definition of a city as smart as the starting point to study the transition from a Smart to an Intelligent City. The networking role, the innovation and the partnerships creativity are seen as easy to gather and to develop on strengthening actions, but should not be discarded when meeting a city capacity-building and knowledge-transfer needs. Moreover, some partnerships tend to form short-term measures that contribute to aesthetic features, and not so much to a general knowledge among citizens on social, cultural, environmental and civic values on transposing a city to a Smart City.
Furthermore, the majority of Smart Cities solutions did not have a complete impact on the city challenges, such as its sustainability, competitiveness and employment. According to Komninos (2011), knowledge on making a city intelligent is still lacking, as cities tend to be digital only. As so, we assist to a few challenges on making a city not only technologically capable, but also spatially intelligent, even having the technological resources fully present. And that creates a need to engineer the integration of solutions between the digital and physical properties for each city ecosystem, as key to a higher spatial intelligence. The relation between a smart city and an intelligent city, can be on the level of citizen participation, as stated by Haklay (2013) on the four levels of participation presented before.
2.2.2. Smart Tourism Destinations
According to Buhalis & Amaranggana (2014), Smart Tourist Destinations represent a destination where technology is embedded within the city, having as top priorities the improvement of tourists travel experience; efficiently gathering and distributing information at the destinations; enabling an efficient allocation of tourism resources; and distributing this sector benefits at the local society. Following this idea, the Information and Communications Technologies (ICTs) improve city services, by coordinating them and leading to engaged and better-informed citizens. The concepts of Smart Tourism Destinations are explored in the next table.
Table 5: Smart Tourism Destinations literature review.
Authors Keywords Concepts Study Objectives
Buhalis & Amaranggana
(2014)
Smart tourism destinations Internet of things; Smart city; Travel and tourism; Technology
ICTs will coordinate all activities and services, leading to connected, better
informed and engaged citizens.
Smart City - environment where technology is embedded within the city (…) to improve citizens quality of life, while also improve city
services efficiency.
Take advantage from the development of Smart Cities
by conceptualizing framework for Smart Tourism Destinations.
18
Authors Keywords Concepts Study Objectives
Zacarias, Cuapa, De Ita & Torres
(2015)
Smart Tourism; GPRS; WAP; TSP; Google Maps
API
Smart City World Heritage
To know about the effects that tourists can experiment
when they are visiting a place instead of knowing how they manage or plan
their vacation.
Cacho, Mendes-Filho & Lopes
(2016)
Smart city, Smart tourism destination, Mobile application, Mobile
tourist guide
A destination is considered “smart” when it makes extensive use of technologies
(…) to improve the travelers experience, and empower the tourism industry with the
tourist data collected within the destination.
To describe a smart city initiative presenting a mobile
tourist guide developed for Natal, Brazil.
Every tourist has a limited knowledge of the visited destination, but the development of crowd-sourced applications by using their input can give a valuable insight on their demands and expectations. Some cities have even started presenting exploratory smart city case studies by producing mobile tourist guides, which is the case of Natal, a city at Brazil, that used the FIFA World CUP 2014 event to collect more knowledge on smart cities’ initiatives and mobile applications. By personalizing and making tourists aware of tourism services locally available, the tourist experience improved, and also empowered the tourism industry with the collected data from every user at the city of Natal, allowing the visitors and citizens to get real-time services anytime and the interconnection of all the local organizations (Cacho et al., 2016).
Nevertheless, it is important not only to know the vacation plan of a tourist, but also the effects that one can experiment when visiting a certain place. Zacarias, Cuapa, De Ita & Torres (2015) present in their study two interfaces to a mobile app, a traditional and a minimalist one, having stated that the minimalist interface had greater acceptance among users. The brief textual interface was better accepted at the minimalist interface, but the traditional, which present icons, was accepted as one that the user perceives naturally. As so, sentiment analysis may also have an important role when developing a mobile tourist guide by creating an application that not only enriches the tourist knowledge on a particular subject, but also makes it more enjoyable.
2.2.3. Tourism Management
Tourism impact at a particular community and the acceptability of the changes is relevant to assess. That’s when Tourism Management arises - the tourism demand increases and the social impact must be planned locally. The following table organizes the Tourism Management subjects.
19 Table 6: Tourism Management literature review.
Authors Keywords Concepts Study Objectives
Faulkner & Tideswell
(1997)
Tourism demand growth; social impact
of tourism
Tourism with a social impact in the local
community
Framework designed for a comparative study of
the social impacts of tourism in destination communities along the
eastern seaboard of Australia.
Ahn, Lee & Shafer (2002) Sustainable tourism development; Limits of acceptable change; Tourism development zones; Indicators Limits of acceptable change (LAC) planning
framework has good potential as a tool that
can assist in operationalizing the sustainability concept.
Use the LAC framework as a guide to examine and inform the process of
sustainable tourism development on a regional scale. Ko (2003) Tourism sustainability assessment; Systems; Dimensions; Indicators; Tourism sustainability assessment maps (TSAMs)
The application of the concept of sustainable development as an achievable and practical objective for tourism has
not yet matured.
To develop a procedure for the assessment tourism sustainability. Park & Jamieson (2009) Tourism impacts, indicators, collaboration, Delphi method, destination-monitoring system, tourism stakeholders HTD - Hawaii Tourism Dashboard; Indicators of Tourism Impacts; Indicators of Tourism Impacts on Destination and Community; Indicators of Destination Sustainability Development processes of the Hawaii Tourism
20
Authors Keywords Concepts Study Objectives
Boes, Buhalis & Inversini (2015)
Conceptualizing Smart Tourism Destination
Dimensions
Smart city; ICT; Smart tourism destinations;
Technology
Smart City - concept that introduces ICTs within an urban area to incorporate
urban processes in contemplation of
enhancing the competitiveness of the city (Caragliu et al. 2011)
while simultaneously enhancing the quality of
life for its citizens (El Segundo 2014).
Regional tourism planning may assist on a viable sustainable tourism, and so Ahn, Lee, & Shafer (2002) used the LAC (Limits of Acceptable Change) framework, initially developed by Stankey, Cole, Lucas, Petersen, & Frissell (1984) to manage change in designated wilderness, to examine locals attitudes towards tourism development and types of tourism services, local conditions and perceptions on how local conditions might change due to the tourism demand. The authors concluded that the three examined communities differed in their evaluation, but a technical process like LAC may be helpful on defining and operationalize tourism sustainability as its development begins. Faulkner & Tideswell (1997) also investigated this matter and stated that the locals are aware of the positive effects of tourism on their life quality, economic and employment benefits are recognized, and some communities even adapt to tourism and develop a resilience that “enables impacts to be accommodated".
Both studies are important on anticipating and avoiding future questions, but the application of the sustainable tourism concept as a tourism objective is still undeveloped (Ko, 2005). The integration of ICTs (Information and Communication Technologies) alone is not sufficient to transform a city into a Smart Tourism Destination, as human capital, leadership, social capital and innovation are fundamental requirements to develop a Smart City supported and enabled by ICTs. Like Cloud Computing and the Internet of Things (IoT), ICTs are the infrastructure providers for developing a Smart Tourism Destination, by simultaneously improving its citizens quality of life and the city competitiveness (Boes, Buhalis, & Inversini, 2015). In order to raise tourism sustainability in Hawaii, Park & Jamieson (2009) developed a diagnostic tool to monitor Hawaii’s tourism conditions, raise public awareness on tourism and assist decision making and policy development by the local government and industry. As stated by the authors, developing a process with indicators to assess accurately tourism development and activities was one of the challenges, but it is expected to ultimately contribute to make the state more sustainable and to develop an explanatory model that determines the level of its sustainability as a tourism destination.
21
3. DASHBOARD RESEARCH METHODOLOGY
3.1. C
ONCEPTUALM
ODELAs a research approach after a theoretical background review, six developed countries’ dashboards on tourism were analysed, and its main indicators are presented in a conceptual model to allow for the creation of the future dashboards. This research represents an important phase by alerting to the need of better understanding tourism processes at a particular city, and how can it be intelligently explored.
3.1.1. Tool Design
Conceptualizing the reviewed theoretical background and after data collection, a tool for measuring and to help monitor the urban tourism in a city is proposed in the figure below.
A tool design proposal has utmost importance on a smart tourism destination. Few authors have proposed such and a “change in focus from the traditional principle of accountability to a concept of citizen empowerment” is the main point on exploring open data (Janssen et al., 2012; Sandoval-Almazan et al., 2012). Based on the current state of the art in this area, it is essential to collect cases where similar work has been done. The monitoring tool design began with the identification of relevant dashboards, followed by a selection of relevant indicators on each. After being assessed for their objectives and measurable KPIs (Key Performance Indicators) (Zahra, 2011), the design of mock-ups followed with the appropriate visual presented to each indicator. Finally, the results were evaluated and explored on its relevance and appropriateness, and finally implemented and trailed on the tool future conditions and importance.
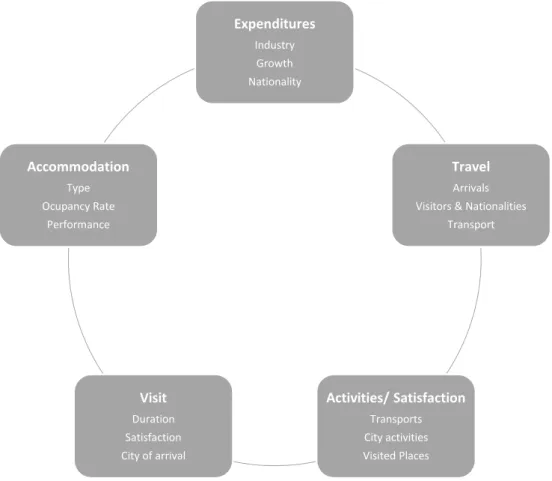
3.1.2. Conceptual Model Proposal
Based on the previous method, a selection of the indicators that were required to use on a tourism monitoring tool was made and assembled on the next table and originated five major categories – Expenditures, Travel, Activities/Satisfaction, Visit and Accommodation. The indicators were chosen based on the authors’ publications and the number of different indicators that referred to the same topic, as summarized on the table below.
Identify Smart Tourism dashboards at other countries Select the indicators of interest at each dashboard Define appropriate KPI's for Lisbon dashboard Design mockups and arrange specifications Evaluate and select dashboards to use Implement and maintain the dashboard
22 Table 7: Proposed conceptual model on the indicators to present on a smart tourism destination.
Dimension Indicators Source Reference
Expenditures Average expenditures by industry New Zealand Tourism Portal http://www.mbie.govt.nz/info- services/sectors- industries/tourism/documents-image-library/key-tourism-statistics.pdf
Average expenditure growth by month/year New Zealand Tourism Portal http://www.mbie.govt.nz/info- services/sectors- industries/tourism/tourism-research-data/monthly-regional-tourism-estimates Average expenditure per
foreign visitor (by year/month/total) Japan Tourism Portal http://www.mlit.go.jp/common/00099172 5.pdf Travel Monthly arrivals Australia Tourism Portal http://www.tourism.australia.com/en/mar kets-and-research/tourism-statistics/international-visitor-arrivals.html
Monthly arrivals per country of origin Australia Tourism Portal http://www.tourism.australia.com/en/mar kets-and-research/tourism-statistics/international-visitor-arrivals.html
Number of visitors by country of origin Hawaii Tourism Portal http://dbedt.hawaii.gov/economic/current _economic_conditions/tourism-dashboard/ New Zealand Tourism Portal http://www.mbie.govt.nz/info- services/sectors- industries/tourism/documents-image-library/key-tourism-statistics.pdf http://webrear.mbie.govt.nz/summary/ne w-zealan Australia Tourism Portal http://www.tourism.australia.com/en/mar kets-and-research/tourism-statistics/international-visitor-arrivals.html Japan Tourism Portal http://www.mlit.go.jp/common/00099172 5.pdf UAE Tourism Portal https://www.visitdubai.com/en/tourism-performance-report
Transport type Scientific
23
Dimension Indicators Source Reference
City number of Visitors (compared with the previous year) USA Tourism Portal https://www.trade.gov/travelindicators/tra vel-performance-indicators.pdf Japan Tourism Portal http://www.mlit.go.jp/common/00099172 5.pdf Travel
Number of visitors per country region Japan Tourism Portal http://www.mlit.go.jp/common/00099172 5.pdf
Average growth per city
New Zealand Tourism Portal http://www.mbie.govt.nz/info- services/sectors- industries/tourism/documents-image-library/key-tourism-statistics.pdf
Total arrivals by purpose of visit New Zealand Tourism Portal http://www.mbie.govt.nz/info- services/sectors- industries/tourism/documents-image-library/key-tourism-statistics.pdf
Travel Promotion Fees Collected USA Tourism Portal https://www.trade.gov/travelindicators/tra vel-performance-indicators.pdf
Travel preparation level Scientific
paper Huang, Goo, Nam, & Yoo (2017)
Activities/ Satisfaction
Level of satisfaction with the available public
transportation
Scientific paper Level of satisfaction with the
available activities in the
city/country Ko (2005)
Number of visited main points of interest
Visit Length stay
Hawaii Tourism Portal http://dbedt.hawaii.gov/economic/current _economic_conditions/tourism-dashboard/ New Zealand Tourism Portal http://www.mbie.govt.nz/info- services/sectors- industries/tourism/documents-image-library/key-tourism-statistics.pdf
24
Dimension Indicators Source Reference
Visit Length stay England Tourism Portal https://www.visitbritain.org/latest-england-research-reports Length stay by accommodation type New Zealand Tourism Portal http://www.mbie.govt.nz/info- services/sectors- industries/tourism/documents-image-library/key-tourism-statistics.pdf Satisfaction level Japan Tourism Portal http://www.mlit.go.jp/common/00099172 5.pdf
Willingness of visiting the country/city again Japan Tourism Portal http://www.mlit.go.jp/common/00099172 5.pdf City of Arrival Hawaii Tourism Portal http://dbedt.hawaii.gov/economic/current _economic_conditions/tourism-dashboard/ Rate of returning visitors (not
the first time visiting the city) Scientific paper Gomezelj & Mihalič (2008) Safety feeling level compared
with other cities Scientific paper Gomezelj & Mihalič (2008)
Accommodation Accommodation occupancy rate New Zealand Tourism Portal http://webrear.mbie.govt.nz/summary/ne w-zealan Japan Tourism Portal http://www.mlit.go.jp/common/00099172 5.pdf
Average nights spent
New Zealand Tourism Portal http://www.mbie.govt.nz/info- services/sectors- industries/tourism/tourism-research- data/ivs/international-visitors-nights-interactive-map
Average nights spent per visitor’s country of origin
New Zealand Tourism Portal http://webrear.mbie.govt.nz/summary/ne w-zealan Number of traveling
25
Dimension Indicators Source Reference
Accommodation Hotel Performance Hawaii Tourism Portal http://dbedt.hawaii.gov/economic/current _economic_conditions/tourism-dashboard/
Hotel Inventory by category and performance KPIs (YTD)
UAE Tourism Portal https://www.visitdubai.com/en/tourism-performance-report Room Occupancy England Tourism Portal https://www.visitbritain.org/latest-england-research-reports Japan Tourism Portal http://www.mlit.go.jp/common/00099172 5.pdf
Total sales per room
Japan Tourism Portal
http://www.mlit.go.jp/common/00099172 5.pdf
Average room rate
Japan Tourism Portal
http://www.mlit.go.jp/common/00099172 5.pdf
A diagram based on the proposed conceptual model was designed, where the indicators above were grouped in clearer and in most relevant sub-categories, as shown below.
26 The chosen indicators are useful since they endorse future dynamic exploration and analysis on upcoming developed dashboards, allowing the local government and the citizens to improve their knowledge on valuable metrics at the city.
Expenditures Industry Growth Nationality Travel Arrivals Visitors & Nationalities
Transport Activities/ Satisfaction Transports City activities Visited Places Visit Duration Satisfaction City of arrival Accommodation Type Ocupancy Rate Performance
27
3.1.3. Proposed Mock-ups
The initial mock-up concept was thought with no data and as a visual support for future reports to design according to each dimension, so the location of each visual could be pre-determined before starting to develop the empirical tool. It facilitated on defining the relevant information to present and how categories could be represented.
Figure 6: Travel category mock-up proposal. Figure 5: Expenditures category mock-up proposal.
28 Figure 8: Activities/Satisfaction category mock-up proposal.
29
3.2. D
ATAC
OLLECTION ANDP
REPARATIONData collection was performed in two stages. Initially, several articles on tourism management and Smart Tourism Destinations were examined, but few had useful information on managing tourism demand or on any tool that had been developed to do so, as the topic is early and very few practical cases have been presented so far in scientific publications. As so, a second approach was taken where six countries have been considered regarding tourism dashboards:
Table 8: Countries analysed for tourism dashboards.
Portal Origin Homepage
https://mbienz.shiny apps.io/tourism_das hboard_prod/
New Zealand
30
Portal Origin Homepage
http://www.mlit.go.j p/ Japan https://www.visitdub ai.com/ United Arab Emirates https://www.trade.g ov/travelindicators/ United States of America
31
Portal Origin Homepage
http://dbedt.hawaii.g
ov/ Hawaii
http://www.tourism.
australia.com/ Australia
These countries’ dashboards on tourism were chosen as they presented solid produced work on this subject. All the displayed indicators were registered in a frequency table (see Appendix A), and its analysis contributed to realize that the studied indicators were spread across several dashboards or reports, and were not present at a single site or document, which also occurs on the Open Data used for the present thesis – Lisbon Open Data. Following this, the table below summarizes the sources, datasets and the obtained datasets after some data profiling and cleansing, which were used to develop a dashboard on Lisbon’s tourism areas.
32 Table 9: Source files and obtained datasets.
Sources Datasets Obtained Datasets
(Excel)
Accessed on November 2017: http://tomslee.net/airbnb-data-collection-get-the-data
Airbnb_lisbon_2017-07-27 CSV file Airbnb (July 2017)
Accessed on January 2018:
https://www.ine.pt/xportal/xmain?xp id=INE&xpgid=ine_publicacoes&PUBL ICACOEStipo=ea&PUBLICACOEScolecc ao=107668&selTab=tab0&xlang=pt
"INE 2016 - Estatiscas Turismo: Quadro 6.2.24 - Estada média, segundo o tipo dos estabelecimentos, por regiões (NUTS II)" Excel file
"ET_2017: Quadro 2.24 - Estada média, segundo o tipo dos estabelecimentos, por regiões NUTS II" Excel file
Nights per accommodation type (2016 and 2017) Accessed on January 2018: http://travelbi.turismodeportugal.pt/ pt-pt/bi/Paginas/default.aspx?datasetId =ACAF829121D04B2AB24F196BBF3B 3940 http://dados.cm- lisboa.pt/dataset/taxas-ocupacao-estabelecimentos-hoteleiros on January 2018. "Hospedes 2016 AM Lisboa_Tipologias" and "Hospedes 2017 AM
Lisboa_Tipologias" from TravelBI (Guests per accommodation type)
"Taxas de ocupação 2016 Tipologias - LISBOA" and "Taxas de ocupação 2017 Tipologias - LISBOA" from CML open data portal (Occupancy rates)
Guests per accommodation (2016 and 2017) Accessed on January 2018: https://www.ine.pt/xportal/xmain?xp id=INE&xpgid=ine_publicacoes&PUBL ICACOEStipo=ea&PUBLICACOEScolecc ao=107668&selTab=tab0&xlang=pt
"INE 2016 - Estatiscas Turismo: Quadro 6.2.25 - Estada média na hotelaria, segundo as regiões (NUTS II), por países de
residência"
"ET_2017: Quadro 2.25 - Estada média na hotelaria, segundo as regiões (NUTS II), por países de residência"
Nights per country of origin (2016 and 2017) Accessed on April 2018: http://travelbi.turismodeportugal.pt/ pt-pt/bi/Paginas/default.aspx?datasetId =780E95AA10F8470592C8C1DA15D8 1FCB TravelBI_hóspedes e dormidas (2016-2017)
Guests per country of origin (2016 and
2017)
Shared by Turismo de Lisboa on 20th February 2018
"LISBOA CIDADE - estabelecimentos hoteleiros (moradas)" Excel dataset
Lisbon Hotels addresses (2017) PowerBI file obtained on 15th of
December of 2017 through advisor share.
33 Afterwards, the Lisbon tourism data was collected and the datasets to create the tourism tool were obtained according to this table. As it can be observed, some datasets were created by modifying or aggregating some original datasets, which were obtained at TravelBI, INE, CML open data portal and at a non-organizational site. The main treatment per dataset are described next.
▪ Airbnb (July 2017)
This dataset belongs to a non-organizational website, as there was no Airbnb public data available at the moment of the data collection at any Lisbon organizational site. It was obtained through a zipped file and extracted to the most recent CSV document, containing all the Airbnb addresses in Lisbon up to 27th July 2017. This file needed no treatment, as it was ready to use.
▪ Nights per accommodation type (2016 and 2017)
The original two datasets were accessed at INE website and contained the 2016 and 2017 tourism statistics in Portugal, referring to the average stay according to the type of accommodation by NUTS II regions, which contain among others the Lisbon metropolitan area (Lisbon city and peripheric areas). Initially, the "Other accommodation types" category was not represented at this dataset for both 2016 and 2017, as only the “Guests per accommodation” dataset contained this category. As so, as the “Local Lodging” shows significance in the dataset and the "Other accommodation types" category doesn’t specify what types of accommodation are included for the “Guests per accommodation” dataset and by mapping the other category between both datasets, the “Local Lodging“ was considered as the "Other accommodation types" category at the “Nights per Accommodation Type” dataset to ease value comparison and allow for a relevant analysis at the tourism management tool designed at PowerBI.
▪ Guests per accommodation (2016 and 2017)
The original two datasets consisted of the “Guests per accommodation type”, obtained at the TravelBI portal, and the “Occupancy rates” found at the CML open data portal, for both years of 2016 and 2017. At the first dataset the 2017 data was updated according to the most recent published dataset, as several values existed for the same year throughout the year of 2018 while these were being accessed on the portal. For the “Occupancy rates” dataset, a new category emerged for one and two stars hotel for both years, as the one star hotel category was no longer represented after September 2017. The approach taken was to average both categories’ values and consider this a single category. Also, the tourist apartment category was no longer represented after September 2017. No approach was taken here and there are simply no records for these months.
▪ Nights per country of origin (2016 and 2017)
The original two datasets were accessed at INE website and contained the 2016 and 2017 tourism statistics in Portugal, referring to the average stay according to the guests´ country of origin by NUTS II regions, which contain among others the Lisbon metropolitan area (Lisbon city and peripheric areas).
34 All the countries are individually specified for these datasets, but in the "Guests per Country" datasets there's a category for "Other countries" and the countries that are included in this category are not specified. As so, to ease the future comparison between both datasets, the category "Other countries" doesn't include Finland, Netherlands and Norway data, as these values aren't available in the "Guests per Country" dataset for both years.
▪ Guests per country of origin (2016 and 2017)
The original two datasets were obtained at TravelBI portal, and contained the 2016 and 2017 data of Lisbon visitors per country. As in the “Guests per accommodation” dataset, the data for 2017 had to be updated according to the most recent published dataset, as several values existed for the same year throughout the year of 2018 while these were being accessed on the portal.
Contrary to the “Nights per country” dataset, this dataset did not specify all the countries, as it happens in the category “Other countries”. As so, the category “Scandinavia” and the lowest values of guests’ countries – Belgium and the Netherlands – were added to the “Other countries” category. This was chosen as those countries were not all represented at the “Nights per country” dataset and seemed the most logical decision to take. It is important to also mention that this dataset is no longer available at the original portal due to an aggregation per year data modification, opposing the month detail that existed initially.
▪ Lisbon Hotels addresses (2017)
The original dataset was shared by Turismo de Lisboa on 20th February 2018, after a request made on a meeting with this entity and the advisor Miguel Neto on 16th February 2018. This dataset contains data from all the hotels that existed on 2017 at the city of Lisbon.
Initially, only the hotels’ name, type and the address were available at the dataset. This data was required to create an interactive parish map at the designed tool, and a manual insertion was performed as no parishes were specified, so this data would be relevant when developing the visual tool of the thesis.
▪ Parishes (Up to date)
The original was constituted by a PowerBI file obtained through advisor sharing, containing all the parishes present at Lisbon in 2018, and was ready to use.
35
3.3. I
NDICATORSC
ONSTRUCTION,
T
REATMENT ANDR
ELATIONSConsidering the indicators presented at section 3.1.2. Conceptual Model Proposal, each dataset was constituted by some specific measures, which will be explained in detail next.
▪ Airbnb (July 2017)
This dataset original attributes were the room type, parish, latitude and longitude. The created measures at PowerBI, using DAX scripting language, were:
- The number of Airbnb accommodations per parish, as AIRBNB, calculated as: AIRBNB = COUNT('Airbnb_Jul_2017'[Parish])
- The percentage of Airbnb accommodations per parish, as %AIRBNB, calculated as % AIRBNB = [AIRBNB]/ Parishes[ACCOMMODATIONS] * 100
▪ Nights per accommodation type (2016 and 2017)
This dataset original attributes were the accommodation (type), year and average nights. No further measures were created.
Figure 11: Nights per accommodation (2016 and 2017) dataset (view from PowerBI relationships tab). Figure 10: Airbnb (July 2017) dataset attributes and created measures (view from PowerBI relationships tab).