Instituto Politécnico de Lisboa
Instituto Superior de Engenharia de Lisboa
Escola Superior de Tecnologia de Saúde de Lisboa
Development of a Liquid Cell to Study the Release of
Brimonidine in Real Time
Tiago Alves Pereira
Thesis to obtain the Master of Science Degree in Biomedical
Engineering
Supervisors:
Dr. Quirina Ferreira (Instituto de Telecomunicações)
Prof. Dr. Manuel Matos (Instituto Superior de Engenharia de Lisboa)
ii
Instituto Politécnico de Lisboa
Instituto Superior de Engenharia de Lisboa
Escola Superior de Tecnologia de Saúde de Lisboa
Development of a Liquid Cell to Study the Release of
Brimonidine in Real Time
Tiago Alves Pereira
Thesis to obtain the Master of Science Degree in Biomedical
Engineering
Supervisors:
Dr. Quirina Ferreira (Instituto de Telecomunicações)
Prof. Dr. Manuel Matos (Instituto Superior de Engenharia de Lisboa)
Examination Committee:
Chairperson: Prof. Dr. Cecília Calado (Instituto Superior de Engenharia de Lisboa)
Supervisor: Dr. Quirina Ferreira (Instituto de Telecomunicações)
Member of the Committee: Prof. Dr. Maria de Fátima Raposo (Faculdade de
Ciências e Tecnologia)
iii
“Mais vale uma hora de coragem que um dia de preguiça”
iv
Acknowledgments
Gostaria de usar esta página para agradecer a todos os que me ajudaram neste percurso, de forma direta ou indireta, mas sem elas não teria chegado ao fim de certeza!
Um agradecimento especial aos meus orientadores nesta tese, Doutora Quirina Ferreira e Professor Doutor Manuel Matos, pela ajuda fundamental para a realização deste trabalho, não só pela excelente orientação durante todo o percurso de criação do projeto, mas também pela adaptação incansável aos meus horários de trabalho, que nem sempre eram os mais fáceis. Desde já, um enorme obrigado!
Quero agradecer ao grupo de Química do Instituto Superior de Engenharia de Lisboa por me cederem o espaço para a montagem da impressora 3D, e ao Instituto Superior Técnico, por me deixar realizar grande parte das experiências laboratoriais nas suas instalações, fornecendo-me todos os equipamentos que necessitava para a realização deste projeto.
Quero agradecer ao Doutor Fabrice Cousin, do Laboratório Léon Brillouin em França, por ter entrado em contacto e se ter disponibilizado a realizar a análise dos filmes de multicamadas através da técnica de Refletividade Especular de Neutrões.
Um obrigado a todos os meu colegas de laboratório, por me explicarem como eram e funcionavam, sempre disponíveis para me ajudarem quando tive mais dificuldades. Quero agradecer também às minhas colegas de trabalho, por me terem facilitado nos horários e me substituírem sempre que precisava de ir ao laboratório. A todas vocês, um grande obrigado.
Agradeço a todos os meus colegas de Mestrado, especialmente aos meus “manolas” e membros do IEEE, que apesar do pouco tempo que passamos junto nesta reta final que é a tese, não deixaram de ser uma parte fundamental de toda a viagem.
Aos meus amigos de longa data, que no fundo não me ajudaram muito, no que diz respeito à elaboração da tese, mas que estavam sempre prontos para um fundamental “cafezinho e bowling” ao fim-de-semana, e só por isso, merecem um agradecimento.
À Marisa, um especial agradecimento, pelo apoio incondicional, por toda a ajuda impagável que me deste, por acreditares em mim, por estares sempre presente na minha vida, antes longe e agora perto. Pela contínua demonstração de amor, o meu maior obrigado!
Por fim, agradeço à minha família, o meu maior suporte antes, agora e sempre. Sem vocês, nunca teria conseguido. Obrigado, Mãe, Pai e Karicas, espero que se orgulhem de mim como eu de vocês.
v
Development of a Liquid Cell to Study the Release of
Brimonidine in Real Time
Tiago Alves Pereira
2019
The present work was primarily conducted in the Organic Electronics laboratory of the
Instituto de Telecomunicações through a collaboration protocol established between
Instituto Superior Técnico and Instituto Politécnico de Lisboa.
vi
Abstract
The experimental method usually used to monitor a drug release is not always representative of the natural conditions under which this process occurs. In most of the cases, the study of drug release kinetics is a static process that is unaffected by the fluid dynamics that occur in all living organisms.
In this thesis, a dynamic cell was developed to quantify the release of Brimonidine, a drug used in the treatment of glaucoma, from a thin nanostructured film in real time. More specifically, the design and subsequent 3D printing of a dynamic cell under a constant flow of an aqueous solution was made to monitor the release of Brimonidine.
For the present work, multilayer films composed of Brimonidine encapsulated in Polymer β-cyclodextrin alternated with a water-soluble polymer, poly-β-amino ester were prepared by the layer-by-layer technique and their growth was controlled by Ultraviolet-Visible Spectroscopy, Atomic Force Microscopy and Neutron Reflectivity
Brimonidine release kinetics were monitored in the dynamic cell immersing the films in a volume of about 25 cm3 under the influence of two flow rates: Q= 4.14 mL/min and Q=2 mL/min. Samples were collected at specific times and analyzed by Ultraviolet-Visible spectroscopy. Results demonstrated a stratified release of Brimonidine at both flow rates, where each step corresponded to the release of a bilayer. The kinetics have been found to be slower for the lower flow rate. This work demonstrated the relevance of using a dynamic drug release control system that can be used in other drug delivery systems.
Keywords:
Drug delivery system, Dynamic cell, 3D printing, Brimonidine,
Layer-by-layer technique.
vii
Resumo
O método experimental para a monitorização da libertação de um fármaco nem sempre é representativo das condições naturais em que este processo ocorre. Na maior parte dos casos, o estudo da cinética de libertação de um fármaco ocorre de forma estática, sem sofrer influencia das dinâmicas de fluidos que se encontram presentes em qualquer organismo vivo. Nesta tese desenvolveu-se uma célula que permite quantificar a libertação de Brimonidina, fármaco usado no tratamento do glaucoma, a partir de filmes finos e nanoestruturados em tempo real. Mais especificamente, foi feito o projeto e posterior impressão 3D de uma célula dinâmica que serviu como suporte para os filmes criados com a Brimonidina serem sujeitos uma solução aquosa com um fluxo dinâmico e caudal ajustável.
Para o presente trabalho, filmes de multicamadas compostos por Brimonidina encapsulada em polímero de β-ciclodextrina e alternadas com um polímero hidrossolúvel, poli-β-amino-éster (PBAE) foram preparados pela técnica de camada sobre camada e o seu crescimento foi controlado por Espectroscopia de Ultravioleta-Visível, Microscopia de Força Atómica e Reflectividade de Neutrões
A cinética de libertação da Brimonidina foi monitorizada na célula impressa com um volume de cerca de 25 cm3 sob a influência de dois caudais: 4.14 mL / min e 2 mL / min. As amostras foram recolhidas em tempos específicos e analisadas por Espectroscopia de Ultravioleta-Visível. Os resultados demonstraram uma liberação estratificada de Brimonidina em ambos os caudais, onde cada etapa correspondia à libertação de uma bicamada. Verificou-se que a cinética é mais lenta para o caudal mais baixo. Com este trabalho demonstrou-se a importância de usar um sistema dinâmico para o controlo da libertação de fármacos onde é possível observar uma libertação passo por passo e pode ainda ser usado para outros sistemas semelhantes.
Palavras-chave:
Sistema de entrega de fármaco, Célula dinâmica, Impressão 3D,
Brimonidina, técnica de camada-sobre-camada.
viii
Contents
Acknowledgments ... iv
Abstract ... vi
Resumo ... vii
Contents ... viii
List of Figures ... x
List of Tables ... xv
Nomenclature ... xvi
1
Introduction ... 2
1.1
Ocular devices for glaucoma treatment ... 2
1.2
Nanostructured Drug delivery films ... 5
1.3
Drug delivery kinetic in a static system ... 6
1.4
Motivation ... 7
1.5
Objectives ... 7
1.6
Thesis Outline ... 8
2
Materials and Methods ... 11
2.1
Materials ... 11
2.1.1 β-cyclodextrin Polymer ... 11
2.1.2 Poly (β-amino ester) ... 12
2.1.3 Brimonidine ... 13
2.1.4 Sodium acetate trihydrate ... 14
2.2
Characterization techniques and methods ... 14
2.2.1 Ultraviolet-Visible spectroscopy ... 15
2.2.2 Ultraviolet-Visible spectroscopy in-situ test measurements ... 16
2.2.3 Atomic Force Microscopy ... 18
2.2.4 Neutron reflectivity ... 21
2.2.5 Drug delivery layer-by-layer films preparation ... 23
2.2.6 3D printing ... 24
2.2.7 Dynamic cell designs ... 25
ix
3
Drug Delivery: films growth ... 38
3.1
UV-Vis spectroscopy analysis ... 38
3.2
Atomic Force Microscopy analysis ... 40
3.3
Neutron Reflectivity analysis ... 43
4
Brimonidine Kinetic Release ... 46
4.1
Brimonidine release – Q = 4 mL/min ... 46
4.2
Brimonidine release – Q = 2 mL/min ... 49
4.3
Analysis of flow rate effect... 51
5
Conclusions ... 56
6
Future Work ... 58
Bibliography ... 59
x
List of Figures
Figure 1 –Schematic representation of a normal IOP eye and a high IOP eye
(https://www.sugikiportis.com/glaucoma-honolulu/glaucoma-diagram-1000
/
2019/07/19). ... 2
Figure 2 – Comparative representation of a normal visual field (left image) and a
glaucoma-affected visual field (right image), (
https://drjai.com.au/glaucoma-treatment-bundaberg/ 2019/07/20). ... 3
Figure 3 - Schematic representation of a contact lens and glaucoma valve for drug
delivery in the eye. ... 4
Figure 4 - Schematic representation of the LbL method. ... 6
Figure 5 - Schematic representation of thesis outline. ... 9
Figure 6 – Chemical structure (a) and three-dimensional structure (b) of cyclodextrin,
figure adapted from (46). ... 11
Figure 7 - Poly β-cyclodextrin molecular structure, figure adapted from ((43)). ... 12
Figure 8 – Final PBAE form, after precipitation in diethel ether and vacuum drying in a
Buchner funnel, figure adapted from (44). ... 13
Figure 9 – Chemical structure of Brimonidine. ... 13
Figure 10- Schematic illustration of a 1:1 complex formed by one molecule of CD and
one of Brimonidine (Brim). ... 14
Figure 11 –UV-Vis Cecil Aquarius CE 7200 spectrophotometer. ... 16
Figure 12 - Absorption spectrum of K
2CrO
7at different concertation values. ... 16
Figure 13 – Concentration graph of K
2Cr
2O
7in relation to the absorbance value. ... 17
Figure 14 - Schematic illustration of an AFM equipment, figure adapted from (57). 18
Figure 15 – Different force levels between the tip and the sample’s surface with respect
xi
Figure 16 - different types of contact with different means of force interaction, figure
adapted from (60) ... 20
Figure 17 – the Nano-Observer AFM used to analyse the layer of the DD films. ... 20
Figure 18 - Simplified scheme of a neutron reflectivity instrument and results, here:
K
in=incoming beam; K
out= outgoing beam; Q
z= surface normal; 𝜃
in= incident angle and
𝜃
out=reflected angle. Figure adapted from (63) ... 21
Figure 19 – Schematic representation of the LbL technique used. ... 23
Figure 20 –Schematic representation of a LbL assembly with (PBAE/Poly-CD+Brim)
bilayer, figure adapted from (66). ... 24
Figure 21- simplified representation of the operation of the FDM technique, figure
adapted from (70). ... 24
Figure 22 - Schematic image of HelloBeePrusa's construction; a) - complete assembly
of extruder module; b) - complete assembly of support structure; c) – connection of
support structure with extruder head; d) - assembly of electronic component; e) -
assembly completed and operational. ... 25
Figure 23 –Scheme illustrating the assembly used to test the variation of concentration
of K
2Cr
2O
7, in relation to time. ... 26
Figure 24 – Zoom in graph between the 290 nm and 340 nm, showing the variation of
the absorbance of K
2Cr
2O
7values within the cell, in relation to time (measured every
to 2 minute). ... 27
Figure 25 – Absorbance of K
2Cr
2O
7at 313 nm, in relation to time. ... 27
Figure 26 - Absorbance spectrum of motor A, motor B and C. ... 28
Figure 27 - Absorbance spectrum of motor A, motor B and C (zoom in graph between
240 and 280 nm of Figure 26). ... 29
Figure 28 – Schematic representation of the outer part of the 1ª prototype cell (left
figure) and the inner part (right figure). ... 31
Figure 29 –Schematic representation of the outer part of the 2º prototype cell (left
figure) and the inner part (right figure), with accessory camera and DD film slot
included. ... 31
xii
Figure 30 - Schematic representation of the UV-Vis spectrophotometer docking
bracket (left figure) and outer part of the 3º prototype cell (right figure) with embedded
quartz window and docking bracket already added. ... 32
Figure 31 – Schematic representation of the 3º prototype cell embedded quartz
windows. ... 32
Figure 32 - Schematic representation of the 3º prototype cell seen from above (left
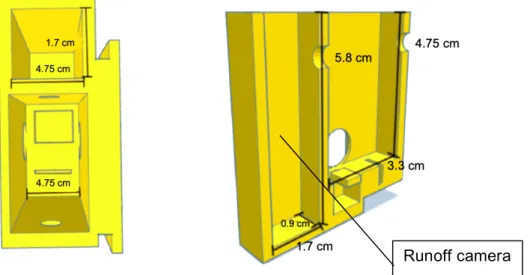
side) and the inner part (right side) with the runoff camera added to the cell. ... 33
Figure 33 – sample spectra graph with interference caused by unknown factors inside
the dynamic 3D cell placed on to the UV-Vis Spectroscopy ... 33
Figure 34 – Schematic representation of the final cell used for kinetics, dynamics from
outside (left side) and inside (right side) with accessory camera and slot added. .... 34
Figure 35 – Schematic representation of the setup used to perform the kinetics. .... 35
Figure 36 - Absorption spectra of six (PBAE/Poly-CD+Brim) bilayer of the 1
stLbL Film,
obtained after each bilayer deposition. ... 39
Figure 37 – Absorbance variation of the six (PBAE/Poly-CD+Brim) bilayer of the 1
stLbL Film, obtained after each bilayer deposition. ... 39
Figure 38 - Schematic representation of the (PBAE/Poly-CD+Brim) bilayers created in
mica substrates using the layer-by-layer technique. ... 40
Figure 39 - Rrms Value as a function of the number of bilayers added to the substrate.
The line is just to guide the evolution of Rrms values. ... 43
Figure 40 - NR curves of three different films with 1, 2 and 3 bilayers. ... 44
Figure 41 - 900 seconds sample spectra at Q = 4 mL/min with three Gaussian curves
fitted and the corresponding peaks values table (upper right corner). ... 46
Figure 42 - Normalized values of Brimonidine release kinetics at Q = 4 mL/min for
7200 seconds. ... 47
Figure 43 - Schematic representation of (PBAE/Poly-CD+Brim) bilayer release
kinetics over time under a Q = 4 mL/min after emersion on to the PBS solution. ... 48
Figure 44 - Normalized values of Brimonidine release kinetics at Q = 2 mL/min for
xiii
Figure 45 - Schematic representation of (PBAE/Poly-CD+Brim) bilayer release
kinetics over time under Q = 2 mL/min after emersion on to the PBS solution. ... 50
Figure 46 - Normalized amount of Brimonidine release at flow rates of Q = 4 mL/min
and Q = 2 mL/min. ... 51
Figure 47 - Percentage of released Brimonidine in relation to time for each step in Q
= 4 mL/min and Q = 2 mL/min. ... 53
Figure 48 - Schematic representation of the inner part of the 1ª prototype cell in a
different angle. ... 66
Figure 49 - Schematic representation of the inner part of the 2ª prototype cell in a
different angle. ... 66
Figure 50 - Schematic representation of docking bracket prototype in different angles.
... 67
Figure 51 - Schematic representation of the inner and outer parts of the 3ª prototype
cell in different angles. ... 67
Figure 52 - Schematic representation of the inner part of the final prototype cell in a
different angle. ... 68
Figure 53 - Absorption spectra of six (PBAE/Poly-CD+Brim) bilayer of the 4
stLbL Film,
obtained after each bilayer deposition. ... 68
Figure 54 - Absorption spectra of six (PBAE/Poly-CD+Brim) bilayer of the 3
stLbL Film,
obtained after each bilayer deposition. ... 69
Figure 55 - Absorption spectra of six (PBAE/Poly-CD+Brim) bilayer of the 2
stLbL Film,
obtained after each bilayer deposition. ... 69
Figure 56 – Topography AFM image with a scan area 10x10 μm
2(PBAE/Poly-CD+Brim)
1.... 70
Figure 57 - Topography AFM image with a scan area 10x10 μm
2(PBAE/Poly-CD+Brim)
2. ... 70
Figure 58 – Topography AFM image with a scan area 10x10 μm
2(PBAE/Poly-CD+Brim)
3.... 71
xiv
Figure 59 – Topography AFM image with a scan area 10x10 μm
2(PBAE/Poly-CD+Brim)
4.... 71
Figure 60 – Topography AFM image with a scan area 10x10 μm
2(PBAE/Poly-CD+Brim)
5.... 72
Figure 61 - Topography AFM image with a scan area 10x10 μm
2(PBAE/Poly-CD+Brim)
6.... 72
Figure 62 - Normalized values of Brimonidine release kinetics at Q = 4 mL/min for
7200 seconds. ... 73
Figure 63 - Normalized values of Brimonidine release kinetics at Q = 4 mL/min for
xv
List of Tables
Table 1 - Concentration table of K
2Cr
2O
7in relation to the absorbance value ... 17
Table 2 – AFM images of LbL films composed of: a) (PBAE/Poly-CD+Brim)
1; b)
(PBAE/Poly-CD+Brim)
2; c) (PBAE/Poly-CD+Brim)
3; d) (PBAE/Poly-CD+Brim)
4; e)
(PBAE/Poly-CD+Brim)
5and f) (PBAE/Poly-CD+Brim)
6. ... 40
Table 3 - Thickness values of three (PBAE/Poly-CD+Brim) given by Neutron
Reflectivity analysis. ... 44
Table 4 - Representation of step-by-step of Brimonidine release kinetics with the
xvi
Nomenclature
A
Absorbance
AH
Aqueous humor
AFM
Atomic Force Microscopy
Brim
Brimonide
CAD
Computer-based design
CL
Contact lenses
CD
Cyclodextrins
DD
Drug delivery
DDS
Drug delivery systems
Q
Flow rate
FDM
Fused deposition modelling
GDD
Glaucoma drainage devices
GON
Glaucomatus optic neuropathy
IOP
High intraocular pressure
ISEL
Instituto Superior de Engenharia de Lisboa
LbL
Layer-by-layer
Mw
Molecular weight
NBSIMR
National Bureau of Standards Institute for Materials Research
NR
Neutron reflectivity
PBS
Phosphate Buffer Saline
PZT
Piezoelectric
PBAE
Poly(β-amino ester)
PLA
Polylactic acid
PSPD
Position sensitive quadrant photodiode
RPR
Renewal percentage rate
Re
Reynolds coefficient
Rms
Root-mean-square
STL
Standard Triangle Language
THF
Tetrahydrofuran
1
2
1 Introduction
This chapter gives a short state of art of glaucoma treatments and its improvement using nanostructured drug delivery films. A brief introduction about drug delivery films is given followed by a description of the methodologies to follow the amount of drug released to an aqueous environment based on static and dynamic setup.
1.1 Ocular devices for glaucoma treatment
According to the World Health Organization, glaucoma is a progressive optic neuropathy found to be the leading cause of irreversible blindness worldwide (1). Glaucoma is defined by a depletion of retinal ganglion region and atrophy of the optic nerve, usually associated with high intraocular pressure (IOP) in open-angle glaucoma (2, 3). This is the result of a blockage, which leads to insufficient drainage of the aqueous humor (AH), increasing internal pressure, damaging the surrounding nerves, vessels and cells as can be seen in Figure 1.
Figure 1 –Schematic representation of a normal IOP eye and a high IOP eye
(https://www.sugikiportis.com/glaucoma-honolulu/glaucoma-diagram-1000 / 2019/07/19).
The main characteristic of Glaucomatus optic neuropathy (GON) is the evolution of the retinal depletion and optic nerve atrophy, which leads to a progressive peripheral vision loss, decrease in contrast sensitivity and diminished central visual acuity (VA) (Figure 2) (4). The problem affects more than 70 million people worldwide, with approximately 10% being bilaterally blind. It is estimated that near 11 million people will suffer from total blindness by the year 2020 (5).
3
Figure 2 – Comparative representation of a normal visual field (left image) and a glaucoma-affected visual field
(right image), ( https://drjai.com.au/glaucoma-treatment-bundaberg/ 2019/07/20).
The development of glaucoma is strongly influenced by genetics and age. The risk of developing glaucoma increases exponentially after the age of 40 in strong association with high IOP (5).
Most of the therapies applied nowadays are focused on decreasing IOP, in order to decrease the disease progression (6). Topical IOP treatment remains the best method applied to all types of glaucoma (7). The majority of ocular treatments (i.e. about 90%) are in eye drops form (8). One of the most effective anti-glaucoma drugs is Brimonidine. This drug is rapidly absorbed and its capacity to effectively decrease IOP has been proven in clinical trials, increasing the aqueous humor flow from 40% to 67% in 4 hours (9). Brimonidine is equally or even more effective than others marketed anti-glaucoma drugs, managing to increase AH drainage, while decrease its production (8, 9). The most common and simpler posology for Brimonidine is via topical eye drops, three times per day (10).
However, highly concentrated solutions are required to reach the therapeutic level intended, in order to overcome the natural defenses mechanisms, which have influence on drug’s efficiency (11). The natural barrier created by the three lacrimal layers film in association with the reactive blinking reflex created by the falling drop, leads to the elimination of a large percentage of the drug by nasolacrimal drainage and evaporation, losing 80% to reflective tearing and nasolacrimal drainage within 5 minutes after application (12). From the remaining 20%, only 3% to 5% of the drug penetrates the cornea and reach the final target sites (10, 13).
Furthermore, studies showed that the low commitment and poor maintenance of self-administration schedule represents a major factor for the inefficiency of topical eye drops and poor IOP control (10). Over 50% of the patients were non-compliant and 35% demonstrated improper administration technique, in most cases, due to arthritis, osteoarthritis and other aging related diseases (14).
4
To overcome these issues, new drug delivery systems (DDS) with easy application, effective target delivery and dose accuracy are needed (15). Nanotechnology-base ocular devices and glaucoma drainage techniques are being developed in order to remove the compliance factor out of the equation as well decreasing Brimonidine concentration required (Figure 3) (15).
Figure 3 - Schematic representation of a contact lens and glaucoma valve for drug delivery in the eye. The use of soft contact lenses (CL) impregnated with an antiglaucoma drug was an important step in the development of this DDS (15). In earlier stages, the lens was soaked with the anti-glaucoma drug and placed in the eye, resulting in a better drug release profile and better patient compliance by the improvement of the VA. However, the simple soaking of the lens into the anti-glaucoma drug results in a maximum release-time of 2 hours, needed to be re-soaked constantly (16, 17).
The use of nanoparticles for the encapsulation of the anti-glaucoma drug into the CL matrix, allowed a significant improvement in the loading drug capacity, lowering the levels wasted drug and a more sustainable release over time (16, 18). Recently, Sun et al. (2017) using a Brimonidine loaded CL nanoparticles with 125.0 μg/g of Brimonidine, showed a continuous drug release up to 144h, with good corneal biocompatibility (19). Similar to the CL, nanopatchs and fornix inserts have been developed as a new form of corneal DDS, with the advantage of lowering the risk of foreign body sensation and inflammation potentially caused by the CL (15). With a drug capacity greater than CL, Franca et al. (2014), was able to create a conjunctival fornix insert, with a sustained in vitro drug release of 8h and a significant IOP reduction for 4 weeks, after one single application (15, 20).
This thesis aims to develop multilayer DD films composed of layers of Brimonidine encapsulated in polymer-β-cyclodextrin (Poly-CD+Brim) alternated with a barrier layer which controls the release of a drug and composed of poly-β-amino ester (PBAE). These films were previously developed in the research group of Organic Electronics of IT (21-23) and it was observed that the PBAE delay the drug release ensuring a precise drug amount delivery.
5
However, it was observed that the methodology based on a static setup used to follow the Brimonidine release to the aqueous environment did not allow its correct monitorization. In this thesis, a dynamic system was developed and tested in order to mimic the biologic conditions of the ocular dynamic fluids. Both methods, static and dynamic, are explained throughout this work.
1.2 Nanostructured Drug delivery films
By definition, a DDS can be a formulation or a device with the purpose of introducing a therapeutic substance into the body. It is designed to improve the pharmacological and therapeutic properties of the drug administered parenterally (24), by controlling the drug release time, rate and place, minimizing side effects and frequency of administration (25). Drugs can be introduced into the human body by various anatomical routes, depending on the effect intended. The route of administration choice depends on the disease, the effect desired and the product available (26).
DDS is a very effective and efficient performance on-spot delivery, reducing the required doses to trigger a reaction, improving upon side effects created by conventional administration, resulting in less drug waste and higher levels of patient compliance (27).
Layer-by-layer is a simple and versatile method for the construction of DDS, allowing the fabrication of complex and functional multilayer films. The LbL technique is a cyclical process based in the adsorption of a charged material onto a substrate, followed by a washing step and then a new adsorption of an oppositely charged material on the top of the first layer. This process can be repeated until the multilayer film reaches the desired thickness. Films can be formed through electrostatic interactions, covalent interactions, hydrogen bonding, host-guest, and others. (28, 29). By changing the concentration of components, pH, immersion time and ionic strength, it is possible to adjuncts and fine-tune the films in order to be used in a wide range of biomedical applications (30, 31).
There are several methods of LbL assembly, for example, dipping (32), spinning (33), spraying (34), electrodeposition (35), between others, which have different input materials and different assembly technologies. Assembly technologies can be divided into five groups: immersive, spin, spray, electromagnetic and fluidic. The assembly method has a direct influence on the physicochemical properties of the films, for example, on film’s thickness, homogeneity and structure. Therefore, method’s choice must be made not only considering process properties, as time, scalability and automation, but also the desired properties of the film.
6
Immersive or dip LbL assembly, which was the method used in this work (Figure 4), is the most widely used method and it is based on the immersion of a substrate into a solution composed by the desired material and also washing steps to remove the unbound material (32, 36). Immersive assembly is widely used for the formation of thin films, once it creates more homogeneous surfaces, when compared with non-LbL assembly (37). This technology is simple and easily accessible, using simple substrates with several shapes or sizes.
Figure 4 - Schematic representation of the LbL method.
The method used in this work was previously studied and optimized in the previous thesis (21). The layers configuration and adsorption times for each layer are already defined. The procedure is based in dipping a clean quartz substrate into a solution of charged polymers. After each submersion in the polymer solution (compound 1 and compound 2 in Figure 4), a washing step is necessary to remove supernatant material (cleaning solvent in Figure 4), ensuring a homogeneous layer (38). The procedure must be repeated as many times as necessary until the desired number of layers is achieved. The formation of one bilayer is composed by the four steps as schematized in Figure 4.
1.3 Drug delivery kinetic in a static system
In the previous thesis (21, 22), the drug delivery kinetic was study in a static form. The LbL films were immersed in a beaker with a Phosphate Buffer Saline (PBS) solution at 37ºC, with a 7.4 pH and salts concentration levels like those found in human biological fluid. Despite the aqueous solution was under agitation and the fluid was periodically replaced by a new one, this setup does not represent the real dynamic which occurs in human body mainly on the eye. This fluid dynamics influences the drug release and a static setup is not representative of real condition. It was observed (21, 22) using a static setup occurs a
7
significant salts accumulation on the top of a film resulting from the buffer solution which affects the drug release. In order to overcome this problem, it was developed under this thesis a dynamic setup which allows the monitorization of drug release in real time.
1.4 Motivation
In the previous research works (21, 22), a static kinetic system was used to testing the adsorption of the drug delivery (DD) film synthetized by the LbL technique. Consequently, the salts of the phosphate buffer saline used rapidly formed agglomerates on the film surface, interfering with the spectra measurements and making impossible to obtain reliable DD film absorbance results.
In order to solve this problem, a new setup to study the Brimonidine release was developed, preventing the agglomerate of salts on the film surface. A dynamic cell was developed allowing the continuous flow of the aqueous solution where the film is immersed. The developed cell is original and it was designed and fabricated during this thesis. It allowed to mimic the ocular environment that is more realistic considering that the drug that was studied (Brimonidine) is to be delivered in the intraocular region with a continuous flow of aqueous humor. This setup may be further implemented in other laboratory studies which involves drug delivery systems.
1.5 Objectives
The main objective of this research is to create a dynamic cell for the real-time study of Brimonidine release.
In more detailed point-by-point analysis, the objectives are:
• Creating a dynamic cell prototype using the TinkerCAD® software design
program.
• Printing the prototype cell using the HelloBeePrusa® 3D printer previously
assemble.
• Preliminary tests using aqueous solutions of K2CR2O7to e valuate the dynamic
cell and to optimize its design.
(Poly-8
CD) encased Brimonidine monolayer alternating with a PBAE monolayer. • Characterization of the growth of DD films using Ultraviolet-Visible (UV-Vis)
Spectroscopy, Atomic Force Microscopy (AFM) and Neutron Reflectivity (NR). • Characterization of Brimonidine kinetic using the fabricated dynamic cell
evaluating the influence of two different flow rates – Q = 4 mL/min and Q = 2 mL/min.
1.6 Thesis Outline
This thesis is divided in six Chapters. Chapter 1 contains the Introduction, where the state of the art of the work is presented, addressing themes regarding glaucoma and its complications and the recent developments which involves new therapeutics based on nanodevices.
Chapter 2 describes the materials used to print the dynamic cell and preparation of DD films. It also includes the methods of multilayer films preparation, dynamic cell fabrication and the preliminary tests to optimize its design. All the characterization techniques used to monitoring the film growth and the Brimonidine release are also described in this chapter.
Chapter 3 presents the results about the multilayer films growth and its characterization with UV-Vis spectroscopy, AFM and NR.
Chapter 4 includes the results of the Brimonidine release kinetics.
Chapter 5 describes the main conclusions of this work and the Chapter 6 includes the proposal for future work following the results of this project.
The Appendix section is presented at the end with additional graphs and results. Figure 5 resumes the thesis outline.
9
10
Chapter 2 – Materials and
Methods
11
2 Materials and Methods
2.1 Materials
This sub-chapter describes the materials used to prepare the multilayer films, namely the Poly-CD encapsulation protocol used to encapsulate Brimonidine molecules, PBAE synthesis and lastly the Sodium acetate trihydrate solution preparation, used as a solvent as well as the aqueous solution for dynamic release in 3D printed cell. All the materials presented are described in greater detail in (21).
2.1.1 β-cyclodextrin Polymer
Cyclodextrins (CD) are cyclic oligosaccharides, in the form of a macrocyclic ring, with six α-D-glucopyranose units connected by α-(1, 4) glycosidic bonds (Figure 6) (39).
Figure 6 – Chemical structure (a) and three-dimensional structure (b) of cyclodextrin, figure adapted from (46). The spatial conformation combined with the lipophilic inner cavity and hydrophilic outer surfaces, make it ideal for a DD system, forming noncovalent inclusion complex and improving the solubility of the drug. (40-42). Poly-CD is an ideal polymer for the creation of multilayer DD films, once Poly-CD is able to bind to Brimonidine, forming stable complex, with high ocular biocompatible properties and very low toxicity and cytotoxicity.
Polymer β-cyclodextrin was obtained from Sigma Aldrich (Molecular weight (Mw) = 2.000 to 3.000 Da). The molecular structure is show in Figure 7.
To obtain the Poly-CD solution, the power was dissolved in the sodium acetate solution and stirred for 30 minutes, then it was placed in ultrasound bath for 5 to 15 minutes at room temperature, to ensure the dissolution of all powder particles.
12
Figure 7 - Poly β-cyclodextrin molecular structure, figure adapted from ((43)).
2.1.2 Poly (β-amino ester)
Poly (β-amino ester) (PBAE) refers to a cationic polymer, synthesized by Michael addition polymerization of an amine and an acrylate monomer (44). Presenting high biodegradability by hydrolysis and high pH responsiveness. This non-viral vector offers advantages over viral vectors, such as easy production, stability, low immunogenicity and toxicity (45).
PBAE was synthetized in the Organic Electronics group of the Instituto de Telecomunicações. PBAE used was done for the previous work and it’s described in greater detail in (21, 22) as reference earlier.
The synthesis is based on the protocol described by Lyn et al. (44), consisting of adding 4,4’-trimethylenedipiperidine (97% purity, Sigma Aldrich, CAS number 16898-52-5) to 1,4-butanediol diacrylate (99% purity, Alfa Aesar, CAS number 1070-70-8), distilled and mixed in dry tetrahydrofuran (THF), allowing the copolymerization of the monomers. The resulting PBAE polymer was then purified by diethyl ether precipitation and left in vacuum. The final form of purified PBAE is shown in Figure 8. The layers of PBAE used in the multilayer film are deposited alternately with Poly-CD layers, serving as the anchor point of these molecules.
13
Figure 8 – Final PBAE form, after precipitation in diethel ether and vacuum drying in a Buchner funnel, figure
adapted from (44).
2.1.3 Brimonidine
Brimonidine is an alpha2-adrenergic agonist (Figure 9) that inhibits the adenylate cyclase enzyme and suppresses the formation of cAMP-dependent, increasing the uveoscleral outflow and decreasing the aqueous humor production at the same time (46, 47).
Figure 9 – Chemical structure of Brimonidine.
The half-life of Brimonidine is 2.5 hours, being primarily metabolized in the liver and then expelled through the urinary track, along with its metabolites (48).
The Brimonidine powder was obtained from Sigma Aldrich (Mw=292.13 g/mol, CAS number 59803- 98-4). As previously mentioned in Chapter 1, Brimonidine is a drug used to reduce intraocular pressure in patient with glaucoma.
2.1.3.1 Brimonidine encapsulation
Brimonidine encapsulation consist in creating a molecular complex with Poly-CD, improving its physicochemical properties and molecular stability, for posterior formation of multilayer films. The encapsulation starts with the dissolution of Brimonidine, at its maximum solubility value of 0.8 mg/mL, into a solution of Poly-CD. The molar ratio of the complex is 1:1 and it is formed through the binding of one molecule of Brimonidine with one molecule of CD, as it can be seen in Figure 10 (42, 49, 50).
14
Figure 10- Schematic illustration of a 1:1 complex formed by one molecule of CD and one of Brimonidine
(Brim).
The solution was then stirred for 48 hours, until all the precipitated drug at the bottom of the flask has been dissolved and the full encapsulation of Brimonidine within Poly-CD (Poly-CD + Brim) was obtained.
The mixture was then diluted again in Poly-CD in order to obtain a concentration of 2 mM (the same as the films previously created (21, 22)).
2.1.4 Sodium acetate trihydrate
Sodium acetate trihydrate (with a Weight-average molecular weight (Mw) of 136.08
g/mol) was obtained from Alfa Aesar, CAS number 6131-90-4.
The sodium acetate powder was dissolved in milli-Q water and stirred, forming a solution with the concentration of 100 mM. Then the solution was used as a solvent for the polymer solutions that form the multilayer DD films as well as for washing substrates during films preparation. For the washing solution, pH adjustment was performed with glacial acetic acid until optimal value of pH 5. The whole process was carried out at room temperature. The same solution was also used as the phosphate buffer saline (PBS) for all experiments performed, at 7.4 pH and at room temperature.
2.2 Characterization techniques and methods
This sub-chapter describes the techniques used to follow the films growth and the drug released. More specifically, UV-Vis Spectroscopy was used to characterize the film growth and the Brimonidine released to the aqueous solution. AFM technique was used to characterize the surface of each film’s bilayer and the Neutron Reflectivity technique was used to analyze the thickness of each layer. This sub-chapter also describes the preliminary tests that were made to optimize the design cell and all steps which involved its fabrication.
15
2.2.1 Ultraviolet-Visible spectroscopy
UV–Vis spectroscopy is based on the interaction of the light with the matter, mainly on the measurement of the ratio between transmitted light and incident light, in the wavelength range between the ultraviolet and visible light (51). This technique allows the quantitative analysis of compounds, depending on molecules absorption.
Lambert-Beer´s law relates the attenuation of light to the properties of the solution that the light is interacting, allowing the quantitative measurement of the concentration of the absorbing specie, using the equation:
log 𝐼&
𝐼 = 𝐴 = 𝑒. 𝑐.
Where I0 is the initial intensity of the light entering the sample, I is the remaining beam
intensity, A is the absorbance, e is the molar attenuation coefficient or absorptivity of the attenuating species in the material sample, c is the concentration of the light absorbing substance and l is the pathlength of the sample in cm (52, 53).
The spectrophotometer measures I0 and I and the ratio of I / I0 is the transmittance,
usually expressed in percentage (%T ). the absorbance is related with the transmittance by:
𝐴 = − log %𝑇
100%
The main components of a spectrophotometer includes: a radiation source, previously selected by the operator, which limits the spectrum to the region of interest; a prism to separate the different wavelengths of the light; two sample containers, one for the sample and other for the reference, being the reference beam intensity taken as 100% Transmission; a detector, which detects the radiation after the attenuation of light by the sample; a computer module for processing the signal (53).
Using this technique, the absorption spectra of the DD film were obtained to follow the film growth after the formation of each bilayer and to analyze the Brimonidine release. For the film growth monitorization, the spectra were obtained between 190 nm and 900 nm wavelength, with a velocity of 25 nm/s and a PBS solution at 5 pH as a reference.
For the kinetics release test, a wavelength rage from 190 nm to 900 nm as used with a velocity of 5 nm/s and PBS solution at 7.4 pH as reference. All the absorption spectra of the films were obtained using quartz substrate. A Cecil Aquarius CE 7200 spectrophotometer in the Organic Electronics group at Instituto de Telecomunicações was used to characterize all solutions and DD films (Figure 11).
Equation (1)
16
Figure 11 –UV-Vis Cecil Aquarius CE 7200 spectrophotometer.
2.2.2 Ultraviolet-Visible spectroscopy in-situ test measurements
Preliminary tests were performed to verify the spectrophotometer with a standard substance, potassium dichromate (K2Cr2O7), used by the National Institute of Standards and
Technology (NIST) (54). The recommend four main wavelengths used correspond to maximum and minimum absorbance in the spectrum, at 235, 257, 313 and 350 nm, to be used for checking the accuracy of the absorbance scale of narrow bandpass spectrophotometers, mainly because of its well defined regions (Figure 12) (54).
Figure 12 - Absorption spectrum of K2CrO7 at different concertation values.
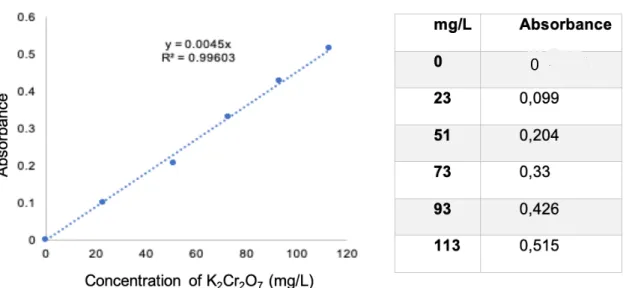
Five solutions were prepared in volumetric flasks containing 23 mg/L, 51 mg/L, 73mg/L, 93mg/L and 114 mg/L of K2Cr2O7, the recommend by the NIST (54). To create a calibration
curve, the wavelength selected was 313 nm, which is the minimum absorbance peak. The
-0.01 0.49 0.99 1.49 1.99 220 320 420 520 A bso rb an ce Wavelenght (nm)
Baseline
23 mg/L
51 mg/L
73 mg/L
93 mg/L
113 mg/L
17
use of the minimum peak is justified by the fact that the maximum wavelength of 235 nm is subjected to interferences provoked by the use of plastic cells instead of quartz cells. In the case of the second maximum peak, at 257 nm wavelength, this was affected by a specific mechanical characteristic of the spectrophotometer, that exchanges the use of a deuterium lamp (used in lower wavelengths) by another deuterium lamp (used in higher wavelengths), which occur between 250-260 nm, creating a false noise peak, making the measurement of the absorbance at this point unreliable.
Using the Microsoft Excel® tool, the absorbance values obtained at the 313 nm wavelength in each different concentration spectrum of K2Cr2O7 were used to create a
calibration, as show in Figure 13 and Table 1.
The resulting calibration curve was adjusted with a linear function, expressed visually by the blue line on Figure 13. The calculation of the K2Cr2O7 unknown concentration in the
samples from the values of the absorbance is given by the function: y = m × x = A = m × log I&
I
Where m is the slope of the line, that describes the slant, in this case, 0.0045. This principle can equally be applied when using Brimonidine instead.
Table 1 - Concentration table of K2Cr2O7 in relation to the absorbance value
Figure 13 – Concentration graph of K2Cr2O7 in relation to the absorbance value.
Equation (3)
18
2.2.3 Atomic Force Microscopy
The Atomic Force Microscope (AFM) is a high-resolution scanning probe microscope able to measure at resolution in the order of a fraction of a nanometer, capable of 3-dimensional imaging, sample manipulation and interaction force measurement (55, 56).
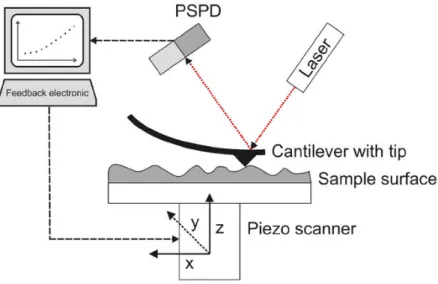
As observed in Figure 14, the AFM system consists on a sharp tip mounted on a micro-machined cantilever probe, connected to a Piezoelectric (PZT) actuator. Also, it includes a position sensitive quadrant photodiode (PSPD), responsible for detect a laser beam reflected of the back end-point of the tip, providing cantilever deflection feedback and position (z value) of the tip in relation to the surface (x and y value) (56).
Figure 14 - Schematic illustration of an AFM equipment, figure adapted from (57).
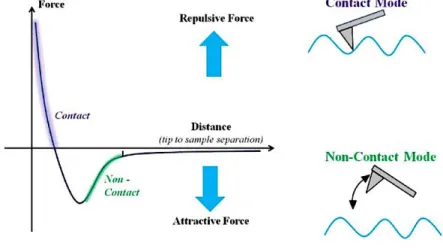
The interaction forces between the tip and sample can be identified on a force– displacement curve, as show in Figure 15. When the distance between the tip and the sample’s surface is large, weak attractive forces are generated. When the tip is brought closer, attractive forces increase until the electron clouds begin to repel electrostatically each other. These repulsive forces between the atoms provoke the weakness of the attractive forces, becoming zero when the distance between the atoms reaches a couple of angstroms and turning fully repulsive when the tip’s atoms are in contact with the sample’s surface (56).
19
Figure 15 – Different force levels between the tip and the sample’s surface with respect to the z-axis distance,
figure adapted from (58).
Taking advantage of the forces of repulsion and attraction, AFM can operate in two main modes: in contact mode in the repulsive region and in non-contact mode in the attractive region (Figure 16).
In the contact mode (Figure 16), the tip is maintained in direct contact with the sample while it scans the surface, making the interaction forces with the tip and the surface repulsive in nature (i.e. van der Waals force dominates any other attractive force that may tend to act at this point) with a repulsive force of 10-8 N to 10-6 N. The topography surface is continuously analyzed by the constant contact of the tip with the surface, being very sensitive to slight variations in the surface. However, the main drawback of the contact mode is that the shear forces resulting from the movement of the tip in the sample tend to damage soft samples and distort the features of the generated image. Therefore, this mode is not suitable for analyze soft biological and polymer surfaces such as the DD films (56).
In the non-contact mode, the tip does not touch the surface, hovering about 50-150 Å above the sample surface, with a van der Waals attractive force of 10-12 N. In order to
compensate the weaker attractive forces, the tip is given a small oscillation (Figure 16), so that these small forces can be detected by measuring the variation in amplitude, frequency, phase of the oscillating cantilever (56). For this mode, it is very important to keep the surface in the higher aseptic state possible, to avoid image distortion. In this work, the non-contact mode was used to analyze de DD films, once, unlike the contact method, it does not alter the morphology or damage polymer surfaces.
20
powerful tool that creates surface images with greater detail, not achievable with normal topographic imaging. This is achieved by comparing the cantilever oscillatory phases (i.e. affected by viscosity, friction, etc.) with the AFM standard frequency, being especially important in samples that present different materials with different types of viscosity (59).
Figure 16 - different types of contact with different means of force interaction, figure adapted from (60) In this work, phase contrast imaging was used to determine changes in composition of each layer of the DD film (56, 59). By color-mapping each individual value of z with the corresponding x and y position, the AFM software was able to create a topographic image, used to analyze and compare changes in the layers after adsorption. These images were then further optimized. All measurements were performed in non-contact mode using silicon tips, with 256x256 pixels resolution and a scanned area of 2x2 μm2 and 10x10 μm2 (the 10x10
μm2 topographic images are in Appendix).
The Nano-Observer AFM from CSInstruments was used in all the experiments, in the Organic Electronics group at Instituto de Telecomunicações as show in the Figure 17.
21
In order to characterize the samples surface, the Root-mean-square (Rrms) was used to quantify spatial differences in each monolayer where N is the number of lines and de M the number of columns. The analyzed surfaces were characterized through the calculation of the height distributions of the gains (z (x,y) value), using the formula below:
Rrms 𝑁, 𝑀 = 1 𝑁𝑀 [𝑧 𝑥, 𝑦 − 𝑧KLM 𝑁, 𝑀 ]O P QRS T URS
2.2.4 Neutron reflectivity
The neutron reflectivity (NR) is a non-destructive technique that allows the analysis of thin layers thickness with a resolution ranging from 5 to 50000 Å (61). The specular reflection measurement principle consists in determining the coefficient of reflection of a neutron beam sent diagonally to a sample, and by analyzing the density profile of the neutron scattering length perpendicular to the plane of a surface or interface, allows the chemical composition and thickness to be determined (62). The Figure 18 shows a simplified scheme of the NR technique, as well as the common obtained results.
In a simplified way, the values obtained during the measurement are processed by the computer through advanced mathematical formulas (Figure 18 - a)), originating from there an interpolated point graph (Figure 18 - b)), which in turn is model fitted to the sample measurements (Figure 18 - c)).
Figure 18 - Simplified scheme of a neutron reflectivity instrument and results, here: Kin=incoming beam; Kout= outgoing beam; Qz= surface normal; 𝜃in = incident angle and 𝜃out=reflected angle. Figure adapted from (63)
22
In the NR technique, the minimum reflectivity value used experimentally directly influences the thickness value that can be observed. Such minimal reflectivity value is usually between 10-6 and 10-7 in samples with only a few cm2. There are other laboratory instruments, such as X-Ray reflectivity, that have lower minimum reflectivity values than NR. Therefore, this instruments are preferable in many experimental cases, being used as a complementary measurement to NR, as it provides information on the electron density profile (62).
However, neutrons have some unique advantages in comparison to photons, that makes them capable of measurements that are impossible to obtain using the X-Ray reflectivity for example, the characterization of buried interfaces in soft matter, among others. This is due to the fact that the interaction occurs directly between the neutron and the nuclei of atoms and not with the electronic cloud, as in the case of X-rays. This difference comes from the fact that neutron reflection index is very dependent of its content on hydrogen atoms, and by replacing the hydrogen atoms of a molecule by deuterium atoms, it will strongly modify its refraction index without alternating significantly its physical and chemical form. This allows to tune the neutron refractive index, for example, by labeling some molecules with deuterium, which will increase the contrast in the system, and by mixing hydrogenated and deuterated solvents in order to match one of the layers in the system, will make it invisible from the neutron point of view (62). This was successfully applied the field of polymers (64).
NR technique is able to study deeper layers also because, contrarily to X-Ray reflectivity, neutrons are barely absorbed by matter, except for a few atoms that have a huge neutron absorption, such as boron, gadolinium, lithium. This weak interaction allows to analyze the buried interfaces and to study in situ experiments in various sample environments.
NR is also ideal for non-destructive analysis, once the neutrons wavelengths used in experiences are typically in the range of 1 to 20 Å and have an energy of a few meV. Contrarily to X-rays, that uses wavelengths with energy in the order of keV (62), ideal for biological materials, such as the multilayer films.
The NR measurements were made at the Laboratoire Léon Brillouin in France (65) under the european funding NFFA.EUROPE.
23
2.2.5 Drug delivery layer-by-layer films preparation
All laboratory glassware used to prepare the films were previously cleaned with “piranha solution”, which consist in a mixture of H2SO4 and H2O2 (2:1) during about 45 minutes to
remove any organic substances followed by a washing with distilled and milli-Q water. The films were made on the top of quartz substrates that were also washed using the same procedure described above. After washing, a 10 minutes of oxygen plasma in the vacuum chamber Plasma Prep 2 from Gala Instrument was perform, increasing the hydrophilicity of the substrate surface improving the adsorption of the first polymer.
In this work, each bilayer was formed using the four steps of LbL technique schematized in the Figure 19. The adsorption times of each layer were previously optimized in order to ensures the formation of each layer. First, the hydrophilic substrate was immersed into a PBAE solution, during approximately 6 minutes. After this, the substrate was remove from PBAE solution and dipped in sodium acetate (pH= 5.0) three times, to remove all molecules that were not adsorbed or only partially adsorbed to the surface. After these two steps, a PBAE monolayer is formed. Then, the formed monolayer was immersed into the (Poly-CD+Brim) solution, for 11 minutes, following by the dipping in a new sodium acetate solution (pH= 5.0) three times and the drying with nitrogen gas. After these two final steps, a monolayer of (Poly-CD+Brim) is formed on top of the PBAE monolayer, creating one (PBAE/Poly-CD+Brim) bilayer, completing one cycle of the LBL assembly. This newly created bilayer was measured directly on the substrate inside the UV-vis spectrometer, ensuring the correct formation of the new bilayer on the subtract surface.
Figure 19 – Schematic representation of the LbL technique used.
This cycle was repeated, forming DD films with six as a maximum number of bilayers per substrate. After the LbL assembly, the resulting film constituted by (PBAE/Poly-CD+Brim)6
24
Figure 20 –Schematic representation of a LbL assembly with (PBAE/Poly-CD+Brim) bilayer, figure adapted
from (66).
2.2.6 3D printing
The term “3D printing” describes the process to create a three-dimensional model under computer control, through the fusion and solidification of a suitable material. (67) Also known as layered manufacturing or additive manufacturing, this process is based in an object built from a computer-based design (CAD) by successively adding material layer by layer. (68)
There are several techniques of 3D printing and generally they use an extrusion process called fused deposition modelling (FDM). This technique utilizes the additive approach, in which a continuous thermoplastic filament is heated to a semi-molten state before extrusion for layer-by-layer deposition. (69) Figure 21 shows the schematic representation of this technique.
Figure 21- simplified representation of the operation of the FDM technique, figure adapted from (70). The first step of printing a 3D object is to create a CAD model to a Standard Triangle Language (STL) file format, which stores information on the 3D object coordinates and surfaces. After that, a specialized slicing program divides the 3D model into several 2D
cross-25
section layers and sends the information to the 3D printer to process. (71)
Finally, the 3D printer’s extruder head is fed with a filament from a large coil (Figure 21) and moves under the computer’s control coordinates forming a layer in two dimensions (X and Y axle), depositing the heated filament onto the print bed. After the conclusion of the first layer, the print head is then slightly moved vertically (Z axle) to begin a new layer and this process is repeated until the entire 3D object is completed. (70, 72)
The 3D printer used for this work was a HelloBeePrusa by BeeVeryCreative in the Chemistry laboratory at Instituto Superior de Engenharia de Lisboa (ISEL) (Figure 22 – e)).
All parts of the 3D printer were manually assembled (Figure 22 – a) to d)) and it had calibrated before the object could be printed. Its main objective was to print the dynamic cells sliced by Ultimaker CuraÒ and created in CAD using AutodeckÒ TikercadTM program (73).
Figure 22 - Schematic image of HelloBeePrusa's construction; a) - complete assembly of extruder module; b) -
complete assembly of support structure; c) – connection of support structure with extruder head; d) - assembly of electronic component; e) - assembly completed and operational.
2.2.7 Dynamic cell designs
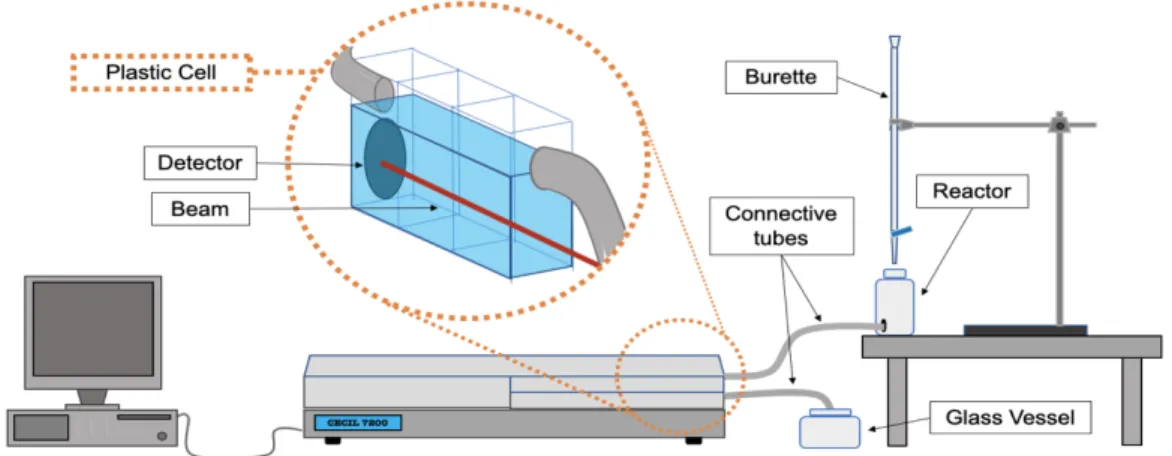
The dynamic cell design went through various stages of evolution until the desired cell design was obtained. The first one was based in cell to be inserted inside of the UV-Vis spectrophometer in order to evaluate the drug release kinetic in real time. Figure 23 shows the setup that was developed which consisted in a transparent plastic cell to follow the solution that continuously passes inside. This cell was not printed but it was fabricated from three plastic cells glued together. To test the cell, preliminary tests were performed using a
26
solution of K2Cr2O7 with a concentration of 78mg/L that was inserted in the burette, dropping
one drop of solution approximately every 2 seconds, into the cell.
Figure 23 –Scheme illustrating the assembly used to test the variation of concentration of K2Cr2O7, in relation to time.
With the first drop falling into the cell, the first spectrum was performed, obtaining new spectra measurement every 2 minutes. The test was finished when all the content of the 50 mL counter ended. The results are shown in Figure 24.
In Figure 24, a zoom in graph between 290 nm and 340 nm wavelengths can be seen, showing a progressive increase in K2CR2O7 absorbance was the time advances, validating
the theory that it is possible to track the change in absorbance in-situ in UV-vis inside the spectrophotometer.
27
Figure 24 – Zoom in graph between the 290 nm and 340 nm, showing the variation of the absorbance of
K2Cr2O7 values within the cell, in relation to time (measured every to 2 minute).
Using the absorbance peak of 313 nm, a correction graph between the absorbance and time was created in order to show that the absorbance value increased linearly over time, as can be seen in Figure 25.
Figure 25 – Absorbance of K2Cr2O7 at 313 nm, in relation to time.
0 0.1 0.2 0.3 0.4 0.5 0.6 0.7 0.8 290 295 300 305 310 315 320 325 330 335 340 A b so rb a n ce Wavelenght (nm) Baseline Tempo 00 2 minutes 4 minutes 6 minutes 8 minutes 10 minutes 12 minutes 14 minutes 16 minutes 18 minutes 20 minutes 22 minutes 24 minutes 26 minutes 28 minutes 30 minutes 32 minutes 34 minutes 36 minutes 38 minutes 40 minutes 42 minutes 44 minutes 46 minutes 48 minutes 50 minutes 52 minutes 54 minutes 56 minutes 58 minutes 60 minutes 62 minutes 64 minutes 66 minutes 68 minutes Pure -0.01 0.01 0.03 0.05 0.07 0.09 0.11 0.13 0.15 0.17 0.19 A b so rb a n ce Time (minutes)
Absorbance at 313 nm
0 4 8 12 16 20 24 28 32 36 40 44 48 52 60 64 6828
Observing the graph above, that as K2Cr2O7 is released to the cell, it increases its
concentration within the dynamic cell in a progressive and linear fashion over time.
To determine if the implementation of a stirring motor inside the UV-vis measuring chamber could affect the spectra, a control test was performed. Using three different types of stirring motors (motor A, B and C) placed directly in the spectrophotometric measuring chamber, K2Cr2O7 spectra were obtained (Figure 26).
Figure 26 - Absorbance spectrum of motor A, motor B and C.
The first measurement was made without any motor in the chamber to create the reference, followed by two measurements with the motor A inside, one made with the motor switch “OFF”, and another with the motor switch “ON”, respectively. This process was repeated in the same way for motor B and C. The results from the motor switch “OFF” and “ON” are show in the Figure 26, with a zoom in graph between 240 nm and 280 nm zone in Figure 27.
After analyzing the dada in Figure 27, it is possible to visualize that the spectra obtained are practically identical over the entire wavelength in all motors, overlapping almost completely. Concluding that there are no significant differences between any of the motors, whether being “ON” or “OFF”.
0 0.5 1 1.5 2 2.5 3 200 210 220 230 240 250 260 270 280 290 300 310 320 330 340 A b so rb a n ce Wavelenght (nm)
Baseline Motor A - OFF Motor A - ON Motor B - OFF Motor B - ON Motor C - OFF Motor C - ON
29
Figure 27 - Absorbance spectrum of motor A, motor B and C (zoom in graph between 240 and 280 nm of
Figure 26).
In conclusion, through these preliminary tests, it was possible to verify the ability of the spectrophotometer to detect small absorbance variations inside a cell with dynamic behavior in real-time, obtaining a constant increase in the absorbance over time without any interference from the stirring motors, as theoretically intended.
After these tests, dynamic cells were 3D printed using a yellow PLA filament at temperature of 215 ºC and a print resolution of 0.2 mm.
For the design of the dynamic cell, several measurements and anatomic factors of the ocular system were taken into consideration, being the surface area, the volume of the tear film and the speed of renewal the most studied. In order to determine the flow rate to be used in the experiment, calculations were made to find out the percentage of tear renovation that occurred per minute on the ocular surface. This way, the surface area of the eyeball was calculated to determine the total tear film volume.
Given the anatomical differences of each individual, an exact value of the surface area of the globe could not be determined, so an average value of 18.10 cm2 of the values found in the literature was used (74, 75). Of this total area, only the anterior part of the globe is covered by tear film, which corresponds to approximately 1/3 of the superficial area of the ocular globe, which means approximately 6 cm2.
-0.05 0.45 0.95 1.45 1.95 240 250 260 270 280 A b so rb a n ce Wavelenght (nm) Motor A - ON Motor B - ON Motor C - ON Motor A - OFF Motor B - OFF Motor C - OFF Baseline
30
The tear film is comprised of 3 layers, a 0.1 to 0.2 µm thick lipid layer, a 6 to 10 µm thick aqueous layer, and a 0.03 µm thick mucus layer. However, depending on the author, its total thickness may vary from 6 µm - 20 µm (76, 77). Considering the discrepancies in the tear thickness values, an intermediate value of 10 µm thickness was considered for these calculations. Considering the values presented above, the average volume of the tear film at a given moment is given by:
Tear Film Volume = 6 cmO × 10 µm = 7.2 ×10_` cm`
Several studies have determined that the rate of tear renewal is approximately 1.2 µL/min or 1.2 x10⁻³ cm3/min (78, 79). Using this value, the renewal percentage rate (RPR) is given by:
𝑅𝑃𝑅 = 1.2 ×10
_` 𝑐𝑚`
7.2 x10_`c𝑚` ×100% = 16.7%
These values were considered as the starting point for the dynamic kinetics, allowing to correlate the tear film renewal rate with the cell flow rate in relation to its volume and mimetizing the anatomical behavior.
Using the AutodeckÒ TikercadTM program (73), the first printed cell design was created.
This prototype consisted in a basic rectangular cell with two circular openings, where 2 silicone tubes were fitted and through which the liquid would pass, as shown Figure 28. More dimensions of the cell design can be seen in Figure 48 in Appendix
The cell had an internal volume of 44.16 cm3 and it was used to evaluate the dynamics of the aqueous solution. Despite it had the overall shape of the desired cell, when the placing the film inside the cell, the lack of agitation led to low homogeneity of the medium. However, when an agitator was placed along with the film in the medium, the agitation caused an abrupt rupture of the layers out of the substrate, and thus, completely destroying it. Another problem was the absence of a film attachment point, causing the film to not remain firmly fixed upright inside de cell and at risk of falling during adsorption. So, in order to properly accommodate the multilayer film substrate and a magnetic stirrer inside the cell, some changes were required.
Equation (6) Equation (5)