João M. Pinto (Portugal)
What is project finance?
AbstractProject finance is the process of financing a specific economic unit that the sponsors create, in which creditors share much of the venture’s business risk and funding is obtained strictly for the project itself. Project finance creates value by reducing the costs of funding, maintaining the sponsors financial flexibility, increasing the leverage ratios, avoiding contamination risk, reducing corporate taxes, improving risk management, and reducing the costs associated with market imperfections. However, project finance transactions are complex undertakings, they have higher costs of borrowing when compared to conventional financing and the negotiation of the financing and operating agreements is time-consuming. In addition to describing the economic motivation for the use of project finance, this paper provides details on project finance characteristics and players, presents the recent trends of the project finance market and provides some statistics in relation to project finance lending activity between 2000 and 2014. Statistical analysis shows that project finance loans arranged for U.S. borrowers have higher credit spreads and upfront fees, and have higher loan size to deal size ratios when compared with loans arranged for borrowers located in W.E. On the contrary, loans closed in the U.S. have a much shorter average maturity and are much less likely to be subject to currency risk and to be closed as term loans.
Keywords: project finance, structured finance. JEL Classification: G24, G32.
Received on: 24th of December, 2016.
Accepted on: 15th of February, 2017. Introduction©
Typically used for funding public and private capital-intensive facilities and utilities, project finance (PF) is an economically significant growing financial market segment, but still largely understudied. Esty and Sesia (2007) report that a record $57.8 billion in PF funding was arranged in Western Europe (W.E.) in 2006, which compares with $35.0 billion invested in the United States (U.S.) – record $328 billion in PF funding was globally arranged in 2006, a 51.2% increase from the $217 billion reported for 2001. In 2014, $54.1 billion and $60.2 billion were arranged in W.E. and the U.S., respectively – $260 billion was arranged worldwide during 2014. According to Thomson Reuters, in comparison with other financing mechanisms in W.E., as well as in the U.S., the PF market was smaller than both the corporate bond and the asset securitization markets in 2014. However, the amount invested in PF was larger than the amounts raised through IPOs or venture capital funds, which indicates that the financial crisis has had a small impact on the financing of large infrastructures and still represents a promising segment of global lending activity.
© João M. Pinto, 2017.
João M. Pinto, Professor of Finance, Católica Porto Business School, Catholic University of Portugal, Portugal.
This is an Open Access article, distributed under the terms of the Creative Commons Attribution-NonCommercial 4.0 International license, which permits re-use, distribution, and reproduction, provided the materials aren’t used for commercial purposes and the original work is properly cited.
Nevitt and Fabozzi (2001) present PF as the process of financing ‘a particular economic unit in which a lender is satisfied to look initially to the cash flows and earnings of that economic unit as the source of funds from which a loan will be repaid and to the assets of the economic unit as collateral for the loan’. Thus, the funding does not depend on the reliability and creditworthiness of the sponsors and does not even depend on the value of assets that sponsors make available to financiers. In this line of reasoning, Gatti (2008) refers to PF as ‘the structured financing of a specific economic unit that the sponsors create by means of share capital, and for which the financier considers cash flows as the source of loan reimbursement, whereas project assets only represent collateral’.
Considering that debt repayment comes from the project only rather than from any other entity – nonrecourse debt1 –, Esty (2004b) defines PF as a transaction that ‘involves the creation of a legally independent project company financed with equity from one or more sponsoring firms and nonrecourse debt for the purpose of investing in a capital asset’. Esty focuses on the following three key decisions related to the use of PF: (i) investment decision – involving industrial assets; (ii) organizational decision – creation of a legally independent company to own the assets (off-balance sheet form of financing); and (iii) financing decision – nonrecourse debt. This definition distinguishes PF from other structured financing vehicles like securitization, leveraged acquisitions, and structured leasing.
1 At the other extreme, in conventional corporate financing, lenders rely on the overall creditworthiness of the enterprise financing a new project to provide them security.
Over the last 35 years, PF has been an important source of funding for public and private ventures around the world. It is most commonly used for capital-intensive facilities and utilities such as power plants, refineries, toll roads, pipelines, telecommunications facilities, and industrial plants with relatively transparent cash flows, in riskier than average countries, using relatively long-term financing. Definitions of PF emphasize the idea that lenders have no claim to any other assets than the project itself. Therefore, lenders must be completely certain that the project is fully capable of meeting its debt and equity liabilities through its economic merit alone. The success of a PF transaction is highly associated with structuring the financing of a project through as little recourse as possible to the sponsor, while at the same time providing sufficient credit support through guarantees or undertakings of a sponsor or third party so that lenders will be satisfied with the credit risk2. Finally, the allocation of specific project risks to those parties best able to manage them is one of the key comparative advantages of PF. Using a global sample of 5,935 PF deals (10,950 PF loans) closed in the 2000-2014 period, we show that PF has not significantly contracted during the 2007-2008 financial crisis and the subsequent European sovereign debt crisis. In 2014, a record $259.9 billion in PF funding was globally arranged, a 278.5% increase from $68.7 billion reported for 2000. PF lending is concentrated in five key industries – utilities, construction, manufacturing, mining and transportation account for 77.3% of all PF lending. We also show that there are considerable differences between the countries, which attract PF lending. The biggest recipients of PF lending are Western Europe and Eastern Asia, whereas only 10.4% of PF lending goes to U.S. borrowers.
Statistical results show that most of the common contractual characteristics of PF loans differ significantly between deals extended to U.S.
vis-à-vis W.E. borrowers, with the exception of deal size
and loans extended to financial institutions. Our results show important univariate differences, namely: (i) PF loans’ average credit spreads are significantly higher for deals closed in the U.S. than those closed in W.E.; (ii) loans arranged for U.S. borrowers have a significantly larger average tranche size than loans extended to W.E. borrowers; (iii) deals in W.E. benefit more from tranching – they have a higher number of tranches and, thus, lower loan size to deal size ratios than deals in the U.S.; (iv) loans extended to W.E. borrowers have much longer average maturity than
2 See Fabozzi et al. (2006) and Caselli and Gatti (2005) for a description of the key elements of a successful project financing transaction.
those arranged for U.S. borrowers; and (v) PF loans in the U.S. are much less likely to be subject to currency risk and to be closed as term loans, and are more likely to be closed as fixed rate loans rather than floating rate loans.
The remainder of the paper is organized as follows. Sections 1 and 2 describe the typical PF transaction scheme and the main economic motivations and problems of PF, respectively. The recent trends in project financing are presented in section 3. Section 4 presents the contractual characteristics of PF loans and compares loans arranged for U.S. borrowers with those extended to borrowers located in W.E. The final section presents the main conclusions. 1. Project finance: characteristics and players There are five distinctive features of a PF transaction. First, the debtor is a project company (special purpose vehicle – SPV) that is financially and legally independent from the sponsors, i.e., project companies are standalone entities. Second, financiers have only limited or no recourse to the sponsors – the extent, amount and quality of their involvement is limited. Third, project risks are allocated to those parties that are best able to manage them. Fourth, the cash flow generated by the project must be sufficient to cover operating cash flows and service the debt in terms of interest and debt repayment. Finally, collateral is given by sponsors to financiers as security for cash inflows and assets tied up in managing the project.
Commonly referred as “off-balance-sheet” financing, PF is often used to segregate the credit risk of the project from that of its sponsors so that lenders, investors, and other parties will appraise the project strictly on its own merits. It involves the creation of an entirely new vehicle company, with a limited life, for each new investment project. Project companies are legally independent entities with very concentrated equity ownership and have higher leverage levels. Esty (2004b) shows that project companies’ average book value debt-to-total capitalization ratio is 70%, which is two to three times higher than the average leverage ratio of a typical publicly traded company, and are funded through a series of legal contracts. This idea is corroborated by Esty (2003), who describes PF as a form of financing based on a standalone entity (project company), with highly levered capital structures, concentrated equity ownership and concentrated debt ownership3. The core of PF is the analysis of project risks, namely construction risk, operating risk, market risk, regulatory risk, insurance risk, and currency
3 A typical PF transaction only has a few shareholders (three of four), compared to hundreds or thousands of shareholders in public companies.
risk. Gatti (2008) identifies risks related to the pre-completion phase – activity planning risk, technological risk, and construction risk or completion risk; risks related to the post-completion phase – supply risk, operating risk, and demand risk; and risks related to both phases – interest rate risk, exchange risk, inflation risk, environmental risk, regulatory risk, political risk, country risk, legal risk, and credit risk or counterparty risk. These risks are allocated contractually to the parties best able to manage them. The process of risk management is usually based on the following interrelated steps: (i) risk identification; (ii) risk analysis; (iii) risk transfer and allocation; and (iv) residual risk management. This process is crucial in PF transactions and they must be identified and allocated to create an efficient incentivizing tool for the parties involved. PF can, thus, be seen as a system for distributing risk among the parties involved in a venture, i.e., the effective identification and allocation of risks allows the minimization of cash flows’ volatility generated by the project.
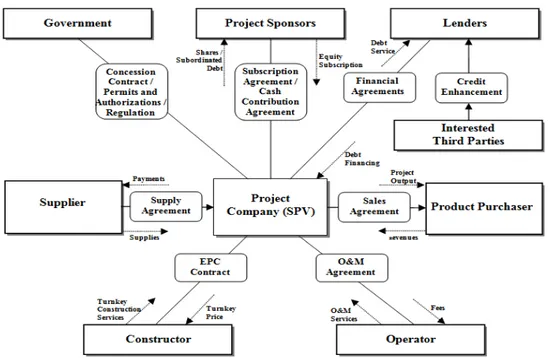
Corielli et al. (2010) argue that one of the key characteristics of PF transactions is the existence of a network of nonfinancial contracts (NFCs), organized by the SPV with third parties, often involving the sponsoring firms as well, i.e., a PF transaction can be viewed as a nexus of contracts between the players involved in such a deal4. Figure 1 presents a graphic representation of a typical contractual framework in project financing. Of the numerous contracts four are particularly important, these are: (i) construction contracts and engineering, procurement, and construction (EPC) closed on a turnkey basis; (ii) purchasing agreements to guarantee raw materials to the SPV at predefined quantities, quality, and prices; (iii) selling agreements enable the SPV to sell part or all of its output to a third party that commits to buy unconditionally at predefined prices and for a given period of time; and (iv) operation and maintenance agreements compliant with predefined service-level agreements. This contractual bundle is, then, presented to creditors to secure debt financing, serving as the basis for negotiating the quantity and the cost of external funding.
Fig. 1. Typical structure of a project finance deal
From Figure 1, it is also possible to identify the following key players in PF: (i) the project sponsors – a controlling stake in the equity of the separate company established for the purpose of undertaking the project will typically be owned4by a single
4 PF is commonly referred to as ‘contractual finance’: the project company signs contracts with construction firms, suppliers, customers, host governments, and lenders. As explained by Esty and Megginson (2003), ‘[T]his nexus of contracts, to use Jensen and Meckling’s (1976) characterization of the firm, is intended to ensure loan repayment when the project is solvent and loan recoverability when the project is in default’.
project sponsor, or by a group of sponsors5; (ii) the host government, and often state-owned enterprises – the project company will in most cases need to obtain a concession from the host government6; (iii)
5 There are four types of sponsors that are often involved in PF transactions and invest in the SPV: (1) industrial sponsors – see PF as an initiative linked to their core business; (2) public sponsors – government or other public bodies whose aims center on social welfare; (3) contract sponsors – they develop, build and run the projects and provide equity and/or subordinated debt to the SPV; and (4) purely financial sponsors – they invest capital with the aim of gathering high returns (e.g., commercial banks, multilateral development banks, and private equity funds).
6 Additionally, sometimes the host government needs to establish a new regulatory framework or provide environmental permits.
the constructing and engineering firms; (iv) the legal specialists; (v) the accounting, financial, and risk assessment professionals; (vi) the lead arranging banks7; (vii) the participating banks; and (viii) the suppliers and customers. A single participant in a PF deal can take on a number of roles, e.g., a contractor can be sponsor, builder, and operator at the same time; banks can be sponsors and lenders simultaneously. However, not all the organizations shown in Figure 1 are necessarily involved. For example, a deal with exclusively private actors would not include sponsors belonging to the public sector. Finally, a structure in which financing is provided directly to the SPV is presented. However, financing may also be structured through leasing vehicles or with a bond offer to the financial market.
PF projects are funded with small amounts of private equity contributions and much larger amounts of nonrecourse syndicated loans, which are the principal external financing type. Esty and Megginson (2003) find that debt ownership is highly and significantly more concentrated than equity ownership and debt ownership concentration is positively related to the strength of creditor rights and the reliability of legal enforcement. Thus, equity and bank debt are the principal financing instruments in a PF transaction. The SPV’s shareholders are expected to provide a certain amount of equity capital in order to demonstrate their commitment to the project. Debt funding can consist of either bank debt – this has been the common means of financing – or financing from bond issues or a combination of both. Bank debt tends to be more expensive than bonds with higher rates and shorter loan duration. However, once a project has completed the development phase including construction, the risk profile alters and the SPV can obtain better refinancing terms and lower rates for the rest of its projected life.
Large-scale projects require substantial investments up-front and only start to generate cash inflows after a relatively long construction period. Thus, PF debt is characterized by much longer maturities compared to other forms of financing. In terms of the cost of funding, Kleimeier and Megginson (2000) assert that PF loans have lower spreads than do most comparable non-PF loans. The absence of a clear relationship between spreads and maturity in PF seemed to be a particular puzzle. Sorge and 7 Lead arrangers perform the due diligence on the vehicle company and the project itself to ensure that all potential adverse information is revealed before loan syndication; design an optimal loan syndicate that will deter strategic defaults but allow for efficient negotiation in the event of liquidity defaults; and spearhead monitoring of the borrower after the loan closes and discourage the sponsor from strategically defaulting or otherwise expropriating project cash flows.
Gadanecz (2008) argue that whereas spreads for both investment and speculative-grade loans other than PF are a positive linear function of maturity, PF loans have a ‘hump-shaped’ or non-linear term structure. This occurs because: (i) as PF loans tend to have short-term liquidity constrains, lenders grant longer maturities to avoid increasing the projects’ probability of default; and (ii) projects go through fairly predictable risk phases that are gradually resolved, with spreads first increasing and, then, falling over time.
2. Advantages and disadvantages of project financing
To understand the motivation for using PF, a thorough understanding is needed of why the combination of a firm plus a project might be worth more when financed separately with nonrecourse debt project financing than when they are financed jointly with corporate funds – corporate financing. Brealey et al. (1996) argue that PF creates value by resolving agency problems and improving risk management. Esty (2003, 2004a, 2004b) takes a more general view of the problem and presents four primary reasons for using PF. Firstly, PF can be used to mitigate costly agency conflicts – agency cost motivation – inside project companies and among capital providers. PF highly levered capital structures play an important disciplinary role, because they prevent managers from wasting free cash flow, and deter related parties from trying to appropriate it. Secondly, this type of transaction allows companies with little spare debt capacity to avoid the opportunity cost of underinvestment in positive NPV projects – debt overhang motivation. According to Nevitt and Fabozzi (2001), Gatti (2008), and Fabozzi et al. (2006), the off-balance sheet treatment of the funding raised by the SPV is crucial for sponsors, since it only has limited impact on sponsors’ creditworthiness, and does not impact sponsors’ ability to access additional financing in the future. Thirdly, PF improves risk management – risk management motivation. The nonrecourse nature of project debt protects the sponsoring firm from risk contamination. Additionally, PF creates value by improving risk management inside the project. Risks are allocated with the goals of reducing cost and ensuring proper benefits. PF can also help to reduce underinvestment due to asymmetric information problems – asymmetric information motivation. The separation of projects from the sponsoring firm or firms facilitates initial credit decisions and it is relatively easy to convey information that would be more difficult in a corporate financing framework, in which the joint evaluation of the project and existing assets can be more problematic.
Bearing the aforementioned arguments in mind, several authors (Brealey et al., 1996; Esty, 2003, 2004a; Corielli et al., 2010) argue that PF transactions lower the cost of funding by mitigating agency costs, reducing information asymmetries, and improving risk management (Pinto and Alves, 2016). Empirically, Gatti et al. (2013) corroborate this idea by showing that certification in PF can create economic value by reducing loan spreads. Additionally, Esty (2003) also points out the reduction of corporate taxes, namely tax rate reductions and tax holidays, and high leverage increments interest tax shields, as another important economic benefit. Pinto and Alves (2016) show that borrowers choose PF when they seek long-term financing and funding cost reduction.
Despite the referred advantages, it is possible to identify in the extant literature (e.g., Esty, 2004a,b; Fabozzi et al., 2006; Gatti, 2008; Bonetti et al., 2010) the following main problems related to the use of PF: (i) complexity in terms of designing the transaction and writing the required documentation; (ii) higher costs of borrowing when compared to conventional financing; and (iii) the negotiation of the financing and operating agreements is time-consuming. As pointed out by Esty (2004a), a PF transaction is expensive to set up, it takes a long time to execute, and it is highly restrictive once in place. Similarly, Gatti (2008) confirms that the principal drawback of PF is that structuring such a deal is more costly than the corporate financing option. Although these are counter-intuitive features of project finance when compared to corporate financing, Esty (2004b) and Bonetti et al. (2010) state that in practice, the additional costs are more than compensated for by the advantages that arise from the reduction in the net financing costs associated with large capital investments, off-balance sheet financing, and appropriate risk allocation.
3. Recent trends in project financing
Kleimeier and Megginson (2000) point out that ‘[T]he use of project finance to fund natural resources, electric power, transportation, and other ventures around the world has risen steadily for the past four decades, from its modern beginnings financing development of the North Sea oil fields during the 1970s’. Data reported by Esty and Sesia (2007) indicate that, in the U.S., the PF market is smaller than the total value of corporate bond issues, but larger than the total value of funds raised through initial public offerings or venture capital funds – considering all global markets, PF bank loans and project bonds recorded 23% and 15% compound annual growth rates, respectively, from 1994 to 2006. PF has not contracted significantly
during the current financial crisis when compared to other forms of financing. Indeed, the total value of PF arranged worldwide hit a record of $320.9 billion during 2008, and dropped only 9% to $292.5 billion during 2009. In 2014, $260 billion were arranged worldwide8. This indicates that the financial crisis has had a small impact on the financing of large infrastructures and still represents a promising segment of global lending activity, mainly in Europe.
According to Gatti (2005), the growth trend of PF transactions in the eighties and nineties moved along two lines: (i) expansion of PF in developed countries – promoters began to promote PF technique to developing country governments as a way to rapidly create basic infrastructure and ensure greater involvement of private capital, guaranteed by Export Credit Agencies in their own countries; and (ii) development of PF in developed countries as a way to realize projects that had lower market risk coverage or projects in which the government intervened to promote the development of public works (public-private partnerships – PPPs).
As far as financing is concerned, sponsors have been reverting to more structured deals as a way to shift market risk from companies back to the buyers of the project’s output. Additionally, sponsors can use various hybrid structures to mitigate risks, which are better suited for certain types of assets and have the potential to expand the boundaries of PF into new asset classes. PPPs are an example of a hybrid structure that has become more common. PPPs use private capital and private companies to construct and, then, operate project assets, such as roads, prisons, and schools, which historically have been financed with public resources and operated on a not-for-profit basis (Esty, 2004a). Through PPP structures, governments shift construction and operating risks to the private sector, which is usually more efficient in building and, then, running the asset9. In these partnerships, the role of public bodies is usually based on a concession agreement. Thus, a PPP is any medium-to-long term relationship between the public and private sectors, involving the sharing of risks and rewards of multisector skills, expertise and finance to deliver desired policy outcomes.
In practice, various acronyms are used for the different types of concession agreements, namely:
8 Source: Thomson Reuters Global Project Finance Review. For further development, see section 4.
9 Blanc-Brude and Strande (2007) define PPP as ‘an increasingly popular method of procurement of public infrastructure projects – one in which a public authority commissions the design, construction, operation, maintenance, and financing of a public infrastructure project from a private consortium within a single contractual framework’.
(i) BOT (build, operate, and transfer); (ii) BOOT (build, own, operate, and transfer); and (iii) BOO (build, operate, and own). In UK – the first country to launch a systematic program of such projects – PPPs are part of what is known as the Private Finance Initiative (PFI), which is a strategic economic policy to migrate public administration from owning assets and infrastructures to purchasing services from private parties instead. A government that uses PF obtains both private-sector funding and private-sector management. PF thereby reduces the need for government borrowing, shifts part of the risks presented by the project to the private sector, and aims to achieve more effective management of the project. According to Blanc-Brude and Strange (2007), risk transfer is the central motivation for using PPP, by which the benefits of efficient risk management by private investors are expected to more than offset the cost of risk-pricing. Klompjan and Wouters (2002) state that one of the main advantages of a PPP for a government or a public entity is allowing a project to proceed without being a direct burden on the government’s budget. Despite all of the advantages connected to PPPs, there also are pivotal points of concern and criticism. For example, some critics argue that the cost of funding in a PPP is higher than the cost of public funds. In this regard, a distinction is commonly made among operators: PF initiatives, which are fully self-financed PF in the strict sense, in which the assessment is based on the soundness of the contractual framework and the counterparties versus those that are partially self-financed – the bankability depends considerably on the level of public grants conferred.
Another important influence on the future of PF is the impact of bank regulation. According to Basel II and Basel III accords, PF loans have higher default and loss rates than commercial loans and, therefore, deserve higher capital requirements. In its preliminary assessment, the Committee argues that project loans possess unique loss distribution and risk characteristics, including greater risk volatility than other types of bank loans, which could lead to both high default rates and high loss rates (BIS, 2001). Thus, spreads on low-rated PF loans would have to increase.
Casting doubt on such arguments, however, existing research indicates that PF loans perform substantially better than corporate loans, and default rates and recovery rates are not necessarily correlated. Using a sample of 759 loans, Standard & Poor’s (2004) found that the loss given default (LGD) of PF loans is quite low (25% on average) and that, thanks to restructurings, 100% of loan values were maintained in their sample. Moreover,
the study also reported that PF loans have better LGD rates than secured, senior, and senior unsecured corporate debt10. Notwithstanding, the New Capital Accord (Basel II) and even the Basel III Accord state that unless banks qualifies for the internal rating based (IRB) approach, the capital reserve requirements for project loans must be increased, especially for transactions falling within the best rating classes.
Considering the referred change in the regulatory environment, the development of methods for offsetting the impact of the New Capital Accord rules on PF loans has become a relevant issue. For example, until mid-2007, banks developed their capabilities to securitize PF loans issuing collateralized loan obligations (CLOs) or collateralized debt obligations (CDOs), thereby creating a new asset class for institutional investors11. Credit Suisse First Boston was the first institution to securitize the first portfolio of project loans in 1998, later followed by other banks. Sponsors benefit from securitization by gaining quicker access to funds, while banks benefit by increasing the speed of lending and useful instruments in order to comply with regulatory capital requirements and to increase funds available to finance infrastructure and development projects. Despite the referred benefits, there have been few securitized transactions as a result of insufficient data available for banks and rating agencies on loss characteristics12. Additionally, project loans securitization will remain difficult, and institutional investors are going to be reluctant to enter the market after the 2007/2008 financial turmoil. On the other hand, the issuance of PF straight bonds has increased significantly during the European sovereign debt crisis.
4. Project finance: markets and deals
This section provides a statistical analysis of PF lending worldwide. Our sample consists of individual loans extracted from Dealscan and covers the 2000-2014 period. Dealscan provides individual deal information on the global syndicated loan
10 See also Beale et al. (2002) for an initial analysis of this subject. 11 A CDO is a transaction, which involves repackaging the risk of a portfolio of financial assets. This risk is transferred to an SPV, either by transferring the portfolio to the SPV or using credit derivative techniques. The risk is, then, sold to the capital markets by way of the issuance of securities by the SPV, whereby investors in those securities bear the risk of losses suffered by the portfolio.
12 Structuring these types of deals is more complex than traditional CDOs. Buscaino et al. (2012) point out four main reasons: (i) in traditional CDOs, the assets included in the pool are usually more homogeneous than in project CDOs; (ii) reaching an appropriate size for the pool of assets is not as easy as for traditional CDOs; (iii) the intrinsic complexity of PF transactions; and (iv) the definition of credit events for the PF loans can be problematic, given the different nature of the projects in the pool.
markets. Information is available on the micro characteristics of the loans (e.g., deal and loan size, maturity, currency, pricing, rating, type of interest rate) and of the borrowers (e.g., name, nationality, industry sector). Although the database extracted from Dealscan contains detailed historical information about syndicated loans and related banking instruments, we have excluded deals with no loan (facility) amount or deal amount available. These screens have yielded a sample of 5,935 PF deals (10,950 PF loans), worth $2,108.8 billion. This sample represents almost 90% of the PF syndicated lending between 2000 and 2014 – according to Thomson Reuters, global syndicated lending reached $48,082.8 billion during this period.
The PF deal samples are described in Tables 1 to 3. The distribution by year of deals is described in Table 1. Table 2 presents the industrial distribution of the PF sample, while Table 3 presents the geographic distribution of PF syndicated loans. Table 1 shows that PF lending peaked in 2008 (by value and number), fell in 2009 and rose again in 2010 and 2011. In 2014, a record $259.9 billion in PF funding was globally arranged, a 278.5% increase from the $68.7 billion reported for 2000. Table 1 also shows that PF has not significantly contracted during the 2007-2008 financial crises.
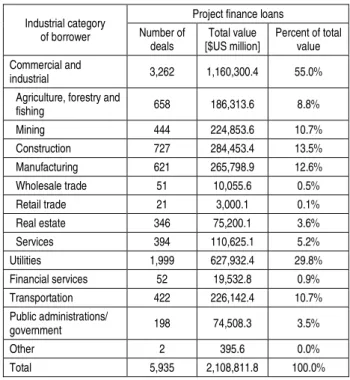
Table 2 shows that PF lending is concentrated in five key industries, i.e., Utilities (29.8%), Construction (13.7%), Manufacturing (12.6%), Mining (10.7%) and Transportation (10.7%) account for 77.3% of all PF lending (value) and 71.0% of all PF deals. Similar results are presented by Kleimeier and Megginson (2000). Based on a sample of 4,956 PF loans booked on national and international markets from January 1, 1980 through to March 23, 1999, they find that no less than 90.9% of all PF lending (by value) are made to borrowers in the Commercial & Industrial, Utilities, and Transportation industries. Corielli et al. (2010) present similar results. Based on a sample of PF loans closed between January 1998 and May 2003 they show that the largest share of loans was awarded to electricity/power and other energy utilities (about 52% of the total value), followed by telecommunications (28%) and transportation (14%). This finding is consistent with the common understanding that PF is used primarily to fund tangible-asset-rich and capital intensive projects.
Table 1. Distribution of the sample of PF deals by year
Year
Project finance loans
Number of deals [$US million] Total value Percent of total value 2000 271 68,667.7 3.3% 2001 255 58,547.0 2.8% 2002 232 48,319.1 2.3% 2003 224 63,.925.8 3.0% 2004 234 58,874.0 2.8% 2005 222 76,319.5 3.6% 2006 211 100,783.7 4.8% 2007 332 153,311.5 7.3% 2008 535 214,201.1 10.2% 2009 468 166,510.3 7.9% 2010 597 203,789.6 9.7% 2011 609 218,654.2 10.4% 2012 537 195,.142.7 9.3% 2013 588 221,861.1 10.5% 2014 620 259,904.4 12.3% Total 5,935 2,108,811.8 100.0%
Notes: Table describes the distribution of the sample of PF deals by year. The first column details the number of deals per year, while the second column describes the total value in $US million. The third column presents percentages of the total value per year.
Table 2. Industrial distribution of the sample of PF deals
Industrial category of borrower
Project finance loans Number of deals Total value [$US million] Percent of total value Commercial and industrial 3,262 1,160,300.4 55.0% Agriculture, forestry and
fishing 658 186,313.6 8.8% Mining 444 224,853.6 10.7% Construction 727 284,453.4 13.5% Manufacturing 621 265,798.9 12.6% Wholesale trade 51 10,055.6 0.5% Retail trade 21 3,000.1 0.1% Real estate 346 75,200.1 3.6% Services 394 110,625.1 5.2% Utilities 1,999 627,932.4 29.8% Financial services 52 19,532.8 0.9% Transportation 422 226,142.4 10.7% Public administrations/ government 198 74,508.3 3.5% Other 2 395.6 0.0% Total 5,935 2,108,811.8 100.0%
Notes: Table describes the industrial distribution of the sample of PF deals over the 2000-2014 period. The first column details the number of each type of deal allocated to borrowers in a particular industry, while the second column describes the total value (in $US million) of deals for each industry. The third column presents percentages of the total value for each industry.
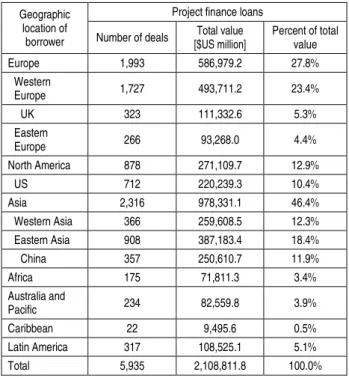
Table 3 also shows clear differences between the countries which attract PF lending. The biggest recipients of PF lending are Western Europe and Eastern Asia. These regions account for 23.4% and 18.4% of the total value and no less than 29.1% and 15.3% of the total number of deals of PF loans, respectively, whereas only 10.4% of PF lending and only 12.0% of PF deals go to U.S. borrowers. The relevance of PF lending in Western Europe reflects two major trends. First, the emphasis placed by UK governments on the Private Finance Initiative, i.e., on private rather than public financing of large public infrastructure projects. The UK was the first country to launch a systematic program of such projects, based on a strategic economic policy to migrate public administration from owning assets and infrastructures to purchasing services from private parties instead. Second, PF, especially public-private partnerships, played an important role in reducing the need for government borrowing and shifting project risks to the private sector in Southern European countries. Through PPP structures, governments shift construction and operating risks to the private sector, which is usually more efficient in building and running the asset, and obtains both private-sector funding and private-sector management. As a whole, more than 50% of PF lending goes to non-OECD countries, which is consistent with the idea that PF is an appropriate method of funding projects in relatively risky countries.
Table 3. Geographic distribution of the sample of PF deals
Geographic location of
borrower
Project finance loans Number of deals Total value
[$US million] Percent of total value Europe 1,993 586,979.2 27.8% Western Europe 1,727 493,711.2 23.4% UK 323 111,332.6 5.3% Eastern Europe 266 93,268.0 4.4% North America 878 271,109.7 12.9% US 712 220,239.3 10.4% Asia 2,316 978,331.1 46.4% Western Asia 366 259,608.5 12.3% Eastern Asia 908 387,183.4 18.4% China 357 250,610.7 11.9% Africa 175 71,811.3 3.4% Australia and Pacific 234 82,559.8 3.9% Caribbean 22 9,495.6 0.5% Latin America 317 108,525.1 5.1% Total 5,935 2,108,811.8 100.0%
Notes: Table describes the geographic distribution of the sample of PF deals over the 2000-2014 period. The first column details the number of each type of deal allocated to borrowers in a particular region (or country), while the second column describes the total value (in $US million) of deals for each region. The third column presents percentages of the total value for each region.
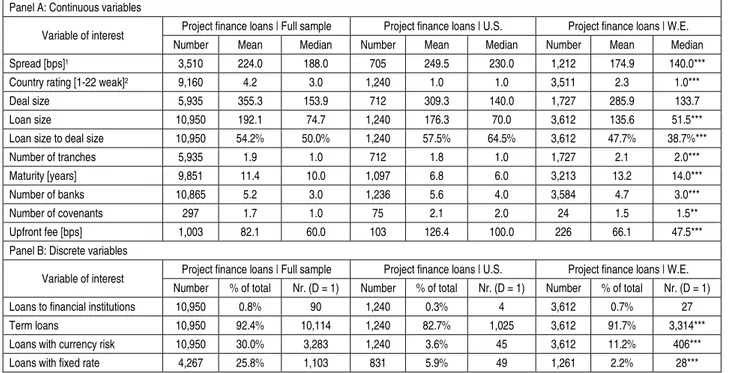
Table 4 presents basic contractual characteristics for the sample of PF loans. Considering that Carey and Nini (2007) suggest that the corporate syndicated loan market is not globally integrated, offering evidence that spreads and pricing characteristics are different in Europe and the U.S., we also created two sub-samples of PF loans considering whether loans are extended to borrowers in the U.S. or W.E. The main goal is to examine if loans arranged in the U.S. vis-à-vis W.E. are significantly different financial instruments.
Spread represents the spread paid by the borrower
over Libor plus the facility fee (all-in-spread-drawn). The mean (median) spread for the worldwide sample of PF loans is 224 bps (188 bps). Comparing the two sub-samples, mean spread is lower for PF loans extended to borrowers located in W.E. (174.9 bps) than for PF loans arranged for U.S. borrowers (249.5 bps). This result is in line with those of Carey and Nini (2007), who offer evidence that spreads on syndicated loans are, on average, 30 bps smaller in Europe than in the U.S.
Country rating is approximated by Standard &
Poor’s country credit rating at the time of closing the loans. This variable measures from 1 for the countries with the lowest risk (AAA = 1) to 22 for the countries of highest risk (D = 22). PF loans average country rating is 4.2, which is equivalent to an AA credit rating. As expected, country rating is higher for the W.E. sub-sample when compared with the U.S. sub-sample. This difference was magnified during the European sovereign debt crisis, since rating agencies downgraded sovereign ratings from several Western European countries (e.g., Belgium, Greece, Ireland, Italy, Portugal, and Spain).
While PF deal size does not differ significantly when comparing deals arranged for U.S. versus W.E. borrowers, PF loans extended to U.S. borrowers exhibit higher mean loan size ($176.3 million) than loans extended to borrowers located in W.E. ($135.6 million). For the full sample of PF loans, the average loan size to deal size ratio is 54.2%. Additionally, the loan size to deal size ratio is economically and statistically lower for PF loans arranged for W.E. borrowers (47.7%) than for loans arranged for borrowers located in the U.S. (57.5%). This result can be explained by the fact that W.E. transactions typically include a larger number of tranches than U.S. deals; an average PF deal closed in W.E. includes 2.1 tranches, while average U.S. deals have 1.8 tranches. Thus, we can conclude that PF transactions in W.E. benefit more from tranching.
An average PF loan matures over 11.4 years. An interesting result is that a loan belonging to a W.E. deal has an average maturity of 13.2 years, which is twice more than that of a loan in the U.S. sub-sample (6.8 years). The average number of participating banks
in a deal arranged for U.S. borrowers is 5.6, which is significantly larger than the 4.7 average numbers of banks in a W.E. deal. This is consistent with the view that banks in the U.S. attempt to maximize the number of PF participants to spread out risk.
Table 4. Contractual characteristics of the sample of PF loans Panel A: Continuous variables
Variable of interest Project finance loans | Full sample Project finance loans | U.S. Project finance loans | W.E. Number Mean Median Number Mean Median Number Mean Median Spread [bps]1 3,510 224.0 188.0 705 249.5 230.0 1,212 174.9 140.0***
Country rating [1-22 weak]2 9,160 4.2 3.0 1,240 1.0 1.0 3,511 2.3 1.0***
Deal size 5,935 355.3 153.9 712 309.3 140.0 1,727 285.9 133.7 Loan size 10,950 192.1 74.7 1,240 176.3 70.0 3,612 135.6 51.5*** Loan size to deal size 10,950 54.2% 50.0% 1,240 57.5% 64.5% 3,612 47.7% 38.7%*** Number of tranches 5,935 1.9 1.0 712 1.8 1.0 1,727 2.1 2.0*** Maturity [years] 9,851 11.4 10.0 1,097 6.8 6.0 3,213 13.2 14.0*** Number of banks 10,865 5.2 3.0 1,236 5.6 4.0 3,584 4.7 3.0*** Number of covenants 297 1.7 1.0 75 2.1 2.0 24 1.5 1.5** Upfront fee [bps] 1,003 82.1 60.0 103 126.4 100.0 226 66.1 47.5*** Panel B: Discrete variables
Variable of interest Project finance loans | Full sample Project finance loans | U.S. Project finance loans | W.E. Number % of total Nr. (D = 1) Number % of total Nr. (D = 1) Number % of total Nr. (D = 1) Loans to financial institutions 10,950 0.8% 90 1,240 0.3% 4 3,612 0.7% 27 Term loans 10,950 92.4% 10,114 1,240 82.7% 1,025 3,612 91.7% 3,314*** Loans with currency risk 10,950 30.0% 3,283 1,240 3.6% 45 3,612 11.2% 406*** Loans with fixed rate 4,267 25.8% 1,103 831 5.9% 49 1,261 2.2% 28***
Notes: Table 4 presents contractual characteristics for a sample of 5,935 PF deals (10,050 PF loans), plus two sub-samples created
according to whether loans are arranged for U.S. borrowers – 712 PF deals (1,240 loans) or W.E. borrowers – 1,727 PF deals (3,612 PF loans). In this table, we require that both loan amount and deal amount be available. We test for similar distributions in contract characteristics using the Wilcoxon rank-sum test for continuous variables (Panel A) and the Chi-square test for discrete ones (Panel B).
1
The spread is the spread paid by the borrower over Libor plus the facility fee (all-in-spread-drawn). 2Country risk is the S&P’s
country credit rating at closing date; the rating is converted as follows: AAA = Aaa = 1, AA+ = Aa1 = 2, and so on until D = 22. ***, **, and * indicates significant difference at the 1%, 5%, and 10% levels, respectively, between the sub-samples.
The variable number of covenants suffers from a missing value problem (an empty cell may mean that the loan has no covenants or that the data are unavailable). We, thus, report it simply as the number of covenants for loans in which the loan agreement legally imposes any of the standard positive or negative covenants on the borrower. As expected, the average number of covenants in a PF loan arranged for a W.E. borrower (1.5) is significantly smaller than in a loan extended to U.S. borrowers (2.1). The type of legal system – common law in the U.S. and UK versus civil law in Continental Europe – can explain this, since civil law legal systems provide stronger creditor rights to lenders. In PF transactions, lenders rely upon the network of nonfinancial contracts as a mechanism to control agency costs and project risks (Corielli et al., 2010) and loan covenants are designed to protect the creditor mainly for asset substitution and other procedures of wealth expropriation by the borrower.
The observed level of upfront fees for the full sample is 82.1 bps. The mean levels of upfront fees for loans extended to U.S. borrowers (126.4 bps)
are significantly higher than the levels for W.E. loans (66.1 bps). This finding coupled with the fact that U.S. borrowers face higher spreads suggest that the total cost of borrowing in PF deals closed in the U.S. is significantly higher than that faced by W.E. borrowers.
5.9% of our U.S. loans sub-sample has fixed rates compared with only 2.2% of W.E. loans sub-sample, which means that in W.E., PF loans are more frequently closed with floating rates. Currency risk – a loan has currency risk if the denomination of the loan differs from the currency of the borrower’s home country – varies significantly between loans extended to U.S. borrowers and loans extended to borrowers located in W.E. Loans in U.S. deals are less likely to bear currency risk (3.6%) than loans closed to W.E. borrowers (11.2%). Given the non-U.S. nature of typical PF borrowers, coupled with the fact that syndicated loans are frequently dollar-denominated, this high level of currency risk is not surprising.
Perhaps the most significant difference between PF loans and other types of financing transactions (e.g.,
asset securitization or corporate bonds) is how infrequently PF loans are extended to financial institutions (only 0.8%). This makes sense, as banks are primarily lenders rather than sponsors in the PF market.
In short, our results indicate that the common pricing characteristics differ significantly in value between PF loans extended to U.S. versus W.E. borrowers. Our results are generally in line with those presented by Carey and Nini (2007). Additionally, our univariate analyses confirm that PF transactions are most commonly used for capital-intensive facilities and utilities with relatively transparent cash flows, in riskier than average countries, using relatively long-term financing.
Conclusion
Project finance (PF) is a form of financing based on a standalone entity created by the sponsors, with highly levered capital structures and concentrated equity and debt ownership. Being a nexus of contracts, it is also used to segregate the credit risk of the project from those of its sponsors so that lenders, investors, and other parties will appraise the project strictly on its own economic merits. The allocation of specific project risks to those parties best able to manage them is one of the key comparative advantages of PF.
This paper provides empirical evidence on the main contract characteristics of PF transactions and presents a comparative analysis between loans extended to U.S. borrowers with those arranged for borrowers located in W.E. Using a sample of 5,935 PF deals (10,950 PF loans) closed between 2000 and 2014, we find that PF lending increased 278.5% between 2000 ($68.7 billion) and 2014 ($259.9 billion). Our results show that PF lending is highly industry concentrated, with commercial & industrial, utilities, and transportation industries concentrating more than 70% of the total PF syndicated debt. We also conclude that the biggest recipients of PF lending are Western Europe (23.4%) and Eastern Asia (18.4%), whereas only 10.4% of PF lending goes to U.S. borrowers. The relevance of PF lending in Western Europe reflects, firstly, the emphasis placed by UK governments on the Private Finance Initiative and, secondly, the role played by Public-
Private Partnerships in reducing the need for government borrowing and shifting project risks to the private sector in Southern European countries. In short, our results show that PF transactions are most commonly used for capital-intensive facilities and utilities with relatively transparent cash flows, in riskier than average countries, using relatively long-term financing.
Univariate analysis shows that the common pricing characteristics differ significantly in value between PF loans extended to U.S. versus W.E. borrowers: loans extended to U.S. borrowers have a higher total cost of borrowing (spread and upfront fees) and have higher loan size to deal size ratios than loans arranged for borrowers located in W.E. On the contrary, loans closed in the U.S. have much shorter average maturity and are much less likely to be subject to currency risk and to be closed as term loans. The significant difference in contractual characteristics between the U.S. and W.E. sub-samples might be explained by differences in the type of financial system: market-based financial system in the U.S. and bank-based financial system in continental Europe. According to Foley and Greenwood (2010), shareholder protection and financial market development have been shown to influence the relative costs of different types of external financing and may, therefore, similarly affect the cost and the contractual characteristics of loans used in PF. The same idea is presented by Allen and Gale (1999), Demirgüç-Kunt and Levine (1999), and Chakraborty and Ray (2006), who argue that the way an economy mobilizes resources for investment, selecting investment projects to be funded, and providing incentives for the monitoring of the performance of the funded investments depends on the type of the financial system. Investigating the factors that can explain these differences is an important avenue for further research.
Acknowledgment
The author thanks Paulo Alves, Miguel Ferreira, Manuel Marques, Bill Megginson, Álvaro Nascimento, and Mário Santos for helpful comments on earlier drafts. A special word of appreciation is due to the Catholic University of Portugal for providing access to Dealscan database. References
1. Allen, F., and D. Gale. (1999). Comparing Financial Systems. MIT Press, Cambridge, MA.
2. Beale, C., M. Chatain, N. Fox, S. Bell, J. Berner, R. Preminger, and J. Prins. (2002). Credit Attributes of Project Finance. The Journal of Structured and Project Finance, 8(3), 5-9.
3. BIS. (2001). Working Paper on the Internal Ratings-Based Approach to Specialised Lending Exposures. BCBS Working Papers No 9, Bank of International Settlements.
4. Blanc-Brude, F., and R. Strange. (2007). How banks price loans to public private partnerships: Evidence from the European markets. Journal of Applied Corporate Finance, 19, 94-106.
5. Bonetti, V., S. Caselli, and S. Gatti. (2010). Offtaking agreements and how they impact the cost of funding for project finance deals: A clinical case study of the Quezon Power Ltd Co. Review of Financial Economics, 19, 60-71. 6. Brealey, R., I. Cooper, and M. Habib. (1996). Using project finance to fund infrastructure investments, Journal of
Applied Corporate Finance, 9, 25-38.
7. Buscaino, V., S. Caselli, F. Corielli, and S. Gatti. (2012). Project finance collateralised debt obligations: An empirical analysis of spread determinants. European Financial Management, 18, 950-969.
8. Carey, M., and G. Nini. (2007). Is the corporate loan market globally integrated? A pricing puzzle. Journal of Finance, 62, 2969-3007.
9. Caselli, S., and S. Gatti. (2005). Structured Finance: Techniques, Products and Market. Springer: Berlin.
10. Chakraborty, S., and T. Ray. (2006). Bank-based versus market-based financial systems: A growth-theoretic analysis. Journal of Monetary Economics, 53, 329-350.
11. Corielli, F., S. Gatti, and A. Steffanoni. (2010). Risk Shifting through Nonfinancial Contracts: Effects on Loan Spreads and Capital Structure of Project Finance Deals. Journal of Money, Credit and Banking, 42, 1295-1320. 12. Demirgüç-Kunt, A., and R. Levine. (1999). Financial structures across countries: stylized facts. Mimeograph,
World Bank, Washington, DC.
13. Esty, Benjamin. (2003). The Economic Motivations for Using Project Finance. Boston: Harvard Business School publishing.
14. Esty, Benjamin. (2004a). Modern Project Finance – A Casebook. John Wiley & Sons, Inc.
15. Esty, Benjamin. (2004b). Why Study Large Projects? An Introduction to Research on Project Finance. European Financial Management, 10, 213-224.
16. Esty, B., and A. Sesia. (2007). An Overview of Project Finance & Infrastructure Finance – 2006 Update. Boston: Harvard Business School publishing.
17. Esty, B., and W. Megginson. (2003). Creditor rights, enforcement, and debt ownership structure: Evidence from the global syndicated loan market. Journal of Financial and Quantitative Analysis, 38, 37-59.
18. Fabozzi, F., H. Davis, and M. Choudhry. (2006). Introduction to Structured Finance. Wiley Finance.
19. Foley, C., and R. Greenwood. (2010). The evolution of corporate ownership after IPO: the impact of investor protection. The Review of Financial Studies, 23, 1231-1260.
20. Gatti, Stefano. (2008). Project Finance in Theory and Practice – Designing, Structuring, and Financing Private and Public Projects. Academic Press Advanced Finance Series.
21. Gatti, S., S. Kleimeier, W. Megginson, and A. Steffanoni. (2013). Arranger Certification in Project Finance. Financial Management, 42, 1-40.
22. Kleimeier, S., and W. Megginson. (2000). Are project finance loans different from other syndicated credits? Journal of Applied Corporate Finance, 13, 75-87.
23. Klompjan, R., and M. Wouters. (2002). Default risk in project finance. Journal of Structured and Project Finance, 8, 10-21.
24. Nevitt, P., and F. Fabozzi. (2001). Project Financing. London: Euromoney, 7th Edition.
25. Pinto, J., and P. Alves. (2016). Project finance in Europe: An overview and discussion of key drivers. EIB Working Papers, No. 2016/04.
26. Sorge, M., and B. Gadanecz. (2008). The term structure of credit spreads in project finance. International Journal of Finance and Economics, 13, 68-81.
27. Standard & Poor’s. (2004). When Projects Fail: Ten Years of Project Finance Ratings. Global Project Finance Yearbook, London: Standard & Poor’s.