CERN-EP-2017-061 2017/11/13
CMS-SMP-16-011
Measurement of the triple-differential dijet cross section in
proton-proton collisions at
√
s
=
8 TeV and constraints on
parton distribution functions
The CMS Collaboration
∗Abstract
A measurement is presented of the triple-differential dijet cross section at a centre-of-mass energy of 8 TeV using 19.7 fb−1 of data collected with the CMS detector in proton-proton collisions at the LHC. The cross section is measured as a function of the average transverse momentum, half the rapidity separation, and the boost of the two leading jets in the event. The cross section is corrected for detector effects and com-pared to calculations in perturbative quantum chromodynamics at next-to-leading or-der accuracy, complemented with electroweak and nonperturbative corrections. New constraints on parton distribution functions are obtained and the inferred value of the strong coupling constant is αS(MZ) =0.1199 ±0.0015(exp)+−0.00310.0020(theo), where MZ is the mass of the Z boson.
Published in the European Physical Journal C as doi:10.1140/epjc/s10052-017-5286-7.
c
2017 CERN for the benefit of the CMS Collaboration. CC-BY-4.0 license
∗See Appendix A for the list of collaboration members
1
Introduction
The pairwise production of hadronic jets is one of the fundamental processes studied at hadron colliders. Dijet events with large transverse momenta can be described by parton-parton scat-tering in the context of quantum chromodynamics (QCD). Measurements of dijet cross sections can be used to thoroughly test predictions of perturbative QCD (pQCD) at high energies and to constrain parton distribution functions (PDFs). Previous measurements of dijet cross sections in proton-(anti)proton collisions have been performed as a function of dijet mass at the Sp ¯pS, ISR, and Tevatron colliders [1–6]. At the CERN LHC, dijet measurements as a function of dijet mass are reported in Refs. [7–11]. Also, dijet events have been studied triple-differentially in transverse energy and pseudorapidities η1and η2of the two leading jets [12, 13].
In this paper, a measurement of the triple-differential dijet cross section is presented as a func-tion of the average transverse momentum pT,avg = (pT,1+pT,2)/2 of the two leading jets, half of their rapidity separation y∗= |y1−y2|/2, and the boost of the dijet system yb= |y1+y2|/2. The dijet event topologies are illustrated in Fig. 1.
y ∗ = 1 |y 2 1 − y2 | yb = 12|y1+ y2| 0 1 2 3 0 1 2 3
Figure 1: Illustration of the dijet event topologies in the y∗ and yb kinematic plane. The dijet system can be classified as a same-side or opposite-side jet event according to the boost ybof the two leading jets, thereby providing insight into the parton kinematics.
The relation between the dijet rapidities and the parton momentum fractions x1,2of the incom-ing protons at leadincom-ing order (LO) is given by x1,2 = √pTs(e±y1 +e±y2), where pT = pT,1 = pT,2. For large values of yb, the momentum fractions carried by the incoming partons must corre-spond to one large and one small value, while for small ybthe momentum fractions must be approximately equal. In addition, for high transverse momenta of the jets, x values are probed above 0.1, where the proton PDFs are less precisely known.
The decomposition of the dijet cross section into the contributing partonic subprocesses is shown in Fig. 2 at next-to-leading order (NLO) accuracy, obtained using the NLOJET++ pro-gram version 4.1.3 [14, 15]. At small yband large pT,avga significant portion of the cross section
2 3 Event reconstruction and selection
corresponds to quark-quark (and small amounts of antiquark-antiquark) scattering with vary-ing shares of equal- or unequal-type quarks. In contrast, for large yb more than 80% of the cross section corresponds to partonic subprocesses with at least one gluon participating in the interaction. As a consequence, new information about the PDFs can be derived from the mea-surement of the triple-differential dijet cross section.
The data were collected with the CMS detector at√s=8 TeV and correspond to an integrated luminosity of 19.7 fb−1. The measured cross section is corrected for detector effects and is com-pared to NLO calculations in pQCD, complemented with electroweak (EW) and nonperturba-tive (NP) corrections. Furthermore, constraints on the PDFs are studied and the strong coupling constant αS(MZ)is inferred.
2
The CMS detector
The central feature of the CMS apparatus is a superconducting solenoid of 6 m internal diam-eter, providing a magnetic field of 3.8 T. Within the solenoid volume are a silicon pixel and strip tracker, a lead tungstate crystal electromagnetic calorimeter (ECAL), and a brass and scin-tillator hadron calorimeter (HCAL), each composed of a barrel and two endcap sections. The silicon tracker measures charged particles within the pseudorapidity range|η| <2.5. It consists
of 1440 silicon pixel and 15 148 silicon strip detector modules. The ECAL consists of 75 848 lead tungstate crystals, which provide coverage in pseudorapidity|η| < 1.48 in a barrel region and
1.48< |η| < 3.0 in two endcap regions. In the region|η| <1.74, the HCAL cells have widths
of 0.087 in pseudorapidity and 0.087 in azimuth (φ). In the η-φ plane, and for|η| < 1.48, the
HCAL cells map on to 5×5 arrays of ECAL crystals to form calorimeter towers projecting ra-dially outwards from close to the nominal interaction point. For|η| >1.74, the coverage of the
towers increases progressively to a maximum of 0.174 in ∆η and ∆φ. Within each tower, the energy deposits in ECAL and HCAL cells are summed to define the calorimeter tower energies, subsequently used to provide the energies and directions of hadronic jets. The forward hadron (HF) calorimeter extends the pseudorapidity coverage provided by the barrel and endcap de-tectors and uses steel as an absorber and quartz fibers as the sensitive material. The two halves of the HF are located 11.2 m from the interaction region, one on each end, and together they provide coverage in the range 3.0<|η| <5.2. Muons are measured in gas-ionisation detectors
embedded in the steel flux-return yoke outside the solenoid.
A more detailed description of the CMS detector, together with a definition of the coordinate system used and the relevant kinematic variables, can be found in Ref. [16].
3
Event reconstruction and selection
Dijet events are collected using five single-jet high-level triggers [17, 18], which require at least one jet with pT larger than 80, 140, 200, 260, and 320 GeV, respectively. At trigger level the jets are reconstructed with a simplified version of the particle-flow (PF) event reconstruction described in the following paragraph. All but the highest threshold trigger were prescaled in the 2012 LHC run. The triggers are employed in mutually exclusive regions of the pT,avg spectrum, cf. Table 1, in which their efficiency exceeds 99%.
The PF event algorithm reconstructs and identifies particle candidates with an optimised com-bination of information from the various elements of the CMS detector [19]. The energy of photons is directly obtained from the ECAL measurement, corrected for zero-suppression ef-fects. The energy of electrons is determined from a combination of the electron momentum at
1000 200 300 500 pT, avg [GeV] 0.0 0.2 0.4 0.6 0.8 1.0 Subprocess fraction 0 yb< 1 0 y*< 1 8 TeV gg jets gq jets (xg< xq) gq jets (xg> xq) qiqi jets
qiqj jets q qiiqqij jetsjets
1000 200 300 500 pT, avg [GeV] 0.0 0.2 0.4 0.6 0.8 1.0 Subprocess fraction 0 yb< 1 1 y*< 2 8 TeV gg jets gq jets (xg< xq) gq jets (xg> xq) qiqi jets
qiqj jets q qiiqqij jetsjets
200 300 500 pT, avg [GeV] 0.0 0.2 0.4 0.6 0.8 1.0 Subprocess fraction 0 yb< 1 2 y*< 3 8 TeV gg jets gq jets (xg< xq) gq jets (xg> xq) qiqi jets
qiqj jets q qiiqqij jetsjets
1000 200 300 500 pT, avg [GeV] 0.0 0.2 0.4 0.6 0.8 1.0 Subprocess fraction 1 yb< 2 0 y*< 1 8 TeV gg jets gq jets (xg< xq) gq jets (xg> xq) qiqi jets
qiqj jets q qiiqqij jetsjets
200 300 500 pT, avg [GeV] 0.0 0.2 0.4 0.6 0.8 1.0 Subprocess fraction 1 yb< 2 1 y*< 2 8 TeV gg jets gq jets (xg< xq) gq jets (xg> xq) qiqi jets
qiqj jets q qiiqqij jetsjets
200 300 pT, avg [GeV] 0.0 0.2 0.4 0.6 0.8 1.0 Subprocess fraction 2 yb< 3 0 y*< 1 8 TeV gg jets gq jets (xg< xq) gq jets (xg> xq) qiqi jets
qiqj jets q qiiqqij jetsjets
Figure 2: Relative contributions of all subprocesses to the total cross section at NLO as a func-tion of pT,avg in the various y∗ and yb bins. The subprocess contributions are grouped into seven categories according to the type of the incoming partons. The calculations have been performed with NLOJET++. The notation implies the sum over initial-state parton flavors as
well as interchanged quarks and antiquarks.
Table 1: List of single-jet trigger thresholds used in the analysis. Trigger threshold [ GeV] pT,avgrange [ GeV]
80 123–192
140 192–263
200 263–353
260 353–412
4 4 Measurement of the triple-differential dijet cross section
the primary interaction vertex as determined by the tracker, the energy of the corresponding ECAL cluster, and the energy sum of all bremsstrahlung photons spatially compatible with originating from the electron track. The energy of muons is obtained from the curvature of the corresponding track. The energy of charged hadrons is determined from a combination of their momentum measured in the tracker and the matching ECAL and HCAL energy deposits, cor-rected for zero-suppression effects and for the response function of the calorimeters to hadronic showers. Finally, the energy of neutral hadrons is obtained from the corresponding corrected ECAL and HCAL energies. The leading primary vertex (PV) is chosen as the one with the highest sum of squares of all associated track transverse momenta. The remaining vertices are classified as pileup vertices, which result from additional proton-proton collisions. To reduce the background caused by such additional collisions, charged hadrons within the coverage of the tracker,|η| <2.5 [20], that unambiguously originate from a pileup vertex are removed.
Hadronic jets are clustered from the reconstructed particles with the infrared- and collinear-safe anti-kT algorithm [21] with a jet size parameter R of 0.7, which is the default for CMS jet measurements. The jet momentum is determined as the vectorial sum of all particle momenta in the jet, and is found in the simulation to be within 5 to 10% of the true momentum over the whole pT range. Jet energy corrections (JEC) are derived from the simulation, and are con-firmed with in situ measurements of the energy balance of dijet, photon+jet, and Z boson+jet events [22, 23]. After applying the usual jet energy corrections, a small bias in the reconstructed pseudorapidity of the jets is observed at the edge of the tracker. An additional correction re-moves this effect.
All events are required to have at least one PV that must be reconstructed from four or more tracks. The longitudinal and transverse distances of the PV to the nominal interaction point of CMS must satisfy|zPV| <24 cm and ρPV<2 cm, respectively. Nonphysical jets are removed by loose jet identification criteria: each jet must contain at least two PF candidates, one of which is a charged hadron, and the jet energy fraction carried by neutral hadrons and photons must be less than 99%. These criteria remove less than 1% of genuine jets.
Only events with at least two jets up to an absolute rapidity of |y| = 5.0 are selected and the two jets leading in pT are required to have transverse momenta greater than 50 GeV and |y| < 3.0. The missing transverse momentum is defined as the negative vector sum of the transverse momenta of all PF candidates in the event. Its magnitude is referred to as pmissT . For consistency with previous jet measurements by CMS, pmissT is required to be smaller than 30% of the scalar sum of the transverse momenta of all PF candidates. For dijet events, which exhibit very little pTimbalance, the impact is practically negligible.
4
Measurement of the triple-differential dijet cross section
The triple-differential cross section for dijet production is defined as d3σ
dpT,avgdy∗dyb
= 1
eLeffint
N ∆pT,avg∆y∗∆yb
, where N denotes the number of dijet events within a given bin, Leff
int the effective integrated luminosity, and e the product of trigger and event selection efficiencies, which are greater than 99% in the phase space of the measurement. Contributions from background processes, such as tt production, are several orders of magnitude smaller and are neglected. The bin widths are ∆pT,avg,∆y∗, and∆yb.
The cross section is unfolded to the stable-particle level (lifetime cτ>1 cm) to correct for detec-tor resolution effects. The iterative D’Agostini algorithm with early stopping [24–26], as imple-mented in the ROOUNFOLDpackage [27], is employed for the unfolding. The response matrix,
which relates the particle-level distribution to the measured distribution at detector level, is derived using a forward smearing technique. An NLOJET++ prediction, obtained with CT14 PDFs [28] and corrected for NP and EW effects, is approximated by a continuous function to represent the distribution at particle level. Subsequently, pseudoevents are distributed uni-formly in pT,avgand weighted according to the theoretical prediction. These weighted events are smeared using the jet pTresolution to yield a response matrix and a prediction at detector level. By using large numbers of such pseudoevents, statistical fluctuations in the response matrix are strongly suppressed.
The jet energy (or pT) resolution (JER) is determined from the CMS detector simulation based on the GEANT4 toolkit [29] and thePYTHIA6.4 Monte Carlo (MC) event generator [30] and is corrected for residual differences between data and simulation following Ref. [23]. The rapidity dependence of both the JER from simulation and of the residual differences have been taken into account. The Gaussian pT resolution in the interval |y| < 1 is about 8% at 100 GeV and improves to 5% at 1 TeV. Non-Gaussian tails in the JER, exhibited for jet rapidities close to
|y| =3, are included in a corresponding uncertainty.
The regularisation strength of the iterative unfolding procedure is defined through the number of iterations, whose optimal value is determined by performing a χ2test between the original measured data and the unfolded data after smearing with the response matrix. The values ob-tained for χ2per number of degrees of freedom, ndof, in these comparisons approach unity in four iterations and thereafter decrease slowly for additional iterations. The optimal number of iterations is therefore determined to be four. The procedure is in agreement with the criteria of Ref. [31]. The response matrices derived in this manner for each bin in y∗and ybare nearly diagonal. A cross check using thePYTHIA6 MC event generator as theory and the detector
sim-ulation to construct the response matrices revealed no discrepancies compared to the baseline result.
Migrations into and out of the accepted phase space in y∗and ybor between bins happen only at a level below 5%. The net effect of these migrations has been included in the respective response matrices and has been cross checked successfully using a 3-dimensional unfolding. As a consequence of these migrations, small statistical correlations between neighbouring bins of the unfolded cross sections are introduced during the unfolding procedure. The statistical uncertainties after being propagated through the unfolding are smaller than 1% in the majority of the phase space, and amount up to 20% for highest pT,avg.
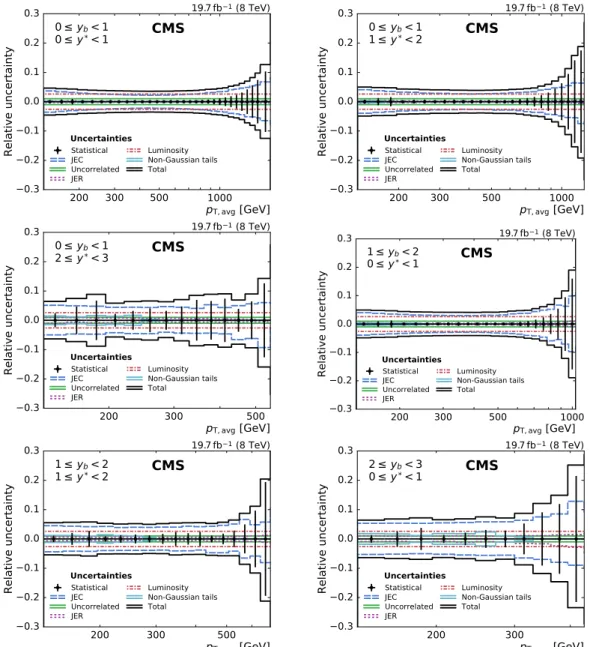
The dominant systematic uncertainties in the cross section measurement arise from uncertain-ties in the JEC. Summing up quadratically all JEC uncertainuncertain-ties according to the prescription given in Ref. [23], the total JEC uncertainty amounts to about 2.5% in the central region and increases to 12% in the forward regions. The 2.6% uncertainty in the integrated luminosity [32] is directly propagated to the cross section. The uncertainty in the JER enters the measurement through the unfolding procedure and results in an additional uncertainty of 1% to 2% of the unfolded cross section. Non-Gaussian tails in the detector response to jets near |y| = 3.0, the maximal absolute rapidity considered in this measurement, are responsible for an additional uncertainty of up to 2%. Residual effects of small inefficiencies in the jet identification and trigger selection are covered by an uncorrelated uncertainty of 1% [11]. The total systematic experimental uncertainty ranges from about 3 to 8% in the central detector region and up to 12% for absolute rapidities near the selection limit of 3.0. Figure 3 depicts all experimental
un-6 5 Theoretical predictions
certainties as well as the total uncertainty, which is calculated as the quadratic sum of all the contributions from the individual sources.
1000 200 300 500 pT, avg [GeV] 0.3 0.2 0.1 0.0 0.1 0.2 0.3 Relative uncertainty 0 yb< 1 0 y*< 1
CMS
Uncertainties 19.7fb1 (8 TeV) Statistical JEC Uncorrelated JER Luminosity Non-Gaussian tails Total 1000 200 300 500 pT, avg [GeV] 0.3 0.2 0.1 0.0 0.1 0.2 0.3 Relative uncertainty 0 yb< 1 1 y*< 2CMS
Uncertainties 19.7fb 1 (8 TeV) Statistical JEC Uncorrelated JER Luminosity Non-Gaussian tails Total 200 300 500 pT, avg [GeV] 0.3 0.2 0.1 0.0 0.1 0.2 0.3 Relative uncertainty 0 yb< 1 2 y*< 3CMS
Uncertainties 19.7fb1 (8 TeV) Statistical JEC Uncorrelated JER Luminosity Non-Gaussian tails Total 1000 200 300 500 pT, avg [GeV] 0.3 0.2 0.1 0.0 0.1 0.2 0.3 Relative uncertainty 1 yb< 2 0 y*< 1CMS
Uncertainties 19.7fb1 (8 TeV) Statistical JEC Uncorrelated JER Luminosity Non-Gaussian tails Total 200 300 500 pT, avg [GeV] 0.3 0.2 0.1 0.0 0.1 0.2 0.3 Relative uncertainty 1 yb< 2 1 y*< 2CMS
Uncertainties 19.7fb1 (8 TeV) Statistical JEC Uncorrelated JER Luminosity Non-Gaussian tails Total 200 300 pT, avg [GeV] 0.3 0.2 0.1 0.0 0.1 0.2 0.3 Relative uncertainty 2 yb< 3 0 y*< 1CMS
Uncertainties 19.7fb 1 (8 TeV) Statistical JEC Uncorrelated JER Luminosity Non-Gaussian tails TotalFigure 3: Overview of all experimental uncertainties affecting the cross section measurement in six bins of yband y∗. The error bars indicate the statistical uncertainty after unfolding. The dif-ferent lines show the uncertainties resulting from jet energy corrections, jet energy resolution, integrated luminosity, non-Gaussian tails in the resolution, and from residual effects included in the uncorrelated uncertainty. The total uncertainty is obtained by adding all uncertainties in quadrature.
5
Theoretical predictions
The NLO predictions for the triple-differential dijet cross section are calculated using NLO-JET++ within the framework ofFASTNLO version 2.1 [33, 34]. The renormalisation and
factori-sation scales µr and µfare both set to µ = µ0 = pT,max·e0.3y∗, a scale choice first investigated in Ref. [35]. The variation of these scales by constant factors as described below is convention-ally used to estimate the effect of missing higher orders. The scale uncertainty is reduced in
regions with large values of ybwith the above-mentioned choice for µ0compared to a predic-tion with µ0 = pT,avg. The predictions for cross sections obtained with different central scale choices are compatible within the scale uncertainties. The calculation is performed using the PDF sets CT14, ABM11 [36], MMHT2014 [37], and NNPDF 3.0 [38] at next-to-leading evolution order, which are accessed via the LHAPDF 6.1.6 interface [39, 40] using the respective values of αS(MZ)and the supplied αSevolution. The size of the NLO correction is shown in Fig. 4 top left and varies between+10% and+30% at high pT,avgand low yb.
The fixed-order calculations are accompanied by NP corrections, cNPk , derived from the LO MC event generatorsPYTHIA 8.185 [41] and HERWIG++ 2.7.0 [42] with the tunes CUETP8M1 [43] and UE-EE-5C [44], respectively, and the NLO MC generatorPOWHEG[45–48] in combination
withPYTHIA8 and the tunes CUETP8M1 and CUETP8S1 [43].
The correction factor cNP
k is defined as the ratio between the nominal cross section with and without multiple parton interactions (MPI) and hadronisation (HAD) effects
cNPk = σ
PS+HAD+MPI k
σkPS ,
where the superscript indicates the steps in the simulation: the parton shower (PS), the MPI, and the hadronisation. The corresponding correction factor, as displayed in Fig. 4 bottom, is applied in each bin k to the parton-level NLO cross section. It differs from unity by about+10% for lowest pT,avgand becomes negligible above 1 TeV.
To account for differences among the correction factors obtained by using HERWIG++,
PYTHIA8, andPOWHEG+PYTHIA8, half of the envelope of all these predictions is taken as the
uncertainty and the centre of the envelope is used as the central correction factor.
The contribution from EW effects, which arise mainly from virtual exchanges of massive W and Z bosons, is relevant at high jet pTand central rapidities [49, 50]. These corrections, shown in Fig. 4 top right, are smaller than 3% below 1 TeV and reach 8% for the highest pT,avg. Theoretical uncertainties in this correction due to its renormalisation scheme and indirect PDF dependence are considered to be negligible.
The total theoretical uncertainty is obtained as the quadratic sum of NP, scale, and PDF uncer-tainties. The scale uncertainties are calculated by varying µrand µfusing multiplicative factors in the following six combinations: (µr/µ0, µf/µ0) = (1/2, 1/2),(1/2, 1),(1, 1/2),(1, 2),(2, 1), and(2, 2). The uncertainty is determined as the maximal upwards and downwards variation with respect to the cross section obtained with the nominal scale setting [51, 52]. The PDF un-certainties are evaluated according to the NNPDF 3.0 prescription as the standard deviation from the average prediction. Figure 5 shows the relative size of the theoretical uncertainties for the phase-space regions studied. The scale uncertainty dominates in the low-pT,avgregion. At high pT,avg, and especially in the boosted region, the PDFs become the dominant source of uncertainty. In total, the theoretical uncertainty increases from about 2% at low pT,avgto at least 10% and up to more than 30% for the highest accessed transverse momenta and rapidities.
6
Results
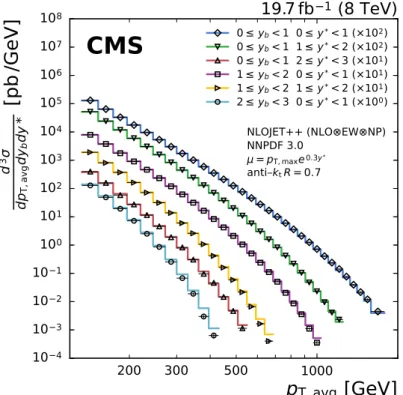
The triple-differential dijet cross section is presented in Fig. 6 as a function of pT,avg for six phase-space regions in y∗and yb. The theoretical predictions are found to be compatible with the unfolded cross section over a wide range of the investigated phase space.
8 6 Results
1000
200 300 500
pT, avg [GeV]
0.9
1.0
1.1
1.2
1.3
1.4
1.5
NL O/
LO8 TeV
0 yb< 1 0 y*< 1 0 yb< 1 1 y*< 2 0 yb< 1 2 y*< 3 1 yb< 2 0 y*< 1 1 yb< 2 1 y*< 2 2 yb< 3 0 y*< 11000
200 300 500
p
T, avg[GeV]
0.95
1.00
1.05
1.10
1.15
Relative electroweak correction
8 TeV
Dittmaier, Huss, Speckner [JHEP 1211 (2012) 095] 0 yb< 1 0 y*< 1 0 yb< 1 1 y*< 2 0 yb< 1 2 y*< 3 1 yb< 2 0 y*< 1 1 yb< 2 1 y*< 2 2 yb< 3 0 y*< 1
1000
200 300 500
p
T, avg[GeV]
1.00
1.02
1.04
1.06
1.08
1.10
1.12
NP correction
8 TeV
CMS
Simulation 0 yb< 1 0 y*< 1 0 yb< 1 1 y*< 2 0 yb< 1 2 y*< 3 1 yb< 2 0 y*< 1 1 yb< 2 1 y*< 2 2 yb< 3 0 y*< 1Figure 4: Overview of the theoretical correction factors. For each of the six analysis bins the NLO QCD (top left), the electroweak (top right), and the NP correction factor (bottom) are shown as a function of pT,avg. The NLO QCD correction has been derived with the same NLO PDF in numerator and denominator and is included in the NLO prediction by NLOJET++.
1000 200 300 500 pT, avg [GeV] 0.3 0.2 0.1 0.0 0.1 0.2 0.3 Relative uncertainty 0 yb< 1 0 y*< 1 NNPDF 3.0-NLO
CMS
Simulation Uncertainties 8 TeV Total PDF ScaleNP 1000 200 300 500 pT, avg [GeV] 0.3 0.2 0.1 0.0 0.1 0.2 0.3 Relative uncertainty 0 yb< 1 1 y*< 2 NNPDF 3.0-NLOCMS
Simulation Uncertainties 8 TeV Total PDF ScaleNP 200 300 500 pT, avg [GeV] 0.3 0.2 0.1 0.0 0.1 0.2 0.3 Relative uncertainty 0 yb< 1 2 y*< 3 NNPDF 3.0-NLOCMS
Simulation Uncertainties 8 TeV Total PDF ScaleNP 1000 200 300 500 pT, avg [GeV] 0.3 0.2 0.1 0.0 0.1 0.2 0.3 Relative uncertainty 1 yb< 2 0 y*< 1 NNPDF 3.0-NLOCMS
Simulation Uncertainties 8 TeV Total PDF ScaleNP 200 300 500 pT, avg [GeV] 0.3 0.2 0.1 0.0 0.1 0.2 0.3 Relative uncertainty 1 yb< 2 1 y*< 2 NNPDF 3.0-NLOCMS
Simulation Uncertainties 8 TeV Total PDF ScaleNP 200 300 pT, avg [GeV] 0.3 0.2 0.1 0.0 0.1 0.2 0.3 Relative uncertainty 2 yb< 3 0 y*< 1 NNPDF 3.0-NLOCMS
Simulation Uncertainties 8 TeV Total PDF ScaleNPFigure 5: Overview of the theoretical uncertainties. The scale uncertainty dominates in the low-pT,avg region. At high pT,avg, and especially in the boosted region, the PDFs become the dominant source of uncertainty.
10 6 Results
1000
200 300
500
p
T, avg
[GeV]
10
410
310
210
110
010
110
210
310
410
510
610
710
8d
3dp
T, av gdy
bdy
*
[p
b/
Ge
V]
19.7fb
1
(8 TeV)
NLOJET++ (NLO EW NP) NNPDF 3.0 = pT, maxe0.3y* anti ktR = 0.7CMS
0 yb< 1 0 y*< 1 (×102) 0 yb< 1 1 y*< 2 (×102) 0 yb< 1 2 y*< 3 (×101) 1 yb< 2 0 y*< 1 (×101) 1 yb< 2 1 y*< 2 (×101) 2 yb< 3 0 y*< 1 (×100)Figure 6: The triple-differential dijet cross section in six bins of y∗and yb. The data are indicated by different markers for each bin. The theoretical predictions, obtained with NLOJET++ and NNPDF 3.0, and complemented with EW and NP corrections, are depicted by solid lines. Apart from the boosted region, the data are well described by the predictions at NLO accuracy over many orders of magnitude.
The ratios of the measured cross section to the theoretical predictions from various global PDF sets are shown in Fig. 7. The data are well described by the predictions using the CT14, MMHT 2014, and NNPDF 3.0 PDF sets in most of the analysed phase space. In the boosted re-gions (yb≥ 1) differences between data and predictions are observed at high pT,avg, where the less known high-x region of the PDFs is probed. In this boosted dijet topology, the predictions exhibit large PDF uncertainties, as can be seen in Fig. 5. The significantly smaller uncertainties of the data in that region indicate their potential to constrain the PDFs.
Predictions using the ABM 11 PDFs systematically underestimate the data for yb < 2.0. This behavior has been observed previously [53] and can be traced back to a soft gluon PDF accom-panied with a low value of αS(MZ).
Figure 8 presents the ratios of the data to the predictions of thePOWHEG+PYTHIA8 andHER
-WIG7.0.3 [54] NLO MC event generators. Significant differences between the predictions from both MC event generators are observed. However, the scale definitions and the PDF sets are different. ForPOWHEG and HERWIG7 the CT10 and MMHT 2014 PDF sets are used, respec-tively. In general, HERWIG7 describes the data better in the central region whereas POWHEG
prevails in the boosted region.
7
PDF constraints and determination of the strong coupling
con-stant
The constraints of the triple-differential dijet measurement on the proton PDFs are demon-strated by including the cross section in a PDF fit with inclusive measurements of deep-inelastic scattering (DIS) from the H1 and ZEUS experiments at the HERA collider [55]. The fit is per-formed with the open-source fitting frameworkXFITTERversion 1.2.2 [56]. The PDF evolution
is based on the Dokshitzer–Gribov–Lipatov–Altarelli–Parisi (DGLAP) evolution equations [57– 59] as implemented in the QCDNUM 17.01.12 package [60]. To ensure consistency between the HERA DIS and the dijet cross section calculations, the fits are performed at NLO.
The analysis is based on similar studies of inclusive jet data at 7 TeV [53] and 8 TeV [61] and all settings were chosen in accordance to the inclusive jet study at 8 TeV [61]. The parameterisation of the PDFs is defined at the starting scale Q20 = 1.9 GeV2. The five independent PDFs xuv(x), xdv(x), xg(x), xU(x), and xD(x)represent the u and d valence quarks, the gluon, and the up-and down-type sea quarks up-and are parameterised as follows:
xg(x) = AgxBg(1−x)Cg−A0gxB 0 g(1−x)C0g, (1) xuv(x) = Auvx Buv(1−x)Cuv(1+D uvx+Euvx 2), (2) xdv(x) = Advx Bdv(1−x)Cdv(1+D dvx), (3) xU(x) = AUxBU(1−x)CU(1+D Ux), (4) xD(x) = ADxBD(1−x)CD, (5) where xU(x) =xu(x), and xD(x) =xd(x) +xs(x).
In these equations, the normalisation parameters Ag, Auv, and Adv are fixed using QCD sum
rules. The constraints BU = BD and AU = AD(1− fs) are imposed to ensure the same nor-malisation for the U and D PDF for the x → 0 region. The strange quark PDF is defined to be a fixed fraction fs = 0.31 of xD(x). The generalised-mass variable-flavour number scheme as described in [62, 63] is used and the strong coupling constant is set to αS(MZ) =0.1180. The set of parameters in Eqs. (1)–(5) is chosen by first performing a fit where all D and E parameters
12 7 PDF constraints and determination of the strong coupling constant 1000 200 300 500
p
T, avg[GeV]
0.4 0.6 0.8 1.0 1.2 1.4 1.6Ra
tio
to
N
NP
DF
3
.0
N
LO
EW
NP
0 y
b< 1
0 y
*< 1
CMS
19.7fb 1 (8 TeV) Data Experimental uncertainty Theoretical uncertainty CT14 NLO EW NP MMHT 2014 NLO EW NP ABM11 NLO EW NP 1000 200 300 500p
T, avg[GeV]
0.4 0.6 0.8 1.0 1.2 1.4 1.6Ra
tio
to
N
NP
DF
3
.0
N
LO
EW
NP
0 y
b< 1
1 y
*< 2
CMS
19.7fb 1 (8 TeV) Data Experimental uncertainty Theoretical uncertainty CT14 NLO EW NP MMHT 2014 NLO EW NP ABM11 NLO EW NP 200 300 500p
T, avg[GeV]
0.4 0.6 0.8 1.0 1.2 1.4 1.6Ra
tio
to
N
NP
DF
3
.0
N
LO
EW
NP
0 y
b< 1
2 y
*< 3
CMS
19.7fb 1 (8 TeV) Data Experimental uncertainty Theoretical uncertainty CT14 NLO EW NP MMHT 2014 NLO EW NP ABM11 NLO EW NP 1000 200 300 500 pT, avg [GeV] 0.4 0.6 0.8 1.0 1.2 1.4 1.6 Ra tio to N NP DF 3 .0 N LO EW NP 1 yb< 2 0 y*< 1CMS
19.7fb 1 (8 TeV) Data Experimental uncertainty Theoretical uncertainty CT14 NLO EW NP MMHT 2014 NLO EW NP ABM11 NLO EW NP 200 300 500p
T, avg[GeV]
0.4 0.6 0.8 1.0 1.2 1.4 1.6Ra
tio
to
N
NP
DF
3
.0
N
LO
EW
NP
1 y
b< 2
1 y
*< 2
CMS
19.7fb 1 (8 TeV) Data Experimental uncertainty Theoretical uncertainty CT14 NLO EW NP MMHT 2014 NLO EW NP ABM11 NLO EW NP 200 300p
T, avg[GeV]
0.4 0.6 0.8 1.0 1.2 1.4 1.6Ra
tio
to
N
NP
DF
3
.0
N
LO
EW
NP
2 y
b< 3
0 y
*< 1
CMS
19.7fb 1 (8 TeV) Data Experimental uncertainty Theoretical uncertainty CT14 NLO EW NP MMHT 2014 NLO EW NP ABM11 NLO EW NPFigure 7: Ratio of the triple-differential dijet cross section to the NLOJET++ prediction using
the NNPDF 3.0 set. The data points including statistical uncertainties are indicated by markers, the systematic experimental uncertainty is represented by the hatched band. The solid band shows the PDF, scale, and NP uncertainties quadratically added; the solid and dashed lines give the ratios calculated with the predictions for different PDF sets.
1000 200 300 500
p
T, avg[GeV]
0.4 0.6 0.8 1.0 1.2 1.4 1.6Ra
tio
to
N
NP
DF
3
.0
N
LO
EW
NP
0 y
b< 1
0 y
*< 1
CMS
19.7fb 1 (8 TeV) Data Experimental uncertainty Theoretical uncertaintyPOWHEG+PYTHIA8 NLO EW = pTborn
HERWIG7 NLO EW = pT, max
1000 200 300 500
p
T, avg[GeV]
0.4 0.6 0.8 1.0 1.2 1.4 1.6Ra
tio
to
N
NP
DF
3
.0
N
LO
EW
NP
0 y
b< 1
1 y
*< 2
CMS
19.7fb 1 (8 TeV) Data Experimental uncertainty Theoretical uncertaintyPOWHEG+PYTHIA8 NLO EW = pTborn
HERWIG7 NLO EW = pT, max
200 300 500
p
T, avg[GeV]
0.4 0.6 0.8 1.0 1.2 1.4 1.6Ra
tio
to
N
NP
DF
3
.0
N
LO
EW
NP
0 y
b< 1
2 y
*< 3
CMS
19.7fb 1 (8 TeV) Data Experimental uncertainty Theoretical uncertaintyPOWHEG+PYTHIA8 NLO EW = pTborn
HERWIG7 NLO EW = pT, max
1000 200 300 500 pT, avg [GeV] 0.4 0.6 0.8 1.0 1.2 1.4 1.6 Ra tio to N NP DF 3 .0 N LO EW NP 1 yb< 2 0 y*< 1
CMS
19.7fb 1 (8 TeV) Data Experimental uncertainty Theoretical uncertaintyPOWHEG+PYTHIA8 NLO EW = pTborn
HERWIG7 NLO EW = pT, max
200 300 500
p
T, avg[GeV]
0.4 0.6 0.8 1.0 1.2 1.4 1.6Ra
tio
to
N
NP
DF
3
.0
N
LO
EW
NP
1 y
b< 2
1 y
*< 2
CMS
19.7fb 1 (8 TeV) Data Experimental uncertainty Theoretical uncertaintyPOWHEG+PYTHIA8 NLO EW = pTborn
HERWIG7 NLO EW = pT, max
200 300
p
T, avg[GeV]
0.4 0.6 0.8 1.0 1.2 1.4 1.6Ra
tio
to
N
NP
DF
3
.0
N
LO
EW
NP
2 y
b< 3
0 y
*< 1
CMS
19.7fb 1 (8 TeV) Data Experimental uncertainty Theoretical uncertaintyPOWHEG+PYTHIA8 NLO EW = pTborn
HERWIG7 NLO EW = pT, max
Figure 8: Ratio of the triple-differential dijet cross section to the NLOJET++ prediction using
the NNPDF 3.0 set. The data points including statistical uncertainties are indicated by markers, the systematic experimental uncertainty is represented by the hatched band. The solid band shows the PDF, scale, and NP uncertainties quadratically added. The predictions of the NLO MC event generatorsPOWHEG+PYTHIA8 andHERWIG7 are depicted by solid and dashed lines, respectively.
14 7 PDF constraints and determination of the strong coupling constant
are set to zero. Further parameters are included into this set one at a time. The improvement of χ2 of the fit is monitored and the procedure is stopped when no further improvement is observed. This leads to a 16-parameter fit. Due to differences in the sensitivity of the various PDFs to dijet and inclusive jet data, the parameterisation of the present analysis differs from that in Ref. [61]. In particular, the constraint Bdv = Buv at the starting scale has been released.
This results in a d valence quark distribution consistent with the results obtained in Ref. [61] and in a similar CMS analysis of muon charge asymmetry in W boson production at 8 TeV [64]. The PDF uncertainties are determined using the HERAPDF method [55, 56] with uncertainties subdivided into the three categories of experimental, model, and parameterisation uncertainty, which are evaluated separately and added in quadrature to obtain the total PDF uncertainty. Experimental uncertainties originate from statistical and systematic uncertainties in the data and are propagated to the PDFs using the Hessian eigenvector method [65] and a tolerance criterion of ∆χ2 = +1. Alternatively, the Monte Carlo method [66] is used to determine the PDF fit uncertainties and similar results are obtained.
The uncertainties in several input parameters in the PDF fits are combined into one model uncertainty. For the evaluation of the model uncertainties some variations on the input pa-rameters are considered. The strangeness fraction is chosen in agreement with Refs. [67] to be fs = 0.31 and is varied between 0.23 and 0.39. Following Ref. [55], the b quark mass, set to 4.5 GeV, is varied between 4.25 and 4.75 GeV. Similarly, the c quark mass, set by de-fault to 1.47 GeV, is varied between 1.41 and 1.53 GeV. The minimum Q2 imposed on the HERA DIS data is set in accordance with the CMS inclusive jet analysis described in [53] to Q2min =7.5 GeV2, and is varied between Q2min =5.0 GeV2and 10.0 GeV2.
The parameterisation uncertainty is estimated by including additional parameters in the fit, leading to a more flexible functional form of the PDFs. Each parameter is successively added in the PDF fit, and the envelope of all changes to the central PDF fit result is taken as parameter-isation uncertainty. The increased flexibility of the PDFs while estimating the parameterparameter-isation uncertainty may lead to the seemingly paradoxical effect that, although new data are included, the total uncertainty can increase in regions, where direct constraints from data are absent. This may happen at very low or at very high x, where the PDF is determined through extrapolation alone. Furthermore, the variation of the starting scale Q20to 1.6 and 2.2 GeV2is considered in this parameterisation uncertainty.
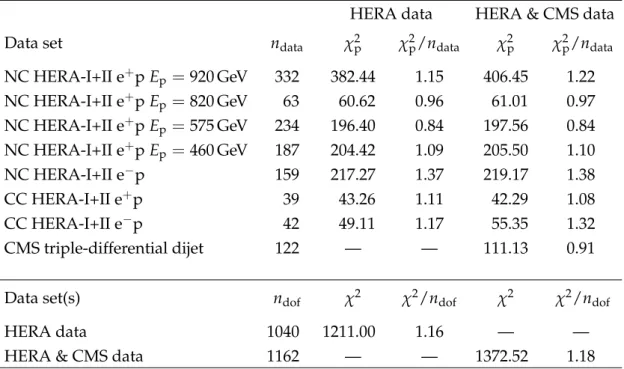
The quality of the resulting PDF fit with and without the dijet measurement is reported in Table 2. The partial χ2 per data point for each data set as well as the χ2/ndoffor all data sets demonstrate the compatibility of the CMS dijet measurement and the DIS data from the H1 and ZEUS experiments in a combined fit.
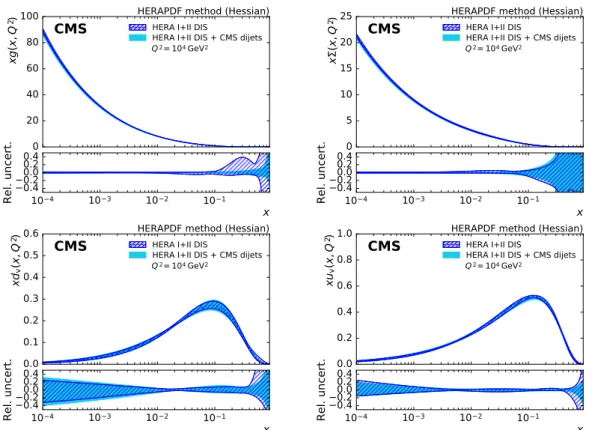
The PDFs obtained for the gluon, u valence, d valence, and sea quarks are presented for a fit with and without the CMS dijet data in Fig. 9 for Q2= 104GeV2. The uncertainty in the gluon PDF is reduced over a large range in x with the largest impact in the high-x region, where some reduction in uncertainty can also be observed for the valence quark and the sea quark PDFs. For x values beyond ≈0.7 or below 10−3, the extracted PDFs are not directly constrained by data and should be considered as extrapolations that rely on PDF parameterisation assumptions alone.
The improvement in the uncertainty of the gluon PDF is accompanied by a noticeable change in shape, which is most visible when evolved to low scales as shown in Fig. 10. Compared to the fit with HERA DIS data alone, the gluon PDF shrinks at medium x and increases at high x. A similar effect has been observed before, e.g. in Ref. [53].
Table 2: The partial χ2(χ2p) for each data set in the HERA DIS (middle section) or the combined fit including the CMS triple-differential dijet data (right section) are shown. The bottom two lines show the total χ2and χ2/ndof. The difference between the sum of all χ2p and the total χ2 for the combined fit is attributed to the nuisance parameters.
HERA data HERA & CMS data Data set ndata χ2p χ2p/ndata χ2p χ2p/ndata NC HERA-I+II e+p Ep=920 GeV 332 382.44 1.15 406.45 1.22 NC HERA-I+II e+p Ep=820 GeV 63 60.62 0.96 61.01 0.97 NC HERA-I+II e+p Ep=575 GeV 234 196.40 0.84 197.56 0.84 NC HERA-I+II e+p Ep=460 GeV 187 204.42 1.09 205.50 1.10 NC HERA-I+II e−p 159 217.27 1.37 219.17 1.38 CC HERA-I+II e+p 39 43.26 1.11 42.29 1.08 CC HERA-I+II e−p 42 49.11 1.17 55.35 1.32 CMS triple-differential dijet 122 — — 111.13 0.91
Data set(s) ndof χ2 χ2/ndof χ2 χ2/ndof
HERA data 1040 1211.00 1.16 — —
HERA & CMS data 1162 — — 1372.52 1.18
The PDFs are compared in Fig. 11 to those obtained with inclusive jet data at√s = 8 TeV [61]. The shapes of the PDFs and the uncertainties are similar. Somewhat larger uncertainties in the valence quark distributions are observed in the fit using the dijet data with respect to those obtained from the inclusive jet cross section. This behaviour can be explained by a stronger sensitivity of the dijet data to the light quark distributions, resulting in an increased flexibility of the PDF parameterisation, however, at the cost of an increased uncertainty.
The measurement of the triple-differential dijet cross section not only provides constraints on the PDFs, but also on the strong coupling constant. Therefore, the PDF fit is repeated with an additional free parameter: the strong coupling constant αS(MZ). The value obtained for the strong coupling constant is
αS(MZ) =0.1199 ± 0.0015(exp)−+0.00020.0002(mod)+−0.00020.0004(par),
where the quoted experimental (exp) uncertainty accounts for all sources of uncertainties in the HERA and CMS data sets, as well as the NP uncertainties. The model (mod) and parame-terisation (par) uncertainties are evaluated in the same way as in the PDF determination. The consideration of scale uncertainties in a global PDF fit is an open issue in the PDF community because it is unclear how to deal with the correlations in scale settings among the different measurements and observables. Therefore they are not taken into account in any global PDF fit up to now, although an elaborate study of the effect of scale settings on dijet cross sections has been performed in Ref. [68], which also reports first combined PDF and αS(MZ)fits us-ing LHC inclusive jet data. Followus-ing Ref. [53], where the final uncertainties and correlations of CMS inclusive jet data at 7 TeV are used in such combined fits, two different methods to evaluate the scale uncertainty of the jet cross section on αS(MZ)are studied. First, the renor-malisation and factorisation scales are varied in the calculation of the dijet predictions. The fit is repeated for each variation. The uncertainty is evaluated as detailed in Section 5 and yields ∆αS(MZ) =+−0.00260.0016(scale, refit).
16 7 PDF constraints and determination of the strong coupling constant 0 20 40 60 80 100 xg (x ,Q
2) HERAPDF method (Hessian)
Q2= 104GeV2
CMS
HERA I+II DISHERA I+II DIS + CMS dijets
10 4 10 3 10 2 10 1 x 0.4 0.2 0.0 0.2 0.4 Rel. uncert. 0 5 10 15 20 25 x (x ,Q
2) HERAPDF method (Hessian)
Q2= 104GeV2
CMS
HERA I+II DISHERA I+II DIS + CMS dijets
10 4 10 3 10 2 10 1 x 0.4 0.2 0.0 0.2 0.4 Rel. uncert. 0.0 0.1 0.2 0.3 0.4 0.5 0.6 xdv (x ,Q
2) HERAPDF method (Hessian)
Q2= 104GeV2
CMS
HERA I+II DISHERA I+II DIS + CMS dijets
10 4 10 3 10 2 10 1 x 0.4 0.2 0.0 0.2 0.4 Rel. uncert. 0.0 0.2 0.4 0.6 0.8 1.0 xuv (x ,Q
2) HERAPDF method (Hessian)
Q2= 104GeV2
CMS
HERA I+II DISHERA I+II DIS + CMS dijets
10 4 10 3 10 2 10 1 x 0.4 0.2 0.0 0.2 0.4 Rel. uncert.
Figure 9: The gluon (top left), sea quark (top right), d valence quark (bottom left), and u valence quark (bottom right) PDFs as a function of x as derived from HERA inclusive DIS data alone (hatched band) and in combination with CMS dijet data (solid band). The PDFs are shown at the scale Q2 =104GeV2with their total uncertainties.
0.0 0.5 1.0 1.5 2.0 2.5 3.0 3.5 4.0 xg (x ,Q
2) HERAPDF method (Hessian)
Q2= 1.9GeV2
CMS
HERA I+II DISHERA I+II DIS + CMS dijets
10 4 10 3 10 2 10 1 x 0.4 0.2 0.0 0.2 0.4 Rel. uncert.
Figure 10: The gluon PDF as a function of x as derived from HERA inclusive DIS data alone (hatched band) and in combination with CMS dijet data (solid band). The PDF and its total uncertainty are shown at the starting scale Q2=1.9 GeV2of the PDF evolution.
0 10 20 30 40 50 60 70 80 90 xg (x ,Q
2) HERAPDF method (Hessian)
Q2= 104GeV2
CMS
HERA I+II DIS + CMS dijetsHERA I+II DIS + CMS inc. jets
10 4 10 3 10 2 10 1 x 0.4 0.2 0.0 0.2 0.4 Rel. uncert. 0 5 10 15 20 25 x (x ,Q
2) HERAPDF method (Hessian)
Q2= 104GeV2
CMS
HERA I+II DIS + CMS dijetsHERA I+II DIS + CMS inc. jets
10 4 10 3 10 2 10 1 x 0.4 0.2 0.0 0.2 0.4 Rel. uncert. 0.0 0.1 0.2 0.3 0.4 0.5 0.6 xdv (x ,Q
2) HERAPDF method (Hessian)
Q2= 104GeV2
CMS
HERA I+II DIS + CMS dijetsHERA I+II DIS + CMS inc. jets
10 4 10 3 10 2 10 1 x 0.4 0.2 0.0 0.2 0.4 Rel. uncert. 0.0 0.2 0.4 0.6 0.8 1.0 xuv (x ,Q
2) HERAPDF method (Hessian)
Q2= 104GeV2
CMS
HERA I+II DIS + CMS dijetsHERA I+II DIS + CMS inc. jets
10 4 10 3 10 2 10 1 x 0.4 0.2 0.0 0.2 0.4 Rel. uncert.
Figure 11: The gluon (top left), sea quark (top right), d valence quark (bottom left), and u va-lence quark (bottom right) PDFs as a function of x as derived from a fit of HERA inclusive DIS data in combination with CMS inclusive jet data (solid band) and CMS dijet data (hatched band) at 8 TeV. The PDFs are shown at the scale Q2 =104GeV2with their total uncertainties.
18 8 Summary
The second procedure is analogous to the method applied by CMS in previous determinations of αS(MZ)without simultaneous PDF fits, cf. Refs. [53, 61, 69, 70]. The PDFs are derived for a series of fixed values of αS(MZ)and the nominal choice of µrand µf. Using this series, the best fit αS(MZ)value of the dijet data is determined for each scale variation. Here, the evaluated uncertainty is∆αS(MZ) =−+0.00190.0031(scale, αS(MZ)series).
Both results, αS(MZ) =0.1199+−0.00150.0016(all except scale) with+−0.00260.0016(scale, refit) and+−0.00310.0019(scale,
αS(MZ) series), are in agreement with Ref. [53], which reports αS(MZ) = 0.1192+−0.00230.0019 (all except scale) and +−0.00220.0009 (scale, refit) respectively −+0.00240.0039 (scale, αS(MZ) series). Similarly, it is observed that the second procedure leads to somewhat larger scale uncertainties, because there is less freedom for compensating effects between different gluon distributions and the
αS(MZ)values. Since this latter uncertainty is the most consistent to be compared with previ-ous fixed-PDF determinations of αS(MZ), it is quoted as the main result. The dominant source of uncertainty is of theoretical origin and arises due to missing higher order corrections, whose effect is estimated by scale variations.
This value of αS(MZ)is in agreement with the results from other measurements by CMS [53, 61, 69–71] and ATLAS [72], with the value obtained in a similar analysis complementing the DIS data of the HERAPDF2.0 fit with HERA jet data [55], and with the world average of
αS(MZ) = 0.1181±0.0011 [73]. In contrast to the other CMS results, this analysis is mainly focused on PDF constraints. The running of the strong coupling constant was tested only indi-rectly via the renormalisation group equations. No explicit test of the running was carried out by subdividing the phase space into regions corresponding to different values of the renormal-isation scale.
8
Summary
A measurement of the triple-differential dijet cross section is presented for √s = 8 TeV. The data are found to be well described by NLO predictions corrected for nonperturbative and electroweak effects, except for highly boosted event topologies that suffer from large uncer-tainties in parton distribution functions (PDFs).
The precise data constrain the PDFs, especially in the highly boosted regime that probes the highest fractions x of the proton momentum carried by a parton. The impact of the data on the PDFs is demonstrated by performing a simultaneous fit to cross sections of deep-inelastic scat-tering obtained by the HERA experiments and the dijet cross section measured in this analysis. When including the dijet data, an increased gluon PDF at high x is obtained and the overall uncertainties of the PDFs, especially those of the gluon distribution, are significantly reduced. In contrast to a fit that uses inclusive jet data, this measurement carries more information on the valence-quark content of the proton such that a more flexible parameterisation is needed to describe the low-x behaviour of the u and d valence quark PDFs. This higher sensitivity is ac-companied by slightly larger uncertainties in the valence quark distributions as a consequence of the greater flexibility in the parameterisation of the PDFs.
In a simultaneous fit the strong coupling constant αS(MZ)is extracted together with the PDFs. The value obtained at the mass of the Z boson is
αS(MZ) =0.1199 ±0.0015(exp) ±0.0002(mod)+−0.00020.0004(par)+−0.00310.0019(scale) =0.1199 ±0.0015(exp)+−0.00310.0020(theo),
AT-LAS [72], and with the world average value of αS(MZ) =0.1181 ± 0.0011 [73]. The dominant uncertainty is theoretical in nature and is expected to be reduced significantly in the future using pQCD predictions at next-to-next-to-leading order [74].
Acknowledgments
We congratulate our colleagues in the CERN accelerator departments for the excellent perfor-mance of the LHC and thank the technical and administrative staffs at CERN and at other CMS institutes for their contributions to the success of the CMS effort. In addition, we grate-fully acknowledge the computing centres and personnel of the Worldwide LHC Computing Grid for delivering so effectively the computing infrastructure essential to our analyses. Fi-nally, we acknowledge the enduring support for the construction and operation of the LHC and the CMS detector provided by the following funding agencies: BMWFW and FWF (Aus-tria); FNRS and FWO (Belgium); CNPq, CAPES, FAPERJ, and FAPESP (Brazil); MES (Bulgaria); CERN; CAS, MoST, and NSFC (China); COLCIENCIAS (Colombia); MSES and CSF (Croatia); RPF (Cyprus); SENESCYT (Ecuador); MoER, ERC IUT, and ERDF (Estonia); Academy of Fin-land, MEC, and HIP (Finland); CEA and CNRS/IN2P3 (France); BMBF, DFG, and HGF (Ger-many); GSRT (Greece); OTKA and NIH (Hungary); DAE and DST (India); IPM (Iran); SFI (Ireland); INFN (Italy); MSIP and NRF (Republic of Korea); LAS (Lithuania); MOE and UM (Malaysia); BUAP, CINVESTAV, CONACYT, LNS, SEP, and UASLP-FAI (Mexico); MBIE (New Zealand); PAEC (Pakistan); MSHE and NSC (Poland); FCT (Portugal); JINR (Dubna); MON, RosAtom, RAS, RFBR and RAEP (Russia); MESTD (Serbia); SEIDI, CPAN, PCTI and FEDER (Spain); Swiss Funding Agencies (Switzerland); MST (Taipei); ThEPCenter, IPST, STAR, and NSTDA (Thailand); TUBITAK and TAEK (Turkey); NASU and SFFR (Ukraine); STFC (United Kingdom); DOE and NSF (USA).
Individuals have received support from the Marie-Curie programme and the European Re-search Council and EPLANET (European Union); the Leventis Foundation; the A. P. Sloan Foundation; the Alexander von Humboldt Foundation; the Belgian Federal Science Policy Of-fice; the Fonds pour la Formation `a la Recherche dans l’Industrie et dans l’Agriculture (FRIA-Belgium); the Agentschap voor Innovatie door Wetenschap en Technologie (IWT-(FRIA-Belgium); the Ministry of Education, Youth and Sports (MEYS) of the Czech Republic; the Council of Sci-ence and Industrial Research, India; the HOMING PLUS programme of the Foundation for Polish Science, cofinanced from European Union, Regional Development Fund, the Mobil-ity Plus programme of the Ministry of Science and Higher Education, the National Science Center (Poland), contracts Harmonia 2014/14/M/ST2/00428, Opus 2014/13/B/ST2/02543, 2014/15/B/ST2/03998, and 2015/19/B/ST2/02861, Sonata-bis 2012/07/E/ST2/01406; the National Priorities Research Program by Qatar National Research Fund; the Programa Clar´ın-COFUND del Principado de Asturias; the Thalis and Aristeia programmes cofinanced by EU-ESF and the Greek NSRF; the Rachadapisek Sompot Fund for Postdoctoral Fellowship, Chula-longkorn University and the ChulaChula-longkorn Academic into Its 2nd Century Project Advance-ment Project (Thailand); and the Welch Foundation, contract C-1845.
References
[1] UA2 Collaboration, “Observation of very large transverse momentum jets at the CERN ¯pp collider”, Phys. Lett. B 118 (1982) 203, doi:10.1016/0370-2693(82)90629-3. [2] AFS Collaboration, “Dijet production cross-section and fragmentation of jets produced in
20 References
[3] CDF Collaboration, “A measurement of the differential dijet mass cross section in p ¯p collisions at√s=1.8 TeV”, Phys. Rev. D 61 (2000) 091101,
doi:10.1103/PhysRevD.61.091101, arXiv:hep-ex/9912022.
[4] CDF Collaboration, “Measurement of the dijet mass distribution in p ¯p collisions at√ s =1.8 TeV”, Phys. Rev. D 48 (1993) 998, doi:10.1103/PhysRevD.48.998.
[5] CDF Collaboration, “Two-jet invariant-mass distribution at√s=1.8 TeV”, Phys. Rev. D
41(1990) 1722, doi:10.1103/PhysRevD.41.1722.
[6] D0 Collaboration, “Dijet mass spectrum and a search for quark compositeness in ¯pp collisions at√s=1.8 TeV”, Phys. Rev. Lett. 82 (1999) 2457,
doi:10.1103/PhysRevLett.82.2457, arXiv:hep-ex/9807014.
[7] ATLAS Collaboration, “Measurement of inclusive jet and dijet cross sections in
proton-proton collisions at 7 TeV centre-of-mass energy with the ATLAS detector”, Eur. Phys. J. C 71 (2011) 1512, doi:10.1140/epjc/s10052-010-1512-2,
arXiv:1009.5908.
[8] CMS Collaboration, “Measurement of the differential dijet production cross section in proton-proton collisions at√s=7 TeV”, Phys. Lett. B 700 (2011) 187,
doi:10.1016/j.physletb.2011.05.027, arXiv:1104.1693.
[9] ATLAS Collaboration, “Measurement of inclusive jet and dijet production in pp collisions at√s=7 TeV using the ATLAS detector”, Phys. Rev. D 86 (2012) 014022,
doi:10.1103/PhysRevD.86.014022, arXiv:1112.6297.
[10] ATLAS Collaboration, “Measurement of dijet cross sections in pp collisions at 7 TeV centre-of-mass energy using the ATLAS detector”, JHEP 05 (2014) 059,
doi:10.1007/JHEP05(2014)059, arXiv:1312.3524.
[11] CMS Collaboration, “Measurements of differential jet cross sections in proton-proton collisions at√s=7 TeV with the CMS detector”, Phys. Rev. D 87 (2013) 112002, doi:10.1103/PhysRevD.87.112002, arXiv:1212.6660.
[12] CDF Collaboration, “Two-jet differential cross-section in ¯pp collisions at√s=1.8 TeV”, Phys. Rev. Lett. 64 (1990) 157, doi:10.1103/PhysRevLett.64.157.
[13] CDF Collaboration, “Measurement of the two-jet differential cross section in p ¯p collisions at√s=1800 GeV”, Phys. Rev. D 64 (2001) 012001,
doi:10.1103/PhysRevD.64.012001, arXiv:hep-ex/0012013. [Erratum: doi:10.1103/PhysRevD.65.039902].
[14] Z. Nagy, “Three jet cross-sections in hadron hadron collisions at next-to-leading order”, Phys. Rev. Lett. 88 (2002) 122003, doi:10.1103/PhysRevLett.88.122003,
arXiv:hep-ph/0110315.
[15] Z. Nagy, “Next-to-leading order calculation of three-jet observables in hadron hadron collisions”, Phys. Rev. D 68 (2003) 094002, doi:10.1103/PhysRevD.68.094002, arXiv:hep-ph/0307268.
[16] CMS Collaboration, “The CMS experiment at the CERN LHC”, JINST 3 (2008) S08004, doi:10.1088/1748-0221/3/08/S08004.
[17] CMS Collaboration, “The CMS high level trigger”, Eur. Phys. J. C 46 (2006) 605, doi:10.1140/epjc/s2006-02495-8, arXiv:hep-ex/0512077.
[18] CMS Collaboration, “The CMS trigger system”, JINST 12 (2017) P01020, doi:10.1088/1748-0221/12/01/P01020, arXiv:1609.02366.
[19] CMS Collaboration, “Particle-flow reconstruction and global event description with the CMS detector”, (2017). arXiv:1706.04965. Submitted to JINST.
[20] CMS Collaboration, “Pileup removal algorithms”, CMS Physics Analysis Summary CMS-PAS-JME-14-001, 2014.
[21] M. Cacciari, G. P. Salam, and G. Soyez, “The anti-ktjet clustering algorithm”, JHEP 04 (2008) 063, doi:10.1088/1126-6708/2008/04/063, arXiv:0802.1189.
[22] CMS Collaboration, “Determination of jet energy calibration and transverse momentum resolution in CMS”, JINST 6 (2011) P11002,
doi:10.1088/1748-0221/6/11/P11002, arXiv:1107.4277.
[23] CMS Collaboration, “Jet energy scale and resolution in the CMS experiment in pp collisions at 8 TeV”, JINST 12 (2017) P02014,
doi:10.1088/1748-0221/12/02/P02014, arXiv:1607.03663.
[24] G. D’Agostini, “A multidimensional unfolding method based on Bayes’ theorem”, Nucl. Instrum. Meth. A 362 (1995) 487, doi:10.1016/0168-9002(95)00274-X.
[25] L. B. Lucy, “An iterative technique for the rectification of observed distributions”, Astron. J. 79 (1974) 745, doi:10.1086/111605.
[26] W. H. Richardson, “Bayesian-based iterative method of image restoration”, J. Opt. Soc. Am. 62 (1972) 55, doi:10.1364/JOSA.62.000055.
[27] T. Adye, “Unfolding algorithms and tests using RooUnfold”, in Proceedings, PHYSTAT 2011 Workshop on Statistical Issues Related to Discovery Claims in Search Experiments and Unfolding, p. 313. Geneva, Switzerland, January 17-20, 2011. arXiv:1105.1160. doi:10.5170/CERN-2011-006.
[28] S. Dulat et al., “New parton distribution functions from a global analysis of quantum chromodynamics”, Phys. Rev. D 93 (2016) 033006,
doi:10.1103/PhysRevD.93.033006, arXiv:1506.07443.
[29] S. Agostinelli et al., “GEANT4—a simulation toolkit”, Nucl. Instrum. Meth. A 506 (2003) 250, doi:10.1016/S0168-9002(03)01368-8.
[30] T. Sj ¨ostrand, S. Mrenna, and P. Z. Skands, “Pythia 6.4 physics and manual”, JHEP 05 (2006) 026, doi:10.1088/1126-6708/2006/05/026, arXiv:hep-ph/0603175. [31] E. Veklerov and J. Llacer, “Stopping rule for the MLE algorithm based on statistical
hypothesis testing”, IEEE Transactions on Medical Imaging MI-6 (1987) 313, doi:10.1109/TMI.1987.4307849.
[32] CMS Collaboration, “CMS luminosity based on pixel cluster counting - summer 2013 update”, CMS Physics Analysis Summary CMS-PAS-LUM-13-001, 2013.
22 References
[33] T. Kluge, K. Rabbertz, and M. Wobisch, “fastNLO: fast pQCD calculations for PDF fits”, in 14th International Workshop on Deep Inelastic Scattering (DIS 2006), p. 483. Tsukuba, Japan, April 20-24, 2006. arXiv:hep-ph/0609285.
doi:10.1142/9789812706706_0110.
[34] D. Britzger, K. Rabbertz, F. Stober, and M. Wobisch, “New features in version 2 of the fastNLO project”, in Proceedings, XX. International Workshop on Deep-Inelastic Scattering and Related Subjects (DIS 2012), p. 217. Bonn, Germany, March 26-30, 2012.
arXiv:1208.3641. doi:10.3204/DESY-PROC-2012-02/165.
[35] S. D. Ellis, Z. Kunszt, and D. E. Soper, “Two-jet production in hadron collisions at order
α3sin QCD”, Phys. Rev. Lett. 69 (1992) 1496, doi:10.1103/PhysRevLett.69.1496.
[36] S. Alekhin, J. Bl ¨umlein, and S. Moch, “Parton distribution functions and benchmark cross sections at NNLO”, Phys. Rev. D 86 (2012) 054009,
doi:10.1103/PhysRevD.86.054009, arXiv:1202.2281.
[37] L. A. Harland-Lang, A. D. Martin, P. Motylinski, and R. S. Thorne, “Parton distributions in the LHC era: MMHT 2014 PDFs”, Eur. Phys. J. C 75 (2015) 204,
doi:10.1140/epjc/s10052-015-3397-6, arXiv:1412.3989.
[38] NNPDF Collaboration, “Parton distributions for the LHC run II”, JHEP 04 (2015) 040, doi:10.1007/JHEP04(2015)040, arXiv:1410.8849.
[39] M. R. Whalley, D. Bourilkov, and R. C. Group, “The Les Houches Accord PDFs (LHAPDF) and LHAGLUE”, in Proceedings, HERA and the LHC: A Workshop on the implications of HERA for LHC physics: Vol. B. Geneva, Switzerland and Hamburg, Germany, March 26-27 and October 11-13, 2004, and March 21-24, 2005.
arXiv:hep-ph/0508110.
[40] A. Buckley et al., “LHAPDF6: parton density access in the LHC precision era”, Eur. Phys. J. C 75 (2015) 132, doi:10.1140/epjc/s10052-015-3318-8, arXiv:1412.7420. [41] T. Sj ¨ostrand, S. Mrenna, and P. Z. Skands, “A brief introduction to PYTHIA 8.1”, Comput.
Phys. Commun. 178 (2008) 852, doi:10.1016/j.cpc.2008.01.036, arXiv:0710.3820.
[42] M. B¨ahr et al., “Herwig++ physics and manual”, Eur. Phys. J. C 58 (2008) 639, doi:10.1140/epjc/s10052-008-0798-9, arXiv:0803.0883.
[43] CMS Collaboration, “Event generator tunes obtained from underlying event and multiparton scattering measurements”, Eur. Phys. J. C 76 (2015) 155,
doi:10.1140/epjc/s10052-016-3988-x, arXiv:1512.00815.
[44] M. H. Seymour and A. Siodmok, “Constraining MPI models using σeff and recent Tevatron and LHC underlying event data”, JHEP 10 (2013) 113,
doi:10.1007/JHEP10(2013)113, arXiv:1307.5015.
[45] P. Nason, “A new method for combining NLO QCD with shower monte carlo algorithms”, JHEP 11 (2004) 040, doi:10.1088/1126-6708/2004/11/040, arXiv:hep-ph/0409146.
[46] S. Frixione, P. Nason, and C. Oleari, “Matching NLO QCD computations with parton shower simulations: the POWHEG method”, JHEP 11 (2007) 070,
[47] S. Alioli, P. Nason, C. Oleari, and E. Re, “A general framework for implementing NLO calculations in shower Monte Carlo programs: the POWHEG BOX”, JHEP 06 (2010) 043, doi:10.1007/JHEP06(2010)043, arXiv:1002.2581.
[48] S. Alioli et al., “Jet pair production in POWHEG”, JHEP 04 (2011) 081, doi:10.1007/JHEP04(2011)081, arXiv:1012.3380.
[49] S. Dittmaier, A. Huss, and C. Speckner, “Weak radiative corrections to dijet production at hadron colliders”, JHEP 11 (2012) 095, doi:10.1007/JHEP11(2012)095,
arXiv:1210.0438.
[50] R. Frederix et al., “The complete NLO corrections to dijet hadroproduction”, JHEP 04 (2017) 076, doi:10.1007/JHEP04(2017)076, arXiv:1612.06548.
[51] M. Cacciari et al., “The t anti-t cross-section at 1.8 TeV and 1.96 TeV: a study of the systematics due to parton densities and scale dependence”, JHEP 04 (2004) 068, doi:10.1088/1126-6708/2004/04/068, arXiv:hep-ph/0303085.
[52] A. Banfi, G. P. Salam, and G. Zanderighi, “Phenomenology of event shapes at hadron colliders”, JHEP 06 (2010) 038, doi:10.1007/JHEP06(2010)038,
arXiv:1001.4082.
[53] CMS Collaboration, “Constraints on parton distribution functions and extraction of the strong coupling constant from the inclusive jet cross section in pp collisions at√
s =7 TeV”, Eur. Phys. J. C 75 (2015) 288,
doi:10.1140/epjc/s10052-015-3499-1, arXiv:1410.6765.
[54] J. Bellm et al., “Herwig 7.0/Herwig++ 3.0 release note”, Eur. Phys. J. C 76 (2016) 196, doi:10.1140/epjc/s10052-016-4018-8, arXiv:1512.01178.
[55] H1 and ZEUS Collaborations, “Combination of measurements of inclusive deep inelastic e±p scattering cross sections and QCD analysis of HERA data”, Eur. Phys. J. C 75 (2015) 580, doi:10.1140/epjc/s10052-015-3710-4, arXiv:1506.06042.
[56] S. Alekhin et al., “HERAFitter”, Eur. Phys. J. C 75 (2015) 304,
doi:10.1140/epjc/s10052-015-3480-z, arXiv:1410.4412.
[57] V. N. Gribov and L. N. Lipatov, “Deep inelastic ep scattering in perturbation theory”, Sov. J. Nucl. Phys. 15 (1972) 438.
[58] G. Altarelli and G. Parisi, “Asymptotic freedom in parton language”, Nucl. Phys. B 126 (1977) 298, doi:10.1016/0550-3213(77)90384-4.
[59] Y. L. Dokshitzer, “Calculation of the structure functions for deep inelastic scattering and e+e−annihilation by perturbation theory in quantum chromodynamics.”, Sov. Phys. JETP 46 (1977) 641.
[60] M. Botje, “QCDNUM: fast QCD evolution and convolution”, Comput. Phys. Commun.
182(2011) 490, doi:10.1016/j.cpc.2010.10.020, arXiv:1005.1481.
[61] CMS Collaboration, “Measurement and QCD analysis of double-differential inclusive jet cross-sections in pp collisions at√s=8 TeV and ratios to 2.76 and 7 TeV”, JHEP 03 (2017) 156, doi:10.1007/JHEP03(2017)156, arXiv:1609.05331.
24 References
[62] R. S. Thorne and R. G. Roberts, “An ordered analysis of heavy flavor production in deep inelastic scattering”, Phys. Rev. D 57 (1998) 6871, doi:10.1103/PhysRevD.57.6871, arXiv:hep-ph/9709442.
[63] R. S. Thorne, “Variable-flavor number scheme for next-to-next-to-leading order”, Phys. Rev. D 73 (2006) 054019, doi:10.1103/PhysRevD.73.054019,
arXiv:hep-ph/0601245.
[64] CMS Collaboration, “Measurement of the differential cross section and charge
asymmetry for inclusive pp→W±+X production at√s=8 TeV”, Eur. Phys. J. C 76 (2016) 469, doi:10.1140/epjc/s10052-016-4293-4, arXiv:1603.01803. [65] J. Pumplin et al., “Uncertainties of predictions from parton distribution functions. 2. the
Hessian method”, Phys. Rev. D 65 (2001) 014013,
doi:10.1103/PhysRevD.65.014013, arXiv:hep-ph/0101032.
[66] W. T. Giele and S. Keller, “Implications of hadron collider observables on parton distribution function uncertainties”, Phys. Rev. D 58 (1998) 094023,
doi:10.1103/PhysRevD.58.094023, arXiv:hep-ph/9803393.
[67] CMS Collaboration, “Measurement of the muon charge asymmetry in inclusive
pp→W+X production at√s =7 TeV and an improved determination of light parton distribution functions”, Phys. Rev. D 90 (2014) 032004,
doi:10.1103/PhysRevD.90.032004, arXiv:1312.6283.
[68] B. J. A. Watt, P. Motylinski, and R. S. Thorne, “The effect of LHC jet data on MSTW PDFs”, Eur. Phys. J. C 74 (2014) 2934, doi:10.1140/epjc/s10052-014-2934-z, arXiv:1311.5703.
[69] CMS Collaboration, “Measurement of the ratio of the inclusive 3-jet cross section to the inclusive 2-jet cross section in pp collisions at√s =7 TeV and first determination of the strong coupling constant in the TeV range”, Eur. Phys. J. C 73 (2013) 2604,
doi:10.1140/epjc/s10052-013-2604-6, arXiv:1304.7498.
[70] CMS Collaboration, “Measurement of the inclusive 3-jet production differential cross section in proton-proton collisions at 7 TeV and determination of the strong coupling constant in the TeV range”, Eur. Phys. J. C 75 (2015) 186,
doi:10.1140/epjc/s10052-015-3376-y, arXiv:1412.1633.
[71] CMS Collaboration, “Determination of the top-quark pole mass and strong coupling constant from the t¯t production cross section in pp collisions at√s= 7 TeV”, Phys. Lett. B
728(2014) 496, doi:10.1016/j.physletb.2013.12.009, arXiv:1307.1907. [72] ATLAS Collaboration, “Measurement of transverse energy-energy correlations in
multi-jet events in pp collisions at√s=7 TeV using the ATLAS detector and
determination of the strong coupling constant αs(mZ)”, Phys. Lett. B 750 (2015) 427, doi:10.1016/j.physletb.2015.09.050, arXiv:1508.01579.
[73] C. Patrignani and others (Particle Data Group), “Review of particle physics”, Chin. Phys. C 40 (2016) 100001, doi:10.1088/1674-1137/40/10/100001.
[74] J. Currie, E. W. N. Glover, and J. Pires, “Next-to-next-to leading order QCD predictions for single jet inclusive production at the LHC”, Phys. Rev. Lett. 118 (2017) 072002, doi:10.1103/PhysRevLett.118.072002, arXiv:1611.01460.