The implementation of
autonomous vehicles
by TNCs in Portugal
Tatiana Barros
Dissertation written under the supervision of Miguel Rita
Dissertation submitted in partial fulfilment of requirements for the
MSc in Management with specialization in Strategy and
Entrepreneurship, at the Universidade Católica Portuguesa,
January 2020.
2 Abstract
The implementation of autonomous vehicles by TNCs in Portugal Tatiana Barros
Keywords: Autonomous vehicles, Shared-mobility, Transportation Network Companies, Motivations, Barriers
The increasing popularity of shared-mobility services completely reshaped the automotive industry particularly with the introduction of Transportation Network Companies like Uber. This research will mainly focus on the implementation of autonomous vehicles, namely vehicles with automated driving features that do not require human intervention by TNCs in Portugal. The main purpose is to investigate the motivations and barriers that influence people’s decision to prefer an autonomous vehicle over the conventional one when using a TNC as well as understand which demographic market segment is most attracted by this implementation. With this aim, 10 in-depth interviews were carried out as well as an online survey which collected 127 valid answers. Findings showed that, in general, people that use TNCs in Portugal tend to have a positive opinion regarding these companies as well as autonomous vehicles. However, there is still a certain hesitation towards the openness to choose an autonomous vehicle in this industry, mainly explained by privacy issues and its capacity to react to potential external threats. Moreover, people with more than 30 years old were far more receptive to choose an autonomous vehicle in this industry than the younger ones and women showed more resistance towards about the autonomous vehicles than men. Additionally, the majority of respondents believed that the probability of having an accident with these vehicles will decrease and they will be less damaging to the environment.
3 Resumo
A implementação de carros autónomos nas plataformas digitais de transporte individual de passageiros em veículo descaracterizado (TVDE) em Portugal
Tatiana Barros
Palavras-Chave: Carros autónomos, Mobilidade partilhada, TVDE, Motivações, Barreiras A crescente popularidade dos serviços de mobilidade partilhada reconfiguraram a indústria automóvel particularmente com a introdução das plataformas digitais de transporte individual de passageiros em veículo descaracterizado (TVDE) como a Uber.
Esta dissertação foca-se na implementação de veículos autónomos, nomeadamente veículos com funcionalidades automáticas que não requerem intervenção humana, nas plataformas digitais de TVDE em Portugal. O propósito deste estudo é então investigar as principais motivações e barreiras que influenciam a decisão das pessoas em preferir um carro autónomo quando utilizam estas plataformas digitais, assim como compreender qual o segmento demográfico que é mais atraído por esta implementação. Desta forma, foram realizadas 10 entrevistas e um questionário com 127 respostas válidas. Os resultados revelam que, em geral, as pessoas que usam estas plataformas em Portugal tendem a ter uma opinião positiva em relação a estas empresas bem como veículos autónomos. No entanto, existe uma certa hesitação devido a questões de privacidade ou à capacidade destes veículos em reagir a ameaças externas. Ademais, as pessoas com mais de 30 anos revelaram estar mais recetivas à implementação de carros autónomos nesta indústria do que as mais novas e as mulheres mais hesitantes do que os homens. Adicionalmente, a maioria dos participantes acreditam que a probabilidade de ter um acidente com estes veículos é menor assim como acreditam ser menos poluentes.
4 Acknowledgments
Firstly, I would like to express my sincere gratitude to my advisor Professor Miguel Rita for his generous support, his constant feedback but more importantly for his honest opinion in every moment. It was a pleasure to have Professor Miguel Rita as a mentor.
Secondly, I would like to thank my parents, particularly my mother, for always investing in my education and supporting me throughout the entire process. I couldn’t have done this without their love and passionate encouragement.
I would also like to thank my boyfriend Sebastião for all the unconditional support and always making me believe that I was capable to do it. His endless motivation was essential in this phase and was more than I could ever ask for.
Finally, I would like to acknowledge my family and my friends for always being there to help me and encourage me to keep going. Particularly, I would like to thank my aunt Maria da Graça for all the love, my best friends Sara and Gonçalo for their positivity and all the people I interviewed that took their time to answer the online survey. Their contribution was very important to this study.
5 Table of Contents
1. Introduction ... 8
2. Literature Review ... 10
2.1. Overview of the industry ... 10
2.2. Types of shared-mobility services ... 11
2.3. The concept of autonomous vehicle ... 12
2.4. Autonomous vehicles’ main advantages and challenges ... 13
2.5. Demographic factors ... 13
2.5.1. Demographic factors in the shared-mobility sector particularly with TNC ... 14
2.5.2. Demographic factors that affect the user intention to choose an autonomous vehicle 14 2.6. Underlying motivations of people to prefer an autonomous vehicle over a conventional car in the shared-mobility industry (TNC) ... 15
2.6.1. Improve safety in terms of number of accidents ... 15
2.6.2. Environmental reasons ... 15
2.6.3. No human interaction ... 16
2.6.4. New experience ... 16
2.7. Main barriers that deter users from choosing an autonomous vehicle in the shared-mobility industry (TNC) ... 16
2.7.1. Trust ... 16
2.7.2. Privacy ... 17
2.7.3. Security ... 18
3. Methodology and Data ... 19
3.1. Summary of hypotheses... 19
3.2. Research Design and Instruments ... 20
3.2.1. Qualitative Research ... 20
6 3.3. Data Collection ... 21 3.3.1. Qualitative Research ... 21 3.3.2. Quantitative Research ... 22 3.4. Data analysis ... 22 3.4.1. Qualitative Research ... 22 3.4.2. Quantitative Research ... 23 4. Results ... 23 4.1. Qualitative Analysis ... 23 4.2. Quantitative Analysis ... 26
4.2.1. General Sample Characteristics ... 26
4.2.2. General Results ... 26 4.2.3. Hypotheses testing ... 28 5. Discussion ... 32 5.1. Main conclusions ... 32 5.2. Limitations ... 34 5.3. Future research ... 34 Appendices ... 35 References ... 51 List of Tables Table 1 - Interviewees' Demographic Variables... 23
Table 2 – Number of people that would choose an autonomous vehicle when using a TNC by age ... 24
Table 3 – Number of people that would choose an autonomous vehicle when using a TNC by gender ... 24
7 List of Figures
Figure 1 - General opinion regarding autonomous vehicles ... 26 Figure 2 - General opinion regarding TNCs ... 27 Figure 3 - How likely would you be willing to choose an autonomous vehicle when using a Transportation Network Company (like Uber)? ... 27
8 1. Introduction
Since the 1990s when the autonomous vehicles were only still found in science fiction movies, people have been dreaming with a full-automated vehicle. However, only recently some advances in the autonomous vehicles technology have emerged. Although they should only arrive to the market in 2030, they already represent a potential disruptive change, not only to the transportation industry but the way people live in society (European Parliament 2019). Indeed, companies like Uber are already investing in this type vehicles as they are seen as a good way to differentiate its service from the competitors. But what are people’s perception about the implementation of autonomous vehicles in this industry?
This research will mainly focus on the adoption of autonomous vehicles, namely vehicles with automated driving features that do not require human intervention (level 5 according to the SAE J3016 standard norm further presented in the literature review), by Transportation Network Companies (TNCs). The TNCs are a shared-mobility service type which “are entities that use a digital network to connect riders to drivers for the purposes of pre-arranging and providing transportation” (Schwieterman et al., 2017).
The main purpose of this study is to investigate the main motivations and barriers that influence people’s decision to prefer an autonomous vehicle over a conventional one when using a Transportation Network Company like Uber or Kapten, as well as understand which demographic market segment is most attracted by the implementation of autonomous vehicles in the shared-mobility industry (particularly with TNC). By doing so, the purpose of this research is to be able to answer the following research questions listed below:
RQ1: What is the demographic market segment that is most attracted by the implementation of autonomous vehicles in the shared-mobility (TNC) industry in Portugal?
RQ2: What are the underlying motivations that drive people to prefer an autonomous vehicle over a conventional one when using a TNC in Portugal?
RQ3: What are the main barriers that deter users from using autonomous vehicles when using a TNC in Portugal?
The findings disclosed on this research are expected to contribute to a far-reaching understanding of people’s perceptions (main motivations and barriers) towards the implementation of autonomous vehicles in the shared-mobility industry (particularly with TNC) in Portugal. At the same time, it is also expected to contribute with additional insights to
9 companies like Uber about the reaction of consumers in Portugal to the launch of this type of vehicles in the TNC industry.
This dissertation is organized in five chapters. In the next chapter a Literature Review is presented around the existent academic research mainly in top journals. In order to place the research in its proper context, an overview of the industry is outlined, as well as a description of all types of shared-mobility services that currently exists in the market. Then, the concept of autonomous vehicle is introduced with its main advantages and challenges. After understanding the demographic market segment that is most attracted, on one hand, to the service provided by this industry and, on the other hand, to the autonomous vehicles, the main motivations and barriers are explored. The third chapter covers the methodology which includes qualitative research and its main findings that were the basis, together with the literature review, to build the quantitative research. Subsequently, the quantitative research’s results and data analysis are addressed in the fourth chapter. Finally, in the last chapter, relevant conclusions are discussed as well as some notes were proposed for future research and limitations faced during the research.
10 2. Literature Review
2.1. Overview of the industry
Technological disruptions in the “sharing economy” are completely changing the way people travel around the world. The increasing popularity of shared-mobility services reshaped the automotive industry. Platforms like Uber and Bolt make it possible for anyone to turn unused or under-used cars that represent a substantial investment into productive resources by turning them into on-demand taxis (Wallsten 2015).
On the other hand, the rapid growth of shared mobility completely broke the taxicab industry by offering a higher quality service (like being more helpful with the passengers or giving them the option to choose the radio station) at lower prices. In fact, the taxicab industry is heavily regulated worldwide which led to multiple protests against shared mobility apps around the world.
At the same time, the introduction of shared-mobility services completely changed the way young people look to cars.
“Young people are apparently losing their interest in car ownership as being important to their self-definition. They find car purchase, maintenance, and parking to be prohibitively expensive and increasingly would rather not have the hassle.”
Belk, 2014 In fact, shared-mobility services became an alternative to car ownership but it hasn’t always been like that. Historically, the access-based consumption “has been stigmatized and was seen as an inferior consumption mode” (Ronald, 2008). By contrast, ownership was perceived as “a way to provide a sense of personal independence and security” (Snare 1972; Bardhi et al. 2012). The popularity of access was due to several factors like the global economic crisis, the instability in social relationships, uncertainties in the labor market and also due to space limitations in urban areas with parking and storage. This reasons led people to rethink their values and the relationship between ownership and access-based consumption (Bardhi et al., 2012).
But how does this shared-mobility services’ platforms work? It all starts with the need to go from point A to point B as quickly as possible. To do so, the client just needs to go to the app on his/her smartphone and indicate his/her location. On the other side, a driver will reply to the request. Before all of that, the client needs to put its credit card credentials so that neither
11 the client nor the driver deal with physical money. The price paid by the client is splited between the driver and the ride-share company.
In 2016, the shared-mobility market was divided in three main regions: China, which contributed with $24 billion dollars; United States of America, that represented $23 billion dollars and Europe with just $6 billion dollars (McKinsey, 2017).
Uber and Lyft were the two main players in the US market capturing, in July 2019, 71% and 27% of the rideshare market, respectively (Gessner 2019). In Portugal, there were only 4 companies operating in this market in 2018: Uber, the first one that reached the market in 2014; Cabify; Taxify that changed its name to Bolt and Chauffer Privé that also changed its name to Kapten (Lusa 2018).
Despite its market size, a 2017 McKinsey survey revealed that 67% of all US respondents still prefer driving their own vehicles over using ride-hailing apps and 63% aren’t interested in trading their cars for shared-mobility rides. In fact, the shared-mobility industry reveals some limitations like the lack of availability in rural areas since this industry is only economically viable in cities with high population density. Besides this limitations the shared-mobility industry face some customer pain points, for example, the uncomfortable dynamics between passengers and the driver who are basically strangers (McKinsey, 2017).
2.2.Types of shared-mobility services
There are four major types of shared-mobility services: carsharing, transportation network companies, microtransit services and crowdsourced intercity bus operators (Schwieterman et al., 2017).
Carsharing: “a system of car rentals in which people can rent vehicles for short periods, often by the hour or mile”. This system works on a membership-based model which means that cars are only available to members that is different from the conventional car renting companies (Schwieterman et al., 2017).
Transportation Network Companies (TNCs): “are entities that use a digital network to connect riders to drivers for the purposes of pre-arranging and providing transportation”. The main companies in this sector are Lyft and Uber. Over the years this type of companies have been launching several services to differentiate their service from the competitors. For example, Uber have five types of services: UberX, the most common one; UberXL, for larger groups of people up to six people; UberBLACK, as the name suggests, offers black vehicles with black interiors; UberSELECT, which
12 offers a customized service with a luxury vehicle and UberLUX which “guarantee of being picked up in a BMW 7-Series, Mercedes Benz S-Class, or other high-end luxury vehicle”. The most recent service launched by Uber was UberPOOL that allows the same driver to pick up multiple clients in one trip. The other companies in the market have followed a similar strategy to this one (Schwieterman et al., 2017).
Microtransit Service: firms that offer van and bus services with more flexibility than public transports regarding, for example, schedules that often change according to sypply and demand (Schwieterman et al., 2017).
Crowdsourced Intercity Bus Operators: includes “firms that facilitate intercity trips” (Schwieterman et al., 2017).
This research will mainly focus on Transportation Network Companies (TNCs). 2.3. The concept of autonomous vehicle
“Automated vehicles are those in which at least some aspects of a safety-critical control function (e.g., steering, throttle, or braking) occur without direct driver input. Vehicles that provide safety warnings to drivers (forward crash warning, for example) but do not perform a control function are, in this context, not considered automated, even though the technology necessary to provide that warning involves varying degrees of automation (e.g., the necessary data are received and processed, and the warning is given, without driver input)”.
States, 2011 There are different levels of driving automation and several classification systems. The Society of Automobile Engineers (SAE) defines six levels of driving automation on its J3016 standard norm: from level 0 to level 2 it is included those vehicles that have only driver support features which the driver must constantly supervise and from level 3 to level 5 those with automated driving features that won’t require human intervention (except on level 3 where in some situations the features requests human intervention). The SAE J3016 currently stands as the most widely adopted classification, being included in the Federal Automated Vehicles Policy promoted by the U.S. Department of Automation as well as the European Parliament (SAE 2018 and European Parliament 2019). Nowadays in the European market there are only those vehicles assisting drivers (levels 1 and 2 of automation) since self-driving vehicles or driverless vehicles (levels 3 and 4) are currently being tested and are expected on the market between 2020 and 2030, while fully automated vehicles (level 5) should arrive in 2030 (European Parliament 2019).
13 This research will mainly focus on vehicles with automated driving features that do not require human intervention (level 5 according to the SAE J3016 standard norm).
2.4. Autonomous vehicles’ main advantages and challenges
The autonomous vehicles would be a real game changer in the shared-mobility industry as they bring some benefits but at the same time some challenges to the industry.
The convergence of sensor-based safety systems and connected vehicle technology brings to the market some advantages as follow: crash elimination by improving vehicle safety; reduce the need for building new infrastructure; reduce uncertainty in travel times by providing a fair assessment of travel time; increase productivity as it will allow travelers to make use of travel time to work on other subjects; improve energy efficiency with a more efficient driving and new business models and scenarios because the convergence of different technologies may lead to the convergence of different types of industries (Silberg 2012). Moreover, driverless cars can drastically reduce traffic congestion, emissions of greenhouse gases and air pollutants. Mobility can also be improved, for example by opening up road transport to the elderly and those with reduced mobility or disabilities (European Parliament, 2019).
However, self-driving cars also bring some challenges regarding, for instance, who would take responsibility in case of accident, “this involves not only legal questions but also moral ones” (Hevelke et al., 2015). At the same time, autonomous vehicles would have to face several legal challenges regarding regulations and policies, privacy interests and security issues (with possible cyber attacks) (Bagloee et al., 2016; Glancy, 2012; Yağdereli et al., 2015).
2.5. Demographic factors
The main purpose of this section is to get a better understanding about the demographic market segment that would be more willing to choose an autonomous vehicle over a conventional one when using a shared-mobility service particularly with a TNC. Although there are no evidence in the literature about this subject, the demographic factors were studied separately in the shared-mobility sector and in the user intention to choose an autonomous vehicle.
14 2.5.1. Demographic factors in the shared-mobility sector particularly with TNC
More recently, TNC has become a key transportation trend in the lives of many people. But what is the demographic market segment that is most attracted to the service provided by those companies? Who is the main user of this industry?
A survey made in London, Madrid, Tokyo and Paris concluded that there is a generation effect in the adoption intention of shared-mobility services and users tend to be younger people, men and people that live in city centers (Prieto et al., 2017). This is in line with a growing trend among young adults (with 21-30 years old) to search for transportation alternatives to car ownership (Botsman & Rogers, 2010). Another survey conducted in Italy concluded the same results: the TNC user profile is “male, employed 25-45 years old and travelling for non-working purposes”. This last one found four significant socio-economic variables: “age, gender, employed and number of household vehicles” (Cartenì et al., 2016).
2.5.2. Demographic factors that affect the user intention to choose an autonomous vehicle With respect to the user intention to choose an autonomous car over a conventional vehicle, a survey conducted in the U.S., U.K. and Australia reveals that older people are less receptive than younger people to ride in an autonomous vehicle. Younger people tend to focus more on the benefits of using this type of vehicles like less traffic congestion than older people. At the same time there are also differences in terms of gender with females being more resistant and expressing higher levels of concern about autonomous cars than males (Schoettle & Sivak, 2014). Another research made in Germany concluded the same results: the willingness to use automated cars is different between men and women, “with the latter group showing lower usage intention” (Hohenberger et al, 2016). Besides this variables, the willingness to ride on an autonomous vehicle also varies according to the level of education: people with higher levels of education are more likely to ride in self-driving vehicles. The employment status is also relevant in the sense that both full-time employed individuals and full-time students were more likely to ride on an autonomous vehicle (Schoettle & Sivak, 2014).
Considering both demographic factors that characterize the shared-mobility industry (mainly focus on TNC) and the user intention to choose an autonomous vehicle, the following hypotheses were proposed:
H1: Younger people (21-30 years old) are more receptive to choose an autonomous vehicle in the shared-mobility industry (TNC).
15 H3: There are a positive correlation between the willingness to ride on an autonomous vehicle and the level of education.
H4: The employment status has a significant impact in the willingness to choose an autonomous vehicle with full-time employed individuals and full-time students being more likely to ride on an autonomous vehicle.
2.6.Underlying motivations of people to prefer an autonomous vehicle over a conventional car in the shared-mobility industry (TNC)
2.6.1. Improve safety in terms of number of accidents
As automobiles are becoming more unsustainable regarding the space limitation in urban areas (with a high rate of accidents and high levels of road traffic) self-driving cars have been proposed as an alternative to conventional cars (Kaur, 2018). In fact, people expect that an autonomous vehicle would result in fewer accidents (Winkler et al., 2019). In the U.S. 94% of vehicle accidents were due to human performance errors (driver). The most frequently assigned reason was recognition errors (with 44%), “which included driver’s inattention, internal and external distractions, and inadequate surveillance” (Singh, 2015). Considering this idea, the following hypothesis was proposed:
H5: People believe that choosing an autonomous vehicle would reduce the probability of having an accident, when using a shared-mobility service (TNC).
2.6.2. Environmental reasons
Does people care about the environment when using a shared-mobility service or do they only care about the environment when using their own vehicle? A survey made by Capgmini concluded that 71% of respondents found “reduced environmental hazards and carbon footprint” as a key factor that would encourage them to both purchase and use a self-driving car (Winkler et al., 2019). One possible reason that could explain this phenomenon is the fact that “people commonly conflate AV technology with electric vehicles”. However, “autonomous-vehicle software can be applied to existing hardware; both electric and gasoline-powered automobiles can be self-driven” (Browne 2019).
With this in mind, the following hypothesis was proposed:
16 2.6.3. No human interaction
Over time, with recent advances in technology, people got used to the presence of machines and it is now more common to see people interact with technology like digital virtual assistants (Alexa or Siri) or even robots like Sophia (Novanda et al. 2016). Technologies are increasingly seen as an alternative to face-to-face interaction in different sectors like education with virtual classes, the management sector or the healthcare and social assistance sector (Carrillo 2012; Chui et al., 2016).
In fact, an autonomous vehicle in the TNC industry implies not having a human driver, which gives people a sense of having more privacy by removing the obligation to interact with someone.
2.6.4. New experience
It is expected that the introduction of autonomous vehicles would generate curiosity among people which has been accustomed with the traditional vehicle. Choosing an autonomous vehicle as a shared-mobility service would mean having a different experience from what people are used to. A survey made in the U.K. found out that 51% of respondents said that it “will be a positive experience” travelling in a self-driving car (Bornstein et al., 2017).
2.7. Main barriers that deter users from choosing an autonomous vehicle in the shared-mobility industry (TNC)
Although the autonomous vehicles have major benefits simultaneously to transportation network companies (TNCs) and individuals, the introduction of these vehicles in the shared-mobility industry (TNC) is only profitable to companies like Uber if managers have the capacity to overcome some barriers that deter users from preferring an autonomous vehicle over a conventional one. Indeed, some studies revealed that users expressed high levels of concern about riding in an autonomous vehicle because of trust/control issues, privacy and security concerns (Schoettle and Sivak, 2014). Public concern regarding those issues is the main barrier to the implementation of autonomous vehicles in this industry.
2.7.1. Trust
“Trust is defined as a willingness to rely on an ex-change partner in whom one has confidence”. This definition spans two main ideas about trust: the first one a belief and expectation of a person “that results from the partner’s expertise” and a second idea that reflects
17 the fact that “trust has been viewed as a behavioral intention or behavior that reflects a reliance on a partner and involves vulnerability and uncertainty on the part of the trustor”. This means that without vulnerability and uncertainty, trust is unnecessary (Moorman, Zaltman & Deshpande, 1992). However, trust is an important variable that mediates not only relationships between humans but also relationships between humans and automation which means that trust can be applied to the technology. When trusting in an autonomous vehicle, a certain individual is putting himself/herself into a vulnerable position and accepting the willingness to take a risk and not taking a risk per se (Mayer et al., 1995). Simultaneously, the individual is giving up the control over the vehicle to a technology system in which he/she expects to behave in a certain way. “Trust is important in these contexts because it directly affects the willingness of people to accept” and use an autonomous vehicle (Hancock et al. 2011; Verberne, 2012). And in fact, “people are not always willing to put sufficient trust in automation” (Lee & See 2004).
A survey conducted in the U.S., U.K. and Australia revealed that respondents expressed high levels of concern about riding in an autonomous vehicle because there are no human control over the car (Schoettle and Sivak, 2014). Another survey made in the U.K. confirms the same idea: people feel comfortable with cars that do more and more of the driving, but they prefer to have a human in control of the vehicle (Bornstein et al., 2017). Considering this idea, the following hypothesis was proposed:
H7: The lack of trust in technology is a main barrier that deter users from choosing an autonomous vehicle in the TNC industry.
2.7.2. Privacy
A potential barrier regarding the decision to choose an autonomous vehicle is privacy. Some users perceive this type of vehicles as a threat to their privacy in different ways such as the ability to transmit his/her present location, past travel patterns or future travel plans.
Regarding privacy, there are three types of privacy interests that affect the willingness to choose an autonomous vehicle: personal autonomy privacy interests, personal information privacy interests and surveillance privacy interests (Glancy, 2012).
Personal autonomy privacy interests refers to the “people’s abilities to make independent choices about themselves” and it will be important in the decision to choose or not to choose an autonomous vehicle. When using this type of vehicles there is clearly a loss of autonomy to the individual and at the same time a delegation of responsibility to the vehicle’s system. Also, “many individuals identify psychologically with the vehicles they drive and view their vehicles as key instruments of personal choice, power
18 and control”. However, when using autonomous vehicles as a shared-mobility service the intensity of psychological connection between a vehicle and autonomy could diminish (Glancy 2012).
Personal information privacy interests relate to the amount of data that is included in an autonomous vehicle system. This type of data consist essentially in personal information about a specific individual or group of people like where they are, when it was made and how they moved from point A to point B. Users may be reluctant to use autonomous vehicles if they do not know how their personal information will be processed, the purpose for which it will be used and possible consequences for them (Glancy 2012). Surveillance privacy interests “respond to people’s aversion to being constantly
watched, tracked or monitored as they travel from place to place”. One example of this could be the possibility of autonomous vehicles report its speed to law enforcement authorities. Moreover, the sophisticated technologies of autonomous vehicles’ system can make the user susceptible to covert surveillance where autonomous vehicles secretly collect personal information (Glancy 2012). This can definitely affect people’s perception about autonomous vehicles and consequently affect their option to choose between an autonomous vehicle and a conventional one in this industry.
Therefore, the following hypothesis was included:
H8: People see the autonomous vehicles as a threat to their privacy. 2.7.3. Security
The sophisticated system of autonomous vehicles may be vulnerable to a possible cyber security attack, remote control of the vehicle and other types of cyber-attacks (Yağdereli et al., 2015). Moreover, security can also include the capability of the vehicle to react to potential external environment threats like pedestrians or collisions with other vehicles. Transportation networks companies will have to take measures to mitigate possible security threats, so that people feel safe when using autonomous vehicles.
In fact, a survey conducted in the U.S., U.K. and Australia revealed that the majority of respondents expressed high levels of concern about riding in an autonomous vehicle because of security issues related to those vehicles (Schoettle and Sivak, 2014). Therefore, the following hypothesis is considered:
H9: People believe there is a high probability of the autonomous vehicle’ system failing to react to possible external environmental threats.
19 3. Methodology and Data
The main purpose of this research is to explore consumers’ perception about using an autonomous vehicle when using a shared-mobility service (particularly with TNC) in Portugal by focusing in three main research questions:
RQ1: What is the demographic market segment that is most attracted by the implementation of autonomous vehicles in the shared-mobility (TNC) industry in Portugal?
RQ2: What are the underlying motivations that drive people to prefer an autonomous vehicle over a conventional one when using a TNC in Portugal?
RQ3: What are the main barriers that deter user from using autonomous vehicles when using a TNC in Portugal?
In order to answer those research questions, secondary data was previously collected as presented in the literature review followed by primary data collection (particularly focusing on the Portuguese market). Qualitative research was conducted through in-depth interviews. Finally, an online survey was designed in terms of quantitative research.
3.1.Summary of hypotheses
All the data collected up to this point enabled the formulation of hypotheses that will be tested particularly in the Portuguese market with both qualitative and quantitative methods. Those hypotheses are summarized below:
H1: Younger people (21-30 years old) are more receptive to choose an autonomous vehicle in the shared-mobility industry (TNC).
H2: Men are more likely to choose an autonomous vehicle in this industry than women. H3: There are a positive correlation between the willingness to ride on an autonomous vehicle and the level of education.
H4: The employment status has a significant impact in the willingness to choose an autonomous vehicle with full-time employed individuals and full-time students being more likely to ride on an autonomous vehicle.
H5: People believe that choosing an autonomous vehicle would reduce the probability of having an accident, when using a shared-mobility service (TNC).
20 H7: The lack of trust in technology is a main barrier that deter users from choosing an autonomous vehicle in the TNC industry.
H8: People see the autonomous vehicles as a threat to their privacy.
H9: People believe there is a high probability of the autonomous vehicle’ system failing to react to possible external environmental threats.
3.2. Research Design and Instruments
3.2.1. Qualitative Research
To gather an initial understanding about consumers’ perception about the implementation of autonomous vehicles in the shared-mobility industry (TNC) in Portugal, in-depth interviews were conducted. Apart from being “the most popular form of qualitative data collection”, in-depth interviews allow the interviewer to see if the interviewees understand the questions that were raised and “clear up any misunderstandings immediately”, although they are time-consuming (White & Rayner 2014).
Having this in mind, 10 in-depth interviews were carried out face-to-face ranging between 10 to 15 minutes. All interviewees were people that already used a TNC in Portugal at least once in their life. Also, all of them followed a unique script (Appendix 2) which was divided in four sections. The first section included some demographic and personal questions regarding age, gender, education level, employment status and the level of risk aversion. The second part was introduced with a small description about TNCs and the concept of autonomous vehicles (including an image about the levels of driving automation) followed by a question about if he/she would choose an autonomous vehicle when using a TNC. The third part was about their motivations whose aim was to initially understand the main advantages that people perceive about AVs (autonomous vehicles) and then understand their opinion about some variables explored on the literature review as motivations (e.g. environmental impact). Lastly, the fourth section was focused on the barriers that deter users from using Avs when using a TNC with a general question about the topic and then some questions about specific variables like vulnerability/uncertainty, privacy and security.
3.2.2. Quantitative Research
The quantitative method chosen to this research was an online survey. This method enables to get information faster at lower costs with a higher response rate compared to the interviews. However, there is no opportunity for people to clarify any possible doubt and at the same time
21 there is no way to confirm if participants are answering honestly to the questions presented (White B. & Rayner S. 2014).
The online survey was made with the online Qualitrics software and it was prepared based on the literature review above and the findings from the interviews. It was conducted only in English. Before launching the survey, it was reviewed by 3 students in order to ensure that all questions were clear and without any mistakes. Therefore, some adjustments were made according to the suggestions obtained. Finally, the survey was published in November 18th 2019 and it was available during one week to collect all the information needed. Then, the data was analyzed using the statistical software SPSS – Statistical Package for Social Sciences and the spreadsheet program Excel.
The survey (presented in Appendix 3) was organized in 7 sections. The first section included an introduction to the survey emphasizing its anonymity and confidentiality and in the second part a brief introduction to the purpose of the study was given, as well as presented two fundamental concepts (TNCs and autonomous vehicles). In addition, an image with the different levels of driving automation was shown as some interviewees in the qualitative research referred it was easier to understand the concept of autonomous vehicles. The next section included only one question asking the participants if they ever used a TNC in Portugal. Only those who responded affirmatively moved forward to the next sections as the purpose of this study is to understand consumers’ perception about using an autonomous vehicle when using a TNC only in Portugal. The fourth section covered different questions regarding their personal opinion about using a vehicle that perform a control function (with an automation level 3 or lower), autonomous vehicles, TNCs and their willingness to choose an autonomous vehicle in the context of a TNC. The next two sections explored the main motivations and barriers to prefer a vehicle with full-automation over a traditional one by asking the participants to rate their level of agreement with different statements that included those factors previously studied in the literature review. Finally, the last section was developed in order to collect some demographic characteristics of the participants.
3.3. Data Collection
3.3.1. Qualitative Research
The sample of the qualitative research was selected via purposive sampling often called judgmental sampling. This non-random sampling type is used when “the researcher picks the sample they think will deliver the best information in order to satisfy the research objectives in
22 question” due to time constraints (White & Rayner 2014). Furthermore, as it was previously mentioned, 10 people were selected having into consideration that all of them already used a TNC in Portugal at least once in their life. The goal of this selection was to have the most heterogeneous sample, therefore, the interviewees were chosen according to their age, gender and education level. Hence, there were five males and five females ranging between 21 and 65 years old with different education levels (from elementary school to master degree).
3.3.2. Quantitative Research
To measure the variables included in the survey several scales were used according to the main goal of each question. Therefore, the survey starts with two “closed” questions where the answer is either “Yes” or “No” to understand if the participant ever used a TNC in Portugal and if he/she ever rode on a vehicle that performed a control function. The next two questions aimed to assess their general opinion regarding autonomous vehicles and TNCs. Therefore, a five-point scale consisting of “very positive, somewhat positive, neither positive nor negative, somewhat negative and negative” was used based on the study of Schoettle and Sivak (2014).
To study the main motivations that would affect people’ decision to prefer an autonomous vehicle over a traditional one when using a TNC, several statements with different advantages were presented. The main goal of this section was to understand how likely some benefits would affect the individuals’ decision to choose an autonomous vehicle.
In this case a five-point scale was used in such a way the participants were asked to select “extremely likely, somewhat likely, neither likely nor unlikely, somewhat unlikely or extremely unlikely” for each benefit presented. This scale was taken and adapted from the research of Schoettle and Sivak (2014).
Finally, for the barriers that deter users from choosing an autonomous vehicle when using a TNC, a four-point scale was used (“very concerned, moderately concerned, slightly concerned or not at all concerned”) adapted from the study of Schoettle and Sivak (2014). The main goal of this section was to understand the level of concern regarding some features (like trust, autonomy, surveillance system) when choosing an autonomous vehicle with a TNC.
3.4. Data analysis
3.4.1. Qualitative Research
All interviews were audio-recorded and conducted in Portuguese. Later on those interviews were transcribed carefully into English.
23 3.4.2. Quantitative Research
After gathering all the data needed, the survey was closed and the data was treated. Firstly, from the 253 participants that answered the survey, 87 didn’t finished the survey and 39 answered “No” to the first question (“Have you ever used a Transportation Network Company (like uber, Kapten, Bolt or Cabify) in Portugal?”). For the purpose of this study it will be consider only those who have concluded the survey and answered positively in the first question. Therefore, the final sample was composed by 127 respondents.
Additionally, to test the formulated hypotheses several statistical tests were used taking into consideration the type of data/variables to be tested: Mann-Whitney tests, Spearman’s correlations, binomial tests and cross tabulations. In all statistical tests, a 95% confidence level was assumed which means that the level of significance to reject the null hypothesis was a p-value < 0.05.
4. Results
4.1. Qualitative Analysis
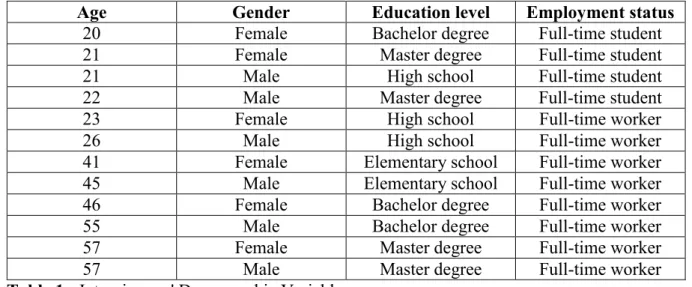
In terms of demographic variables considered for this research, the table 1 shows the age, gender, education level and employment status of all interviewees.
Age Gender Education level Employment status
20 Female Bachelor degree Full-time student
21 Female Master degree Full-time student
21 Male High school Full-time student
22 Male Master degree Full-time student
23 Female High school Full-time worker
26 Male High school Full-time worker
41 Female Elementary school Full-time worker
45 Male Elementary school Full-time worker
46 Female Bachelor degree Full-time worker
55 Male Bachelor degree Full-time worker
57 Female Master degree Full-time worker
57 Male Master degree Full-time worker
Table 1 - Interviewees' Demographic Variables
At the beginning of the interview, all participants already had previous experience with a TNC but in those cases with a traditional vehicle (level 1). Moreover, it appeared that some interviewees already had a notion of the concept of an autonomous vehicle and even one person
24 already had an experience with an autonomous train (vacuum-tube train). Either way, an explanation of both concepts was given together with an image representative of the different levels of driving automation (Appendix 2).
As mentioned before, the interview continues with a closed question: “would you choose an autonomous vehicle when using a Transportation Network Company like Uber?”, as proposed by Brian White and Stephen Rayner (White & Rayner 2014).
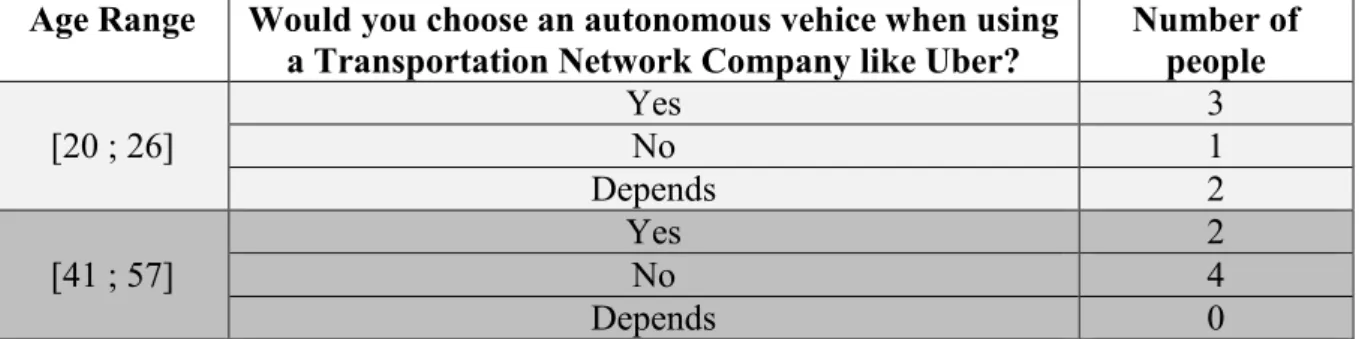
Regarding the respondents’ age, there is clearly an evidence that shows that younger respondents (persons between 20 and 26 years old) are more receptive to the introduction of autonomous vehicles on TNCs, as shown in table 2. By contrast, respondents between 41 and 57 years old are less receptive with 4 (out of 6) adults saying that they would never choose an autonomous vehicle in this industry.
Age Range Would you choose an autonomous vehice when using a Transportation Network Company like Uber?
Number of people [20 ; 26] Yes 3 No 1 Depends 2 [41 ; 57] Yes 2 No 4 Depends 0
Table 2 – Number of people that would choose an autonomous vehicle when using a TNC by age
Additionally to the first question, there is also an evidence of males being more reluctant to choose an autonomous vehicle while using a TNC compared to females (see table 3). This can be explained by the fact that males that were interviewed knew much more about cars than females which affected their decision to choose an autonomous vehicle.
Yes No Depends
Female 4 2 0
Male 1 3 2
Table 3 – Number of people that would choose an autonomous vehicle when using a TNC by gender
Regarding their main motivations/advantages about choosing an autonomous vehicle over a traditional one when using a TNC, in general, all of them referred the convenience and more privacy in the sense that “there is no need for human interaction” (male, 21) as there are
25 no drivers inside the vehicle. Another interviewee stated that this situation of not having a human driver is in line with today’s society - “the capitalism completely changed human relationships and today we have a society more impersonal” (male, 57). At the same time, 7 respondents recognized that using an autonomous vehicle “would be safer because the probability of being involved in an accident would definitely reduce, there is a high number of accidents caused by human error” (female, 57). Besides this reasons, the interviewees also referred more space to more people inside the car, more efficiency due to fastest routes in less time, better punctuality and cheaper than traditional cars (due to the fact that it is a new technology).
When looking to the main barriers although the majority of interviewees recognize that most of the accidents are caused by human errors, they also referred that the autonomous vehicle’ technology doesn’t have the capacity to assess a potential dangerous situation. There are clearly some doubts about the reliability of autonomous vehicles’ technology and the majority of respondents felt that they would be in a position of vulnerability because the fact of not having a human contact raises more uncertainty.
Furthermore, 4 people also mention that they would only trust in this vehicles if they had their own roadways. Finally, people between 41 and 57 years old tend to refer an increase of the unemployment rate due to the fact that there would be no human driver. At the same time one respondent also referred previous accidents with autonomous vehicles.
Regarding the environmental impact question, 10 respondents believed that an autonomous vehicle would definitely be less polluting than a traditional car, as they assumed they would be electric.
Concerning the privacy question, 7 respondents argued that an autonomous vehicle would give them more privacy although all of them recognize that there would be a surveillance system like cameras. The other 5 respondents expressed some concerns regarding the possibility to share personal information between companies like the average time spent on a vehicle and even the possibility to outline a consumer profile.
Lastly, most interviewees see the autonomous vehicles in this industry as a potential alternative to the conventional cars but not a substitute, as “TNCs must always give to the consumer the option to choose” (male, 57). Additionally, some respondents see this vehicles as an alternative only in the medium/long term.
26 4.2.Quantitative Analysis
4.2.1. General Sample Characteristics
As it was previously mentioned, the final sample was composed by 127 valid respondents. In regard to the age, 78.74% of the participants had less than 30 years old with 49.61% of them belonging to the 20-24 range, 16.54% to the 18-19 range and 12.60% to the 25-29 range. The other ranges (21.26% of the sample) were uniformly distributed with the exception of the range with more than 65 years old which didn’t had any respondent. When it comes to gender, the sample was almost evenly distributed with 51.97% of females and 48.03% of them being males. Moreover, 70.08% of participants had a higher education level (37.01% of them had a bachelor’s degree, 32.28% had a master’s degree and 0.79% had a Ph.D.), 28.35% of respondents finished their education in high school (or equivalent) and 1.57% had only the elementary school.
For more detail, the sample characteristics are presented in Appendix 4. 4.2.2. General Results
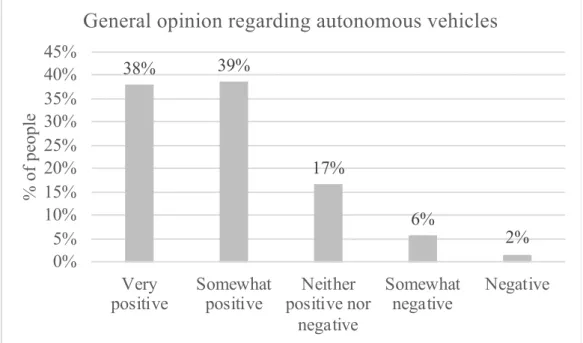
In regards to people’s general opinion about autonomous vehicles (Figure 1), there is clearly a positive scenario with 76% of participants reporting having a very positive or somewhat positive opinion in relation to autonomous vehicles. On the other hand, only 8% of participants revealed a negative or somewhat negative opinion and 17% with a neutral opinion.
Figure 1 - General opinion regarding autonomous vehicles
38% 39% 17% 6% 2% 0% 5% 10% 15% 20% 25% 30% 35% 40% 45% Very
positive Somewhatpositive positive norNeither negative Somewhat negative Negative % o f pe op le
27 When it comes to TNCs (Figure 2), the same scenario can be seen with 96% of participants revealing having a very positive or somewhat positive opinion in regards to TNCs. Indeed, only 2% revealed having a somewhat negative opinion and 2% being neutral.
Figure 2 - General opinion regarding TNCs
Although the positive scenario till this point, in what concerns people’s willingness to choose an autonomous vehicle when using a TNC a different scenario comes out. Indeed, although the percentage of people being willing to choose an autonomous vehicle when using a TNC is still significant (69%), the percentage of people being reluctant about choosing an autonomous vehicle increases to 15% and 15% of people saying that would be “somewhat unlikely” or “extremely unlikely” to choose this type of vehicles.
Figure 3 - How likely would you be willing to choose an autonomous vehicle when using a Transportation Network Company (like Uber)?
57% 39% 2% 2% 0% 0% 10% 20% 30% 40% 50% 60%
Very positive Somewhat
positive positive norNeither negative
Somewhat
negative negativeVery
% o f pe op le
General opinion regarding TNCs
25% 44% 15% 13% 2% 0% 5% 10% 15% 20% 25% 30% 35% 40% 45% 50% Extremely likely Somewhat likely Neither likely nor unlikely Somewhat unlikely Extremely unlikely % o f pe op le
How likely would you be willing to choose an autonomous vehicle when using a Transportation Network Company (like Uber)?
28 4.2.3. Hypotheses testing
H1: Younger people (21-30 years old) are more receptive to choose an autonomous vehicle in the shared-mobility industry (TNC).
To address the first hypothesis, it was created two different age groups: people with less than 30 years old (that included the age ranges 18-19, 20-24 and 25-29 from the survey) and people with 30 or more years old (that included the other age ranges). The purpose of this two age groups was to understand if there was evidence that confirmed the hypothesis formulated. To test their receptivity to choose an autonomous vehicle with TNCs the answers from question 5 (how likely would you be willing to choose an autonomous vehicle when using a Transportation Network Company (like Uber)?) were analyzed by conducting a Mann-Whitney Test. As in this case the dependent variable is ordinal (age), this nonparametric test allows to compare if there are differences between the two age groups. The results of this test (Appendix 5) show a p-value = 0.020 (<0.05) which means that the null hypothesis can be rejected and there is in fact differences between the two groups with regard to their receptivity to choose an autonomous vehicle when using a TNC. Moreover, the results from Appendix 6 show a Mean Rank lower to the second group (with 50.19), which include the individuals with more than 30 years old, compared to the younger ones (with 67.73). This means that the older people that answered to this survey is more willing to choose an autonomous vehicle compared to the younger ones, when using a TNC.
To get a further understanding about the answers given by the two age groups to question 5, a cross-tabulation was made (Appendix 7) where it can be seen that 66% of people with less than 30 years old answered positively about their willingness to choose an autonomous vehicle compared to 73,80% of people with more than 30 years old.
In summary, all the analysis conducted to test the first hypothesis show that, in fact, people with more than 30 years old that answered to the survey have a greater tendency to choose an autonomous vehicle when using a TNC, compared to the younger ones (with less than 30 years old).
H2: Men are more likely to choose an autonomous vehicle in this industry than women. Similar to what was previously done, to test this hypothesis a Mann-Whitney Test was conducted in order to assess if there are in fact differences in the answers given to question 5 (how likely would you be willing to choose an autonomous vehicle when using a Transportation Network Company (like Uber)?) between the two genders (female and male). As seen in appendix 8, the p-value = 0.080 (>0.05) which means that the null hypothesis (both genders
29 have the same receptivity to choose an autonomous vehicle when using a TNC) cannot be rejected. However, the mean rank (appendix 9) in this case is 58.38 for males and higher for females with 69.20 which allows to conclude that males are more likely to choose an autonomous vehicle when using a TNC compared to females although it is not significant (due to the p-value from the Mann-Whitney test). Moreover, in the cross-tabulation (appendix 10) the same idea can be confirmed: 75.4% of males answered that it would be extremely or somewhat likely to choose an autonomous vehicle when using a TNC compared to only 63.6% of females.
Furthermore, when analyzing people’s general opinion regarding the autonomous vehicles and the TNCs there is clearly a tendency of males to have a more positive opinion regarding autonomous vehicles compared to females corroborated by a p-value < 0.001 ( when looking to the Mann-Whitney test results and the mean rank - appendix 11 and 12).
H3: There are a positive correlation between the willingness to ride on an autonomous vehicle and the level of education.
To assess this hypothesis a Spearman’s Correlation was conducted in order to test if there is in fact a relation between the willingness to ride on an autonomous vehicle (assessed on question 5) and the level of education. This model (Spearman) was chosen because in this case the variables are both qualitative and ordinal. The results (Appendix 13) show a correlation coefficient = 0.035 and a p-value=0.696 (>0.05) which means that the null hypothesis, that says that there is no correlation between the two variables, cannot be rejected. Therefore, through this data the third hypothesis cannot be confirmed.
H4: The employment status has a significant impact in the willingness to choose an autonomous vehicle with full-time employed individuals and full-time students being more
likely to ride on an autonomous vehicle.
To test this hypothesis, inside the employment status variable, two new categories were created: the first category including people that were “full-time student” and “full-time worker” and the second one with the other employment status (that included “part-time worker”, “student and worker”, “unemployed” and “other”).
To compare both categories a Mann-Whitney Test was conducted (Appendix 14) where the p-value = 0.136 (>0.05). This means that the null hypothesis cannot be rejected and both groups have the same distribution regarding their willingness to choose an autonomous vehicle when using a TNC, although there are some differences in the Mean Ranks of both groups (Appendix
30 15). On the other hand, the same idea can be confirmed through the cross-tabulation (Appendix 16). Indeed, 68.3% of full-time workers and students answered positively relatively to their willingness to choose an autonomous vehicle when using a TNC compared to 68.4% of other people.
H5: People believe that choosing an autonomous vehicle would reduce the probability of having an accident, when using a shared-mobility service (TNC).
In order to assess this hypothesis, the participants had to rate how likely they believed that a decrease in the number of accidents would happen when using an autonomous vehicle and would affect their decision to choose this type of vehicle when using a TNC.
To test this hypothesis, two groups were created: group 1 included the ones that answered “extremely likely” or “somewhat likely” and group 2 included the ones that answered “neither likely nor unlikely”, “somewhat unlikely” or “extremely unlikely”.
By conducting a Binomial Test (Appendix 17) it can be seen that 80% of participants answered positively which means that they believed that a decrease in the number of accidents would be a reason to choose an autonomous vehicle when using a TNC. Moreover, the p-value < 0.001 is statistically significant which means that the null hypothesis can be rejected (both groups don’t have the same proportion meaning that according to the sample people believe that choosing an autonomous vehicle reduce the probability of having an accident). Therefore, the data from the survey corroborates this hypothesis.
H6: People expect autonomous cars to be more environmentally sustainable. As it was previously done, a Binomial Test was conducted in order to assess if there are in fact a different proportion of answers between the ones that believe that the autonomous vehicles are more environmental-friendly and the ones that believe in the opposite. In this case, for question 7 (How likely do you think “lower polluting vehicle emissions” would encourage you to prefer a vehicle with full-automation [Level 5] over a traditional vehicle [level 1] while using a Transportation Network Company (like Uber)?), two groups were created: group 1 included the ones that answered “extremely likely”, “somewhat likely” or “neither likely nor unlikely” and group 2 included the ones that answered, “somewhat unlikely” or “extremely unlikely”. The results from the Binomial Test (Appendix 18) show that 95% of participants answered positively which means that in fact people expect that the autonomous vehicles will be less polluting to the environment when compared to vehicles from level 1 and therefore that would affect their decision to choose this type of vehicles. Moreover, the p-value is inferior to
31 0.001 which means that the null hypothesis can be rejected and the data validates the hypothesis formulated.
H7: The lack of trust in technology is a main barrier that deter users from choosing an autonomous vehicle in the TNC industry.
In line with the previous hypothesis, a Binomial Test was also conducted in this case. Additionally, two groups of answers were created: the first one including the ones that answered “very concerned” or “moderately concerned” and the second one including the ones that answered “slightly concerned” or “not at all concerned”. As the p-value=0.050487 we cannot reject the null hypothesis and confirm that the lack of trust in technology is a main barrier that deter users from choosing an autonomous vehicle in the TNC industry (Appendix 19).
H8: People see the autonomous vehicles as a threat to their privacy.
Regarding the privacy, three questions were made: question 13 related to the collection and use of personal information, question 14 related to the surveillance systems (like cameras) and question 15 referring to the system security (e.g. cyber-attack). In each question, the participant could answer 1- “Very concerned”, 2-Moderately concerned”, 3-“Slightly concerned” or 4-“Not at all concerned”.
To test the hypothesis made, firstly the answers given to those three questions were grouped in only one category. By grouping the answers given to questions 13,14 and 15 in only one variable, the answers could range between 3 (if they answered “very concerned” in those three questions) and 12 (if they answered “not at all concerned” in both questions).
Then, it was assumed a cut-off point of 6 between the ones that were more concerned with some privacy threat situations (group 1) and the ones that were less concerned with their privacy when choosing an autonomous vehicle (group 2).
A Binomial Test was conducted (Appendix 20) and the results revealed a p-value=0.013 (<0.05) which means that the null hypothesis can be rejected. Moreover, 61% of people expressed being “very concerned” or “slightly concerned” with their privacy when using an autonomous vehicle.
H9: People believe there is a high probability of the autonomous vehicle’ system failing to react to possible external environmental threats.
Lastly, to test this hypothesis the participants were asked to answer question 16 where they had to express their level of concern regarding the capacity of the autonomous vehicle to react
32 to potential external threats (like pedestrians). As previously done, the ones that answered “very concerned” or “slightly concerned” were grouped in one category (group 1) and the other ones were grouped in another category (group 2). The results (Appendix 21) show that 78% of participants expressed a certain concerned regarding the capacity of the vehicle to react to external threats. Moreover, the p-value < 0.001 which means that the null hypothesis (that says that both groups had the same proportion) can be rejected.
5. Discussion
The main purpose of this research is to explore the consumers’ perception about using an autonomous vehicle when using a shared-mobility service (particularly with TNC) in Portugal by focusing on the main user profile of this type of vehicles when using a TNC, their motivations and barriers. In this chapter, some conclusions will be discussed based on the results obtained in the qualitative and quantitative research as well as the literature review previously presented. Moreover, some limitations and suggestions for future research will be discussed.
5.1. Main conclusions
The present dissertation sought to study the consumers’ perception about using an autonomous vehicle when using a shared-mobility service (particularly with TNC) in Portugal by focusing on their motivations, barriers and the consumer profile that is most attracted by the implementation of this type of vehicles in this industry.
From the results presented above, in general, people that use Transportation Network Companies in Portugal tend to have a positive opinion regarding these companies and the service they provide. Also, in line with this, people tend to have a positive opinion regarding autonomous vehicles. However, there is still a certain hesitation towards the openness to choose an autonomous vehicle in this industry.
In what concerns the main user profile that is most attracted to the implementation of autonomous vehicles by TNCs, although in the qualitative research there was clearly an evidence of younger people being more receptive to choose an autonomous vehicle when using a TNC in Portugal, the data from the survey suggests that people with more than 30 years old is more willing to choose an autonomous vehicle compared to the younger ones. This goes against with what Schoettle & Sivak (2014) found out in their study made in the U.S., U.K. and
33 Australia that revealed that older people were less receptive than younger people to ride in an autonomous vehicle. However, with regards to the gender, the results are different. Men tend to have a more positive opinion regarding autonomous vehicles than woman which is aligned with the Schoettle & Sivak research (2014). On the other hand, the data from the survey doesn’t allow to conclude any relation between the employment status and the level of education with people’s willingness to choose an autonomous vehicle in the TNC industry.
Moreover, with respect to respondents’ motivations, the findings allows to conclude that people believe that when using an autonomous vehicle the probability of having an accident would substantially decrease and therefore that would be safer to choose this type of vehicles compared to conventional vehicles. In fact, people often expressed, on the qualitative research, some concerns regarding having an accident caused by the driver when using a TNC or even the way they drive which makes sense as in the U.S. 94% of vehicle accidents were due to human performance errors – driver (Singh, 2015). At the same time, 95% of people that answered to the survey believe that the autonomous vehicles will be less polluting to the environment compared to conventional vehicles and therefore that would be a reason to choose this type of vehicles. Both motivations are in line with the Winkler et al. study (2019). Indeed, “people commonly conflate AV technology with electric vehicles” although the autonomous vehicles can be either electric or gasoline-powered (Browne 2019).
Furthermore, the findings of respondents’ barriers clarify that privacy issues are an important barrier that deter users from choosing an autonomous vehicle in this industry mostly regarding the collection and use of personal information, surveillance systems and the system security which is aligned with past literature (Glancy, 2012). On the other hand, the results also showed that 78% of participants expressed a certain concerned regarding the capacity of the vehicle to react to potential external threats like pedestrians which corroborates the Schoettle and Sivak research (2014). Indeed, there are still some hesitation regarding the autonomous vehicles’ system.
Considering all the findings, TNC’ consumers in Portugal seem to have a positive opinion regarding the autonomous vehicles and their implementation by TNCs, although there is still a certain hesitation about security and its capability to react to external threats. Yet a focus on people’s motivations together with a good marketing strategy, it is possible that the autonomous vehicles can become a lucrative option for TNCs in Portugal and a real option in the consumers’ lifestyle.