The Lean Startup Toolkit
An Assembly Of Ready To Use Tools To Build A Lean Startup
MASTER THESIS
Dissertation submitted in partial fulfillment of requirements for the degree Master of Science in International Business Administration
At Universidade Católica Portuguesa
Católica Lisbon School of Business and Economics
Author: Markus Balser
Supervisor: Francesco Castellaneta
Abstract (English) Dissertation title:
The Lean Startup Toolkit - An Assembly Of Ready To Use Tools To Build A Lean Startup Author:
Markus Balser
The Lean Startup Methodology (LSM) has become a popular approach for many early stage startups. However, related literature is very fragmented with no clear instructions on how to use the methodology properly.
Therefore, the aim of this thesis is to create a comprehensive and ready to use toolkit for the LSM, which can be used by anyone who is involved in the process of starting a business. In a first part of this thesis, the Business Model Canvas, Customer Development and Agile Development are identified as the key principles of the LSM. After the principles have been outlined and defined, the section continues to describe the logic of how the different principles interconnect with each other throughout the Lean Startup process.
In a second and main section of the thesis, the three key principles are explained separately in greater detail. Every principle is linked to a set of specific tools and examples of how to facilitate their usage successfully are described. Those tools do not only draw on known approaches of the LSM, but also new methods from adjacent areas have been analyzed, adapted and applied for a comprehensive analysis.
In conclusion, the thesis developed a ready to use toolkit, which comprises the newest adaption on the original Lean Startup manifesto and combined new and old concepts with practical examples. Herewith, the hampering gaps between theory and practice, which were not yet closed through the already presently available literature, have been closed.
Abstract (Portuguese) Título:
O Lean Startup Toolkit – Um conjunto de ferramentas para a construção de uma Lean Startup Autor:
Markus Balser
A metodologia de Lean Startup tem vindo a tornar-se numa abordagem popular para muitas startups em fase inicial. No entanto, a literatura disponível é bastante fragmentada e não apresenta instruções claras sobre a metodologia de abordagem correcta.
Consequentemente, o objectivo desta tese é criar uma ferramenta completa e de fácil utilização para o LMS, de forma a poder ser utilizada, por qualquer pessoa, no desenvolvimento inicial de um negócio.
Na primeira parte deste trabalho o Modelo de Negócio Canvas, Desenvolvimento do Cliente e Agile são identificados como princípios fundamentais do LSM. Posteriormente aos princípios terem sido identificados e delineados, segue-se uma descrição lógica de como os diferentes princípios se interconectam através do processo de Lean Startup.
Na segunda, e principal secção da tese, os três princípios principais são explicados separadamente com mais profundo. Cada princípio está ligado a um conjunto específico de ferramentas, que são descritos com exemplos de utilização sucedidas. Estas ferramentas não são só baseadas em abordagens conhecidas, mas também em novos métodos de áreas adjacentes foram analisadas, adaptadas e aplicadas de forma a conduzir uma análise mais abrangente.
Em conclusão, esta tese desenvolveu uma ferramenta pronta a utilizar, que inclui a mais recente adaptação do original método de Lean Startup e a combinação de novos e antigos conceitos com exemplos práticos. Com este trabalho as limitações que dificultaram a teoria e prática, que ainda não foram abordadas e resolvidas na existente literatura, foram solucionadas.
Table of Content
Abstract ... I/II Table of Content ... III List of Abbreviation ... IV List of Figures ... V
1 Introduction ... 1
1.1 Problem Definition and Objective ... 1
1.2 Course of Investigation ... 2
1.3 Data Collection ... 2
2 Lean Startup Movement ... 2
3 The Lean Toolkit ... 5
3.1 Tools For Business Model Canvas ... 5
3.1.1 Customer Segments ... 6 3.1.2 Value Proposition ... 8 3.1.3 Channels ... 12 3.1.4 Customer Relationship ... 13 3.1.5 Revenue Streams ... 15 3.1.6 Key Resources ... 16 3.1.7 Key Activity ... 16 3.1.8 Key Partnerships ... 16 3.1.9 Cost Structure ... 17
3.2 Tools for Customer Development ... 17
3.2.1 Customer Discovery Phase ... 18
3.2.2 Customer Validation Phase ... 26
3.3 Tools To Create A MVP ... 32
3.3.1 Story Mapping ... 33
3.3.2 Kano Model ... 35
3.3.3 MVP Techniques ... 36
4 Conclusion And Outlook ... 39 Literature ... VI Appendix ... XI
List of Abbreviation
ARPA - Average Monthly Revenue Per Account ARPU - Average Monthly Revenue Per User BMC - Business Model Canvas
B2B - Business-to-Business B2C - Business-to-Consumer CAC - Customer Acquisition Costs COAC - Cost Of Customer Acquisition LSM - Lean Startup Methodology LTV - Customer Lifetime Value MVP - Minimum Viable Product SaaS - Software-as-a-Service SAM - Served Available Market SEM - Search Engine Marketing SEO - Search Engine Optimization TAM - Total Addressable Market VPC - Value Proposition Canvas
List of Figures
Figure 1: Build-Measure-Learn Loop ... 3
Figure 2: Business Model Canvas ... 6
Figure 3: Customer Segmentation ... 8
Figure 4: Value Proposition Canvas ... 10
Figure 5: Value Curve Example Cirque du Soleil ... 12
Figure 6: Channel Types and Channel Phases ... 13
Figure 7: Customer Development Model ... 18
Figure 8: Overview Analytic Tools ... 26
Figure 9: AARRR Dashboard ... 28
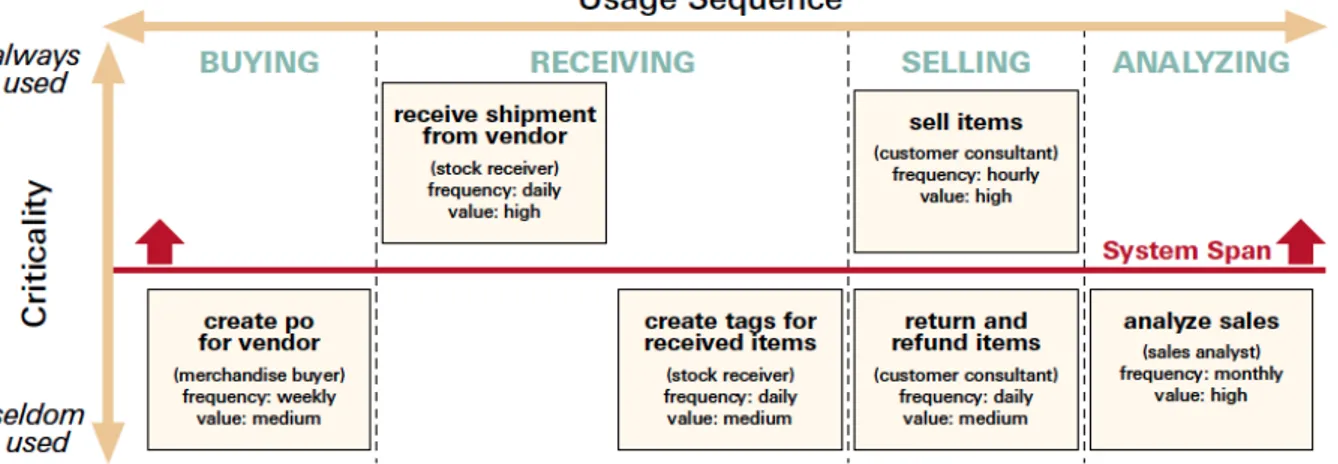
Figure 10: Story Mapping Example ... 34
Figure 11: Kano Model ... 36 Figure 12: Build-Measure-Learn Loop Update ... XI Figure 13: Lean Canvas ... XII Figure 14: Business Model Ryanair ... XIV Figure 15: 55 Tested Information Products ... XVII Figure 16: Cohort Activation Funnel ... V Figure 17: Dropbox - Activation follow up ... VI Figure 18: Retention Cohort by Join Date ... VII Figure 19: Groove - Retention Mail ... IX Figure 20: HubSpot LTV overview ... XII Figure 21: Metrics Overview ... XII Figure 22: Kano Questionnaire ... XIV
1 Introduction
1.1 Problem Definition and Objective
Startups usually develop products under conditions of great uncertainty. Therefore, the concept of the Lean Startup, which adds a scientific component to starting a company, gained wide popularity over the last years and is a process a lot of startups follow today. The approach is already practiced in 631 cities and 83 countries around the world, and is growing further.1 Its main benefit for startups is to get feedback from an early stage onwards on their business or idea, thereby reducing the risk of wasting time and money on something nobody is interested in.
However, while searching through the literature one can notice that there is no sufficient tool, which can be used to follow step by step during the entire Lean Approach. In addition, the original Lean Startup manifesto is already four years old, a long time in this fast moving environment. This deficit is enhanced when considering the fact that one of the three main principles the Lean Approach draws on nowadays was not yet developed, when Ries´ book “The Lean Startup”, which builds the core of the movement, was initially published. Over time the developed content and methods were evolved and updated and new approaches have been brought together through blog posts, articles and presentations from several practitioners. Nevertheless due to their nature, these newly added methods and recommendations are usually fragmented and tied to a specific issue, without showing the big picture. Furthermore, a lot of times the recommendations are general in nature and do not indicate a specific action. To implement them, one has either to conduct further research or sign up for expensive one-on-one workshops.
“Though Business Model Generation was already pretty practical we
didn't really follow a step-by-step approach, which is typically something you would get in a training workshop or from a consultant.”
-Alexander Osterwalder
Being interested in entrepreneurship myself; I was personally confronted with the described research gap. Therefore, the aim of this thesis is to fill this research gap by creating a ready and easy to use toolkit, which includes all principles and the newest approaches used in
practice. The toolkit is intended for everyone who is eager to start a business using this approach, professors that teach it or incubators or mentors, who are involved in the process of building a business.
1.2 Course of Investigation
The thesis is split into three parts; The first part is a literature review on the principal of the Lean Startup. This part will outline the main principles and the logic behind the Lean Startup Methodology (LSM). The second part presents the development of the toolkit, with the focus on the three pillars: Business Model Canvas (BMC), Customer Development and Minimum Viable Product (MVP). All three pillars are looked at in more detail, by providing explanations on how to use them and by providing examples from the real world. The last part of the thesis will be the conclusion with the final outcome of the research and the recommendation for the future.
1.3 Data Collection
Being still a quite young approach, the data collection for this thesis is more practical oriented. Most of the concept’s success has not yet been proven empirically and therefore relies on stories from peopled who pioneered the approach or entrepreneurs that gathered practical experience by applying the approach. Therefore, the collected data for this thesis will not just be limited to classical literature, such as books and academic journals, but rather extended to experience reports, blogs, videos and lecture slides. Nevertheless, trying to ensure validity of those, only protagonists who showed experience and knowledge about the methodology have been included. Knowledge has either been demonstrated through written work or teaching and mentoring engagement, which reflects in reputation, popularity and activity. In addition, practical experiences from applying the methodology or being involved in a startup have been anticipated, with the aim to gather best practices and real life examples.
2 Lean Startup Movement
The Lean Startup is a term popularized by Eric Ries, first through his blog and later through his bestselling book “The Lean Startup: How Today's Entrepreneurs Use Continuous Innovation to Create Radically Successful Businesses”. Ries’ inspiration for the idea of the Lean Startup can be found in the philosophy of lean manufacturing (Ries, 2011). Lean
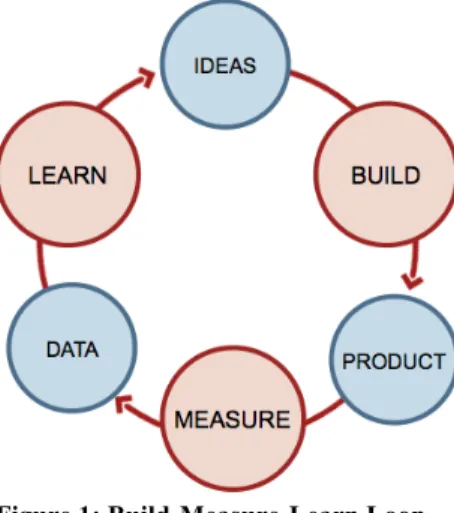
manufacturing has its origin within Toyota in Japan and describes the process of decreasing cycle time and minimizing waste throughout the entire production process, in order to create value through qualitative products (Womack & Jones, 1996). Ries adapted this process to entrepreneurship, with the idea of bringing a new development approach to building innovative products and startups (Ries, 2011). The aim is hereby to decrease waste in order to increase the probability of successfully building a startup, given the fact that startups are creating products or services under conditions of great uncertainty (Ries, 2011). The improvement of success is reached through fast iterations and validated learning, which means learning how to build a sustainable business by constantly running experiments. This calls for startups to pass through a build-measure-learn feedback loop relentlessly, which lies at the core of the Lean Startup model. The build-measure-learn loop describes a process that starts by generating ideas, leading to build a product or experiment and finally measuring the expectations throughout the experiments. Moreover, its central aim is to learn from the experiments´ outcomes and as a result possibly update the old ideas respectively, generating new ones, before entering the loop again. It is important to note that the step “build” does not necessarily imply a final product as an outcome, but rather something that can be used for testing (Blank, 2015). Figure 1 shows a graphical illustration of a standard build-measure-learn loop.Blank recently updated the loop by renaming the terms to reduce ambiguities. The adopted loop is illustrated and explained in Appendix 1.
Figure 1: Build-Measure-Learn Loop
In order to execute the loop properly, the LSM draws on three key principles. Firstly the “BMC”, a tool to describe a business model in one page using the nine core building blocks of a business. Secondly “Customer Development”, a process for testing hypotheses and assumptions made about the product or service by talking to potential customers. Thirdly, Agile Development, by using a “MVP”, a product with core features to gather feedback
(Blank, Engel, & Hornthal, 2014). Each of the three tools has a specific function within the Lean Startup process, as explained in the following.
At the beginning of every venture an entrepreneur starts with a vision. This vision and its underlying business assumptions are captured in the BMC. However, the BMC is not static, but rather a scorecard, which is updated regularly with new insights throughout the further progression (Blank & Dorf, 2012b). In the next step of the process, a startup translates the assumptions of the BMC into falsifiable hypotheses. Those hypotheses are then tested, utilizing the Customer Development model and the MVP, which is embedded in the Customer Development process.
In the first phase of the Customer Development model, the Customer Discovery phase, several rounds of interviews to potential customers are conducted. In the first round of interviews, a startup wants to test its problem hypotheses in order to validate whether the identified problem is worth solving. In case the hypotheses have been invalidated, a startup has the option to exit, iterate or pivot, meaning it changes strategy while keeping the overall vision. (Cooper & Vlaskovits, 2010). Using the terminology of the build-measure-learn loop for the just described process: A startup “builds” a problem interview, it “measures” the interview outcome against the expectations and “learns” from the outcome in order to update the BMC and retrieve further actions. This loop is repeated until a startup validated its problem hypotheses and found a problem worth solving (Osterwalder, Pigneur, Bernarda, Smith, & Papadakos, 2014).
After the problem has been identified a startup enters a new loop and “builds” its solution accordingly, representing the first Prototype. Afterwards it “measures” the responses to the proposed solution through another round of interviews, in order to “learn” if the solution matches the identified problem. From the outcome of the interview a startup has again to decide whether to exit, iterate or pivot (Osterwalder et al., 2014).
In case all hypotheses of the problem and solution were validated, a startup found problem/solution fit and continues with the next step of the Customer Development process, the Customer Validation phase (Osterwalder et al., 2014). During the Customer Validation a startup “builds” a MVP and starts selling it to early customers. The selling process is then “measured” by using priorly defined metrics in order to “learn” and propose new actions. After every round of testing, a startup has still to decide whether to exit, iterate or pivot. This
process is repeated until a scalable business can be validated (Blank & Dorf, 2012b). If scalability cannot be found, a startup might pivot within the Customer Validation phase or pivot all the way back to Customer Discovery phase.
To summarize the LSM, it can be concluded that the three principles: BMC, Customer Development and MVP are means to test hypotheses while running as quick as possible through a build-measure-learn loop in order to reduce waste.
3 The Lean Toolkit
After the three main principles of the LSM have only been introduced briefly in the previous chapter, this section of the thesis will present the developed toolkit and explain the principle in more detail. The toolkit will start with tools for the BMC, followed by tools for the Customer Development model and conclude with those of the MVP.
3.1 Tools For Business Model Canvas
As the BMC is used to capture a founder’s initial vision, the BMC is the first principle that will be elaborated for the toolkit, in the following section.
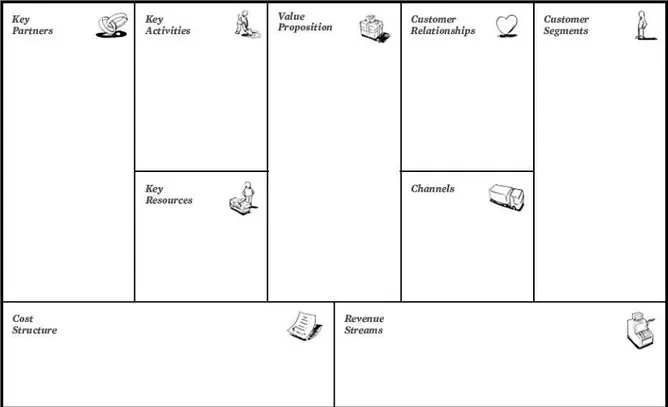
The BMC by Alexander Osterwalder is a tool with the aim to create a shared language for describing, measuring and manipulating business models and accordingly creating new strategies. A business model is hereby defined as the foundation of how an organization creates, delivers and captures value. The canvas itself consists of nine building blocks, which reflect the core areas of a business, in order to make money (Osterwalder & Pigneur, 2010). Another practitioner, Ash Maurya, adapted the canvas with a stricter focus on early startups. Therefore, Appendix 2 will take a closer look at this canvas as well.
In the following section, the building blocks of the original canvas, which can be seen in Figure 2, are analyzed in greater detail, presenting practical examples of Nespresso, Nespresso is a brand by Nestlé, which popularized portioned premium coffee through capsules. Another example of a successful business model can be found in Appendix 3. Against natural intuition, the BMC is used from right to left starting with the Customer Segments, which embrace the heart of a business. Afterwards, the Value Proposition is defined, followed by the Channels, Customer Relationship and Revenue Streams. Lastly, the
Key Resources, Key Activities, Key Partners and the Cost Structure are filled (Strategizer, 2011).
Figure 2: Business Model Canvas
3.1.1 Customer Segments
A customer segment represents the different groups of customers or enterprises a business wants to reach and serve. Since customers are at the heart of every business, a startup should start with segmenting the customers into different groups, to better serve and satisfy their needs. The different types of customer segments are presented in the following (Osterwalder & Pigneur, 2010).
Mass Market: In this case a business does not distinguish between different customer segments and addresses rather a large group of customers with mostly similar interests. An example would be Nescafé from Nestlé, serving instant coffee to households in general. Niche Market: A business that targets a niche market is focused on a small subset of the market, which represents a specific and specialized customer segment. Often times an example for niche market can be found in the automotive industry, where small car part manufactures are specialized in producing a specific part for an automobile manufacturer.
Segmented: A segment defines a group of people with the same problem and needs. Some business models focus on more than one target customer and therefore define different segments, which differentiate slightly in their needs and problems. Nespresso for example focuses on two customer segments, households and offices. Both segments have similar, but slightly varying needs and problems (Osterwalder & Pigneur, 2010).
Diversified: In contrast to a segmented market, a diversified customer segment occurs, when a business focuses on customer segments, which are unrelated to each other, having different needs and problems. Amazon for example diversified its retail customer segment by offering online storage space and on-demand server usage.
Multi-sided Platform: A multi-sided platform or multi-sided market occurs when a company serves two or more independent segments. Both segments are hereby necessary in order to make the business model function (Osterwalder & Pigneur, 2010). EBay for examples needs buyers as well as sellers in order to make the platform work.
Customer Segmentation Tool
In order to define the right customer group and address the according segment adequately, specific segmentation criteria should be applied. The following segmentation tool section will outline an overview of categories and variables, which give assistance in the process of defining a meaningful customer segment.
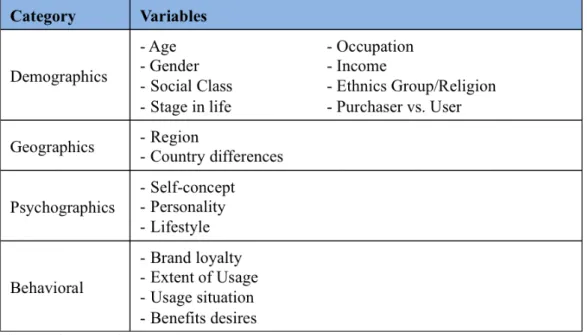
In general a market can be separated by using four types of segmentation: Demographic Segmentation, Geographic Segmentation, Psychographic Segmentation and Behavioral Segmentation. Each category consists of different variables, as it can be seen in Figure 3. Hereby, Demographic and Geographic variables are hard facts and therefore easier to measure. Even though, Psychographic and Behavioral variables are rather soft facts, which cannot be measured easily, they can give a higher predictability of the consumer choice behavior, which is relevant to create the right product for the right customer.
Figure 3: Customer Segmentation
In order to create a valid customer segmentation, different criteria should be met, such as those outlined below (Solomon, Bamossy, Askegaard, & Hogg, 2013):
- Consumers have similar product needs within one segment, which differ with needs of other segments
- Differences among segments can be identified - Segment is large enough to be profitable
- Consumers in a segment can be reached through certain marketing activities - Consumers within a segment will react to the designed market activities
Example: Urban Ladder, an Indian ecommerce shop for furniture, defined its target segment as, families who live in urban cities, earning upwards of one lakh2 per month and are digitally savvy, probably married and who have recently bought a new house or are set to move into a newly rented house. As it can be noticed from this practical example, Urban Ladder used at least one variable of each category to narrow down its target customer (Rammohan, n.d.). 3.1.2 Value Proposition
The Value Proposition describes the value that is created through the company’s product or service for a specific customer segment. Hereby, it solves the customer problems and serves its needs and is the reason why customers choose this particular product over another.
Value for the customer can be created through a mix of characteristics, whether they are qualitative, such as design, or quantitative, such as price. Elements, which can contribute to the creation of value are:
• Newness by satisfying a new need
• Performance, by improving a product or service
• Customization, by tailoring products and services to a customer’s individual needs • Design, creating value for some, but is hard to measure
• Brand/Status, creating value to an owner of a product by showing value to others such as wearing a Rolex
• Price, by offering lower price for price sensitive users
• Cost reduction, Accessibility, making products and services available for a wider user group
• Convenience/Usability by making it easy to use (Osterwalder & Pigneur, 2010) After identifying the appropriate Value Proposition, a startup should come up with a clear statement, which states how the product is solving the customers’ problems, how it is delivering value and why the customer should choose the product instead of a competitor (Laja, 2012). In addition, this statement should be clear and easy to communicate to stakeholders (MaRS, 2012a).
Nespresso’s Value Proposition for example is: “High-end restaurant quality espresso at home” (Osterwalder & Pigneur, 2010).
Value Proposition Tools
In the following two tools, which help to define the Value Proposition, are presented and explained. Those tools are the Value Proposition Canvas and the Value Curve.
Value Proposition Canvas
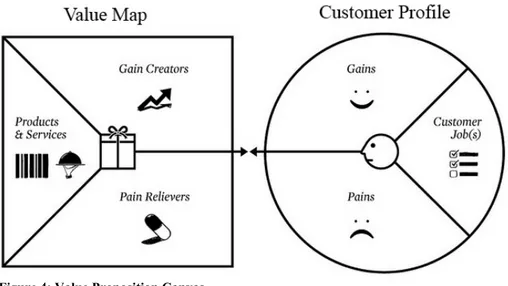
The Value Proposition Canvas (VPC), also introduced by Alexander Osterwalder, is a plug-in tool for the original BMC. Instead of focusing on the entire business model, the VPC specifically focuses on the Value Creation for the identified Customer Segments in the BMC (Osterwalder, 2012). The aim of the VPC is to explain in detail how products and services are created, which are desired by the customers (Osterwalder, 2014). Hereby, the VPC consists of
two elements, the Customer Profile on the right and the Value Map on the left, which create a fit between each other. Similar to the BMC, the VPC is used from right to left. First the Customer Profile has to be understood, to create a matching Value Map.
Figure 4: Value Proposition Canvas
The Customer Profile represents a specific customer segment previously defined in the BMC. To better understand the needs of this specific customer segment, the customer profile uses three building blocks: The first block describes the Customer Jobs, which are tasks a customer wants to accomplish, either in his private live or professionally. The next field describes the Pains a customer is experiencing before, whilst or after solving his jobs. Finally, the last field of the customer profile lists the Gains a customer is hoping to get from solving the job. Some outcomes are hereby expected or desired and others would surprise the customer (Osterwalder et al., 2014). Similar to the BMC, the VPC should use different Customer Profiles for different Customer Groups (Garner, 2015).
As an example for private persons, Nespresso could define the Customer Jobs as, brewing high quality coffee, enjoying good coffee at home and serving good coffee to guests. The Pains a customer is experiencing are expensive espresso machines and the maintenance of machines. The Gains a customer is hoping for are fast and tasteful espresso and easy to handle machine.
The Value Map on the left breaks down the value proposition of a business and describes it in a more detailed way, by also using three fields. The first field describes the Products & Services a startup is offering, in order to help the customer accomplish the jobs. The next field describes the Pain Relievers, which represent the solution to the experienced customer
pains before, during or after accomplishing the jobs. Hereby, a startup is focusing on the most urgent pain, instead of trying to address every pain point. The last field, Gain Creators, lists how the products or services create a customer gain. Similar to the pain relievers, a startup should only focus on the important gains and not on every gain (Osterwalder et al., 2014). The Products or Services in the Nespresso example are coffee machines with an easy to use capsules system. The Pain relievers are realized through moderately priced machines and true espresso experience. Finally, the Gain creators are the brand and shopping experience as well as the elegant machine design.
Value Curve
The Value Curve or Strategy Canvas is a strategy framework to map one’s own Value Proposition against the current state of the market space. The concept emerged originally from the Blue Ocean approach, because it shows where a company can differentiate itself from other market participants and find a niche, respectively a Blue Ocean, to market itself. Hereby, the horizontal axis accounts for the range of factors important for the industry and the vertical axis for the offering level, where high means the company is offering more and vice versa (Kim & Mauborgne, 2005).
The Figure on the next page shows an example of the Value Curve of Cirque du Soleil in comparison to regular circuses. As one can observe, Cirque du Soleil differentiates itself in the offered value and even added some new factors on the horizontal axis. Contrastingly to regular circuses, Cirque du Soleil does not include any start performers or animals in their show. They also cut out aisle concessions and multiple show arenas, which are usually found in a circus. In this characteristics Cirque du Soleil already differentiated itself. Even further, Cirque du Soleil added themes, a refined watching environment, multiple productions and artistic music and dance, things a regular circus does not offer at all. Therefore, Cirque du Soleil was also able to charge a higher price for their shows.
Figure 5: Value Curve Example Cirque du Soleil
Since an entrepreneur usually tries to solve a problem, which has not yet been solved, the value delivered should differentiate itself from existing solutions. Existing solutions do not necessarily have to come from direct competitors, but also from indirect competitors solving the current customer`s pain. This can be seen currently in Germany, where startups for intercity busses are on the rise, competing mainly against German Railways.
The Value Curve offers a nice overview, which sets the base for the Value Proposition hypotheses that need to be tested afterwards.
Appendix 4 includes two additional tools, which are not directly part of the BMC, but which logically follow the Customer Segmentation and the Value Proposition. The two tools enable a startup to predict the market size and identify the market a startup is operating in.
3.1.3 Channels
Channels define how the company is reaching and delivering its value proposition to the pre-defined customer segment. The communication, distribution and sales channels connect the company with the customers and have several functions, such as raising awareness of the products, helping the customers to evaluate the value proposition, allowing to purchase the product or service, delivering the value proposition or providing post-purchase service. The channels can be differentiated into direct and indirect channels, as well as owned and partner channels. Owned channels include a Sales force, Web sales or Own Stores and Partner
channels include Partner stores and Wholesaler. An overview of the channel types and the phases are can be found in Figure 6.l
Figure 6: Channel Types and Channel Phases
Within the five phases, a startup is not fixed of choosing just one channel type, but also a mix is possible (Osterwalder & Pigneur, 2010). This means a startup could create Awareness through a Salesforce and the purchase is made through the Owned Stores.
Besides from differentiating between Partner and Owned types, Channels can additionally be differentiated between Paid and Free. Free channels are Search Engine Optimization (SEO), Social Media and Blogging. Important to note is, that free channels are not completely free per se, since they involve costs for human resources. Paid channels are: Search Engine Marketing (SEM), Affiliates or Offline ads (Maurya, 2012a).
Again in the example of Nespresso, a mix of channel types was chosen. Nespresso uses its website nespresso.com, which is owned and direct, as well as Nespresso boutiques, which fall in the same category. Both are used for sales, as well as marketing and brand building. In addition, Nespresso uses call centers for customer support, which are partner and indirect. Finally, Nespresso also uses the partner and indirect channel of wholesale for its machines as well as mail order.
3.1.4 Customer Relationship
The block Customer Relationship explains the relationship between the company and the customers, which can either be very personal or automated and impacts the customer experience. Customer Relationship is also influenced by the motivations of a company, whether it uses Customer Relationship for acquisition, retention or boosting sales. In addition, Customer Relationship is also tied to the customer segments and value proposition, because
based on those two blocks the customers might already have an expectation of the relationship (Osterwalder & Pigneur, 2010). For example, if a customer buys a new security software product, the expectation would be to have a personal service with updates, help and support (MaRS, 2012b). Osterwalder categorizes Customer Relations into six groups, which may co-exist within a company’s strategy.
• Personal Assistance, which is based on human interaction throughout the sales and aftersales process as described in the previous software example. Interactions may hereby occur at the point of sale, via telephone, email or other mediums
• Dedicated Personal Assistance, representing the deepest form of relationship with a dedicated customer representative for a specific customer, as often found in private banking
• Self-Service, with no direct relationship to the customers, such as a self-service gas station
• Automated Services, which is a mix of self-service and automation in order to offer a more sophisticated relationship. Examples are online profiles, which recognize customers and their data, in order to provide information related to their account. Amazon is using automated services, by showing the order history and by recommending books and other article based on previous purchases
• Communities can be used to interact with more customers and prospect customer and facilitate connections to a community. GlaxoSmithKline, a pharmaceutical company, used a private online community to understand challenges of overweight adults to manage expectations for their new weight loss product
• Co-Creation occurs when companies use customers to create value for other customers. Examples are Amazon inviting customers to write reviews for other customers or YouTube using users to create content of consumption for other users In the example of Nespresso, the customer relationship is managed through the Nespresso club, which offers advice from coffee specialists, technical support, personalized contact, invitation to exclusive events in boutiques and convenient delivery service. The Nespresso example can therefore be seen as a mix of Personal Assistance and Automated Service.3
3.1.5 Revenue Streams
Revenue Streams is the block that defines how a company will make money from the Customer Segment. Revenue Streams can either be transactions based on one-time payments or recurring revenues based on ongoing payments. Osterwalder divided the ways of generating revenues into seven categories.
• Asset sale, where a company sells the ownership of a physical product, such as Fiat selling a car.
• Usage fee occurs when a customer pays per amount of service. This is usually found in mobile contracts, where customers pay per minute or in hotel where customers pay for the usage of a room
• Subscription fee, generates revenues through selling continuous access, such as a monthly gym membership
• Lending/Renting/Leasing generates revenue through giving away the right to use a product for a restricted time, such as renting a car for a weekend.
• Licensing gives permission to customer to use protected intellectual property for a licensing fee. Lego for example used licensing, to use characters from movies such as Star Wars or Batman
• Brokerage fee generates revenues through providing service on behalf of two or more parties. Examples are Credit card companies, which keep a percentage of each transactions or real estate agents taking a commission for matching buyer and seller • Advertising creates revenue through advertising products or services (Osterwalder &
Pigneur, 2010)
Even though pricing is part of the final revenue, it is a different decision. However, pricing should not be decided on day one when filling out the BMC. First of all, the value of the solution should be explored throughout the Customer Discovery phase, as it will be described below, because without knowing the value of the solution it will be difficult to decide on a price (Morelli, n.d.).
In the Nespresso example, revenue streams are generated through the sale of the machines and accessories representing one-time sales. However, the main revenue stream is coming from recurring sales of capsules.
Another example from the information publishing industry, which shows how a startup can derive several revenue streams from one business, can be found in Appendix 5.
3.1.6 Key Resources
Key Resources define the resources a company needs in order to deliver the Value Proposition, reaching the Customer Segment or maintain the Relationship and is therefore crucial for having a functional business. Key Resources can be:
• Physical, such as machines, buildings or manufacturing plants • Intellectual, such as brands, copyrights or patents
• Human, especially in knowledge intensive and creative industries • Financial, such as cash or credit lines (Osterwalder & Pigneur, 2010)
In the Nespresso example, Key Resources are the distribution channels, which offer direct access to customers. Other Key Resources are the patent on the system and brand, which represent intellectual resource and the production plants for the coffee pads, as a physical resource.
3.1.7 Key Activity
Key Activities are main operational activities the company needs to take in order to support the Value Proposition, the Channels, the Relationship and the Customer Segment. Similar to Key Resources, Key Activities depend on the business type. Hereby activities can be either:
• Production, which includes designing, making and delivering a product
• Problem Solving, where a company comes up with new solutions to a customer problem; thinking of consultancies
• Platform/Network activities such as platform management, service positioning or platform promotion in business models with a platform as a Key Resource (Osterwalder & Pigneur, 2010)
Nespressos Key Activities are marketing, production of the coffee pads and logistics for the direct distribution.
3.1.8 Key Partnerships
Key Partnerships are the partnerships with supplier or other partners to keep the business model active. Partnerships can be strategic partners with non-competitors, coopetition, which
is a strategic partnership with competitors, joint ventures or buyer-supplier partnerships. The reasons to adapt to a partnership structure can be:
• Optimization or Economy of Scale by sharing infrastructure or outsourcing, • Reduction of risk and uncertainty in competitive environments
• Acquisition of resources or activities, for example mobile phone manufactures, such as Samsung use licensing for the operating system instead of developing it in-house (Osterwalder & Pigneur, 2010).
In the Nespresso example, Key partners are the coffee machine manufactures and the coffee growers, because they are not produced in-house.
3.1.9 Cost Structure
Finally the Cost Structure lists all costs in order to operate the business. Hereby, businesses usually can be differentiated between a cost-driven model, where costs are held to minimum with a maximum of automation and outsourcing, as it can be found in the cases of Ryanair or easyJet and value-driven models, which represent the opposite. Additionally, the cost structure can be subdivided into:
• Fixes costs, such as rents and salaries,
• Variable costs, that rise with the produced volume,
• Economies of scale, where costs sink with increasing output and
• Economies of scope where costs are reduced through an increase in operations, for example when one marketing or channel activity can support different products (Osterwalder & Pigneur, 2010)
In the case of Nespresso, the costs that are needed to run the business are manufacturing, marketing, the distribution and channels.
3.2 Tools for Customer Development
The next principle that will be developed for the toolkit is the Customer Development model, the next step in the Lean Startup process, by taking the captured assumptions of the BMC to test and validate them through interviews.
Customer Development is a four-step model, developed by Steve Blank, with a close to the market approach to discover and validate a business idea with the help of customer interaction.
The aim of the interaction is to minimize uncertainty, by identifying the right market and developing a product and product features that are requested by customers of the identified target, in order to solve their problems and needs (Cooper & Vlaskovits, 2010).
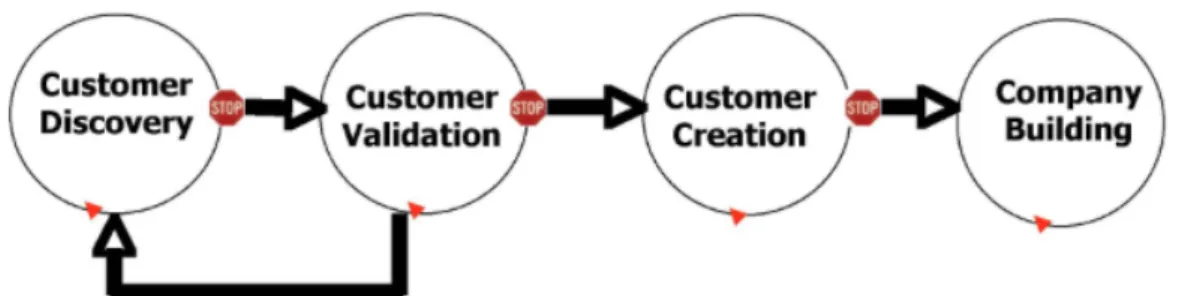
The four steps of the model are: Customer Discovery, with the aim to validate the identified problem, product and customer hypotheses through customer interviews; Customer Validation, where a startup starts selling to early adopters to validate a repeatable sales process and the scalability of the business; Customer Creation with the goal to grow the business further by focusing and investing on marketing and sales to create demand; Company Building, the step where startups transit into a mission oriented company with structures and departments.
Figure 7: Customer Development Model
The first two steps act hereby as a search process for finding a business model and therefore imply to stay agile while making iterations and adoptions, whereas the last two phases are execution oriented (Blank, 2013a). Due to the focus on early stage tools for this thesis, the last two steps of the process will not be examined in greater detail in this work. The following section therefore presents tools for the first two phases of the Customer Development process. 3.2.1 Customer Discovery Phase
The following section will outline the customer discovery phase, which can be divided into a interview phase, the problem and solution interviews and a post-interview phase. The pre-interview phase has the purpose to prepare the pre-interviews, in order to gain the greatest learning from those. The problem interviews try to validate the identified problem, whereas the solution interviews try to validate the proposed solution using a prototype (Maurya, 2012a). During the solution interviews a startup is additionally learning about the market segment, the pricing strategy and sales channels, in order to acquire customers more efficiently in the subsequent Customer Validation phase (Cooper & Vlaskovits, 2010). Throughout the problem and solution interviews a startup wants to validate the right side of
the BMC, which includes the blocks Customer Segment, Value Proposition, Channels, Customer Relationship and Revenue Streams. Therefore, a startup might conduct several rounds of problem interviews and several rounds solution interviews. In this process of deciding whether to iterate or not, the post-interview phase provides insights and guidelines for validation.
Pre-Interview
Before a startup can start to interview potential customers, it should translate the assumptions from the BMC into testable hypotheses (Blank, 2013b). Afterwards, potential interview candidates have to be found and contacted and the interviews have to be prepared. Therefore, the following section will outline how to translate hypotheses and how to get in contact with the target group, as well as it will explain how many interviews are necessary and finally give advice concerning the interview process itself.
Translate Hypotheses
In order to understand how to translate assumptions into hypothesis, first of all it has to be understood what a hypothesis really is. A definition of a business hypothesis can be given as: “Something that needs to be true for your idea to work partially or fully but that hasn`t been
validated yet.”(Osterwalder et al., 2014) In addition, to make a hypothesis a falsifiable
hypothesis, it has to be a statement that can be clearly proven wrong. A definition can be given by the equation:
Falsifiable Hypothesis = [Specific Repeatable Action] will [Expected Measurable Outcome] (Maurya, 2012a)
An example Maurya uses for a channel hypothesis is: “Being known as an “expert” will drive early adopters” versus “A blog post will drive 100 signups”. The first statement is formulated vague and cannot be proven clearly wrong, whereas the second statement can (Maurya, 2012a). However, since a startup is in its early days, it is sometimes difficult to set a specific hypothesis goal. To overcome this uncertainty, benchmarks from similar companies can provide a guideline (Ries, Dillard, & Eisenmann, 2014).
Contact Target Group
Even though the target group has been defined, getting in touch with them can be challenging. In order to initiate, the following steps should be undertaken:
1. Founders should write down five names of friends they know who share the same characteristics as their target group and contact them.
2. Founders should search through Facebook, Twitter and LinkedIn in order to contact another five people with similar characteristics.
In addition, both groups should be asked, if they could enable introductions to other people, which share the same characteristics. However, one has to be aware to handle the answers from friends with care, since those might rather be friendly than honest about an idea. Therefore, the idea is to use friends as a finder for other people (Cooper & Vlaskovits, 2010). Appendix 6 discusses this technique, which is also known as snowball sampling, and additionally includes an email template for referrals.
Two other steps that can be undertaken are Cold Calling or Emailing, where however response rates are most likely to be lower. Especially, emailing can be useful, when a landing page for the product and its UVP have been set up and people already signed up for it. Those signups can be reached out to for potential interviews (Maurya, 2010). Appendix 7 provides an example template for cold calling and cold emailing.
Apart from landing pages, also a blog with useful content about a problem can be helpful to get in contact with the target audience (Maurya, 2012a). A great example for a blog, which is providing relevant content for its target audience, is HubSpot a company for inbound marketing and sales software.
How many interviews?
Analyzing the recommendations of practitioners such as, Blank, Maurya and Wilcox, it can be concluded that a range of ten to twenty interviews should be dedicated for each round of interviews (Blank, 2013a; Maurya, 2010; Wilcox, 2014). A study by Griffin, Hauser, Gaskin, Katz, and Klein (1993) also showed that in a homogenous customer segment, 20-30 customer interviews are sufficient to identify 90% of all possible product requirements. However, it is important to note that the recommended amount is per round. Since a startup is taking several
iterations to test different hypotheses, the total amount of interviews might be as high as 100 interviews. This amount of data is also necessary to later extract insights (Guggenheim, 2013a). To start the interview process, both Maurya and Blank, recommend scheduling three interviews per day (Blank, 2013a; Maurya, 2010).
Even more important than the number of interviews are the patterns and insights gained throughout the interviews. After some interviews, the same problems and needs should arise and form a pattern. In case there are no new problem insights occurring, the amount of interviews can also be considered sufficient enough to stop the interviews (Wilcox, 2014). In order to identify patterns, a technique will be introduced in the section Insights further down. In addition to the solution interviews, Maurya adds that these can be considered over when: Demographics of early adopters can be identified, a must have problem is identified, the minimum features set can be defined, a price is found, which the customer is willing to pay and ultimately when a business can be build around the solution (Maurya, 2010).
Interview Advices
In general, before starting the interview process there are some advices to take into consideration. First of all, an interview is not about pitching a solution, but rather listening and learning about the customer and the problem. Therefore, it is recommended to ask open-ended questions about a specific event in the past. Future questions containing “would you” or “will you” should be avoided, because they lead most likely to a positive answer out of politeness (Fitzpatrick, 2014). Sometimes, it can also be helpful to bring a partner for taking notes to allow the interviewer to focus on the actual behavior of an interviewee to extract insights from the behavior (Garbugli, 2014a).
Problem Interviews
The problem interviews are the first interviews a startup should conduct, because it validates whether the identified problem is relevant enough. In the following, a problem interview structure, as well as a compilation of ready to use questions, which can be used to customize an interview script, is outlined.
Problem Interview Structure
In the beginning of an interview, an entrepreneur should ask some demographic questions to qualify the customer segment. For example, if the product is related to kids, the interviewee
can be asked how many kids (s)he has, how old they are and how they do spent their free time. Afterwards, a short story should introduce the wider problem context to see whether the context resonates with the customer. The next and main concern is now to test the problem, with the below provided questions and afterwards ask for referrals. Immediately after the interviews the results should be documented for later analysis (Maurya, 2012a).
Problem Interview Questions
In the following a list of questions, considered to be good questions, as well as bad questions will be presented. Bad questions are dangerous, because they might lead to a false positive outcome, which means it is concluded that the customer has a problem, when in reality he has none (Osterwalder et al., 2014). A good question is characterized by being open ended, tied to a specific event in the past and about the life of the customer and not about one’s solution. Bad questions on the other hand can be characterized by being yes/no questions, future and hypothetical questions formed with will or would you.
For the compilation of the list, blogs, slides, articles and videos have been analyzed to gather practical proofed questions. The list of sources can be found in Appendix 8. The questions, that were mentioned most frequently were selected and included in the presented excerpt. Good Questions: - Do you find yourself doing X?
- Do you find process X painful?
- Take me through the last time you had this problem? What happened? - What was the hardest part? And why?
- How do you currently solve this problem?
- What do you like/dislike about the current solution? - What is the impact of the pain?
- What do you wish you could do, that is currently not possible? - How much money does this problem cost you?
- Is there a budget for this?
- Who else has this problem? Can you refer me?
- If I would not have called on you personally, how could I reach you? - 5 why´s method4 (if appropriate)
4 The 5 why´s method is a approach to ask 5 times why in a row to every answer to get to the bottom of a
Bad Questions: - Would you use this product? - Do you think it is a good idea?
- Do you want feature X? (Most likely answer: yes) - How much would you pay for this?
- If we built a product that solved Problem X, would you use it? - How would you pay for something that did X?
- Would you like your existing solution better, if it did X? - Would you want an app that does X?
On the other hand there are not just bad questions, but also bad answers that have no value and do not offer any learning. However, some of those answers can be retaliated to make them more actionable as it can be seen in Appendix 9.
Solution Interviews
After a relevant problem has been identified, a startup is able to take the next step and develop its solution. The developed solution in this phase is through a prototype, which is not yet a MVP (please consult section 3.3. “Tools to Create a MVP” for further information). After the solution has been crafted, the solution interviews can be started. The next two paragraphs again present an interview structure for solution interviews and a template of questions to create an interview script.
Solution Interview Structure
The Solution Interviews should also start with collecting demographics and introducing the problem with a story. Additionally, the problem should be reflected with the interviewee to make sure the problem of the interview partner is addressed. In case the interviewee does not have the problem, presenting the solution will be useless for him. After the problem has been confirmed a potential solution can be presented to gather feedback on the solution and potential pricing. After this main part, it should be asked again for a follow up and potential referrals, before documenting the results (Maurya, 2012a).
Solution Interview Questions
In terms of characteristics, the questions of the solution interview meet the same requirements as the problem interview questions. The questions of the solution interviews aim specifically at testing the responses of customers to the proposed solution.
Good Questions: - Does this product solve your problem?
- Which screenshot resonates most with you? Which could you live without?
- Is there any additional feature you think you are missing?
- If you could use this product right away, would you use it? How? - What does prevent you from using it?
- What <product category> do you buy now? Why? How long?
- If this product would be available today and free, would you implement/use it immediately? If no, why?
- If the product would cost (100 times the planned price) per year, would you be willing to implement it/use it immediately?
- How do you or your company buy products like this?
- How does the approval process look like? Could you walk me through the process? Who else is involved?
Post-Interview
The post-interview phase is about validating learning and retrieving insights from the interviews, in order to indicate the next steps of action. Therefore, the next paragraph covers how to extract insights from qualitative interviews and it introduces methods to validate or invalidate hypotheses. The post interview process is executed after every round of interviews.
Insights
As stated above, in the Customer Discovery phase, insights are created using qualitative data, which is derived from the interviews. To analyze this qualitative data and gain insights, literature provides diverse and useful techniques. The most appropriate and easy to use technique is called “Cutting and Sorting” (Bernard & Ryan, 2010).
Cutting and Sorting, uses quotes and expressions, which occur during the interview and arranges those quotes and expressions into similar piles, creating themes by using post-it cards. The post-it cards can either be physically or digitally and should include the quote itself and an indication of the person who stated the quote. While compiling the quotes, it can be differentiated between splitters, which maximize the difference between the quotes, and lumpers, which reach for more overarching themes. As a recommendation, it is helpful to first split the quotes into a greater range and lump later (Bernard & Ryan, 2010). After the quotes Have to be
have been grouped a startup is able to quantify its data. In Appendix 10, a visual example from Wilcox can be found, who uses post-it notes with different colors, indicating different persons, before sorting the notes and summarizing the findings in an email for the team. By using this technique Wilcox can for example conclude that his potential customers do not know how to price their product.
Validation/Invalidation Customer Discovery
After the insights have been retrieved, the next step is to compare the previously stated hypotheses with the actual outcome of the interviews. Using the introduced technique of “Cutting and Sorting” a startup can clearly validate or invalidate its hypotheses from the Customer Discovery phase. Taking the example from Wilcox of the Insight section, Wilcox could have crafted his hypothesis as: “At least 4 people will mention that they do not know how to price their product.” Through “Cutting and Sorting” he quantified the answers and would have been able to clearly validate his hypothesis (Wilcox, 2013b).
Another indication for invalidation can occur, when the customer does not mention the identified problem during the problem interview. If the problem is not mentioned directly, the interviewer can use the previously presented question and ask when the customer tried the last time to solve/use/do the specific problem and what he has undertaken to solve the problem. In case the customer has to be introduced to the problem and does not already take action towards solving the problem, he will not use the solution, because the pain is not big enough. The hypothesis can be seen as invalidated (Wilcox, 2013a).
In case a startup invalidated one or more of its assumption, it is has the chance to pivot. A pivot describes when a startup changes one of its strategies, which are captured in the BMC, to reach its vision (Ries, 2011). For example, a startup might pivot on their Channel assumption, because the Channel hypothesis has been invalidated. This pivot in Channel happens while the overall vision stays the same, which is the main characteristic for a pivot. An example for a successful pivot can be found with Zingy, a mobile media company selling ringtones and wallpapers. Zingy originally started with the assumption to deliver a B2C product, charging customers through the carrier, which was not possible on the operational side. Afterwards, it pivoted to a B2C approach, with a direct pay system through credit cards, which proved as to complicated. Finally, it pivoted one more time to a B2B2C revenue model,
where content was provided through the carrier to the customer and succeeded reaching $ 200 million in sales in 2005 (Cooper & Vlaskovits, 2010).
3.2.2 Customer Validation Phase
As elaborated above, in the Customer Validation phase, a startup starts selling its first MVP, which is optimized based on the learning from the prototype, and gathers quantitative data during the sales process. Therefore, the next section will introduce metrics, which can be used to analyze quantitative data, in order to make decisions. The section will close with a test to indicate whether a business has validated all its assumptions in order to proceed to the next stage.
Startup Metrics
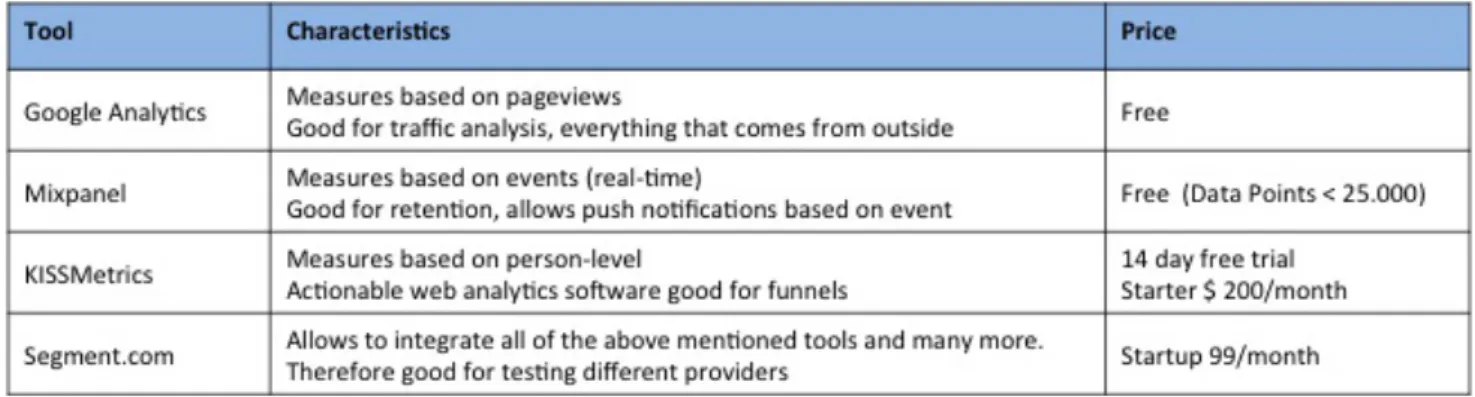
As described in the introduction to this chapter, metrics enable a startup to gathered quantitative data, while selling to customers. Therefore, it is important for a startup to set up necessary tools to measure those metrics, before starting the selling process. Even though there are several analytic solutions on the market, the most diffused tools mentioned throughout the literature were Google Analytics, Mixpanel and KISSmetrics. Since every tool has a different focus and different features, Figure 8 shows an overview of the three. Additionally, segment.com has been added to the list, because it is a tool, which allows using all three tools and more at the same time, in order to compare them and choose the most suitable.
Figure 8: Overview Analytic Tools
In order to use the full potential of quantitative metrics, a startup has to be cautious about focusing on the right numbers. When looking at data, it can be differentiated between good metrics and bad metrics, more specifically vanity metrics.
Vanity metrics are metrics, which look good on the outside, but do not indicate a change of action. Examples for vanity metrics are: Total Sign-ups, Time on Site, Emails Collected, Number of Downloads or Number of Visits. For example a startup could generate growing sign-ups, the metric however does not indicate whether customers are returning to the product. In case they do not and a startup focuses only on sign-ups, they see the number rising but since engagement is low to not existent, the business cannot be viable.
Good metrics on the other hand are “Actionable” and indicate a change in behavior. Examples for good metrics are: Funnel metrics, cohorts, number of sessions per user or user activations (Humble, Molesky, & O'Reilly, 2014).
Besides from being Actionable, metrics should be “Accessible” and “Auditable”. Ries calls it the three A´s of metrics. Accessible means, making the metrics as understandable as possible by using simple reports and making them available for every employee of the company. Auditable stands for making the metrics credible for the employees, in order to help them understand decisions. In the best case, the master data should be available for every employee to reproduce data reports (Ries, 2011).
In the following two tools will be presented, which can be used to measure the progress while selling the MVP. The two tools are Pirate Metrics to measure customer behavior and the three Engines of Growth, which help to focus on the efforts of growing.
Pirate Metrics
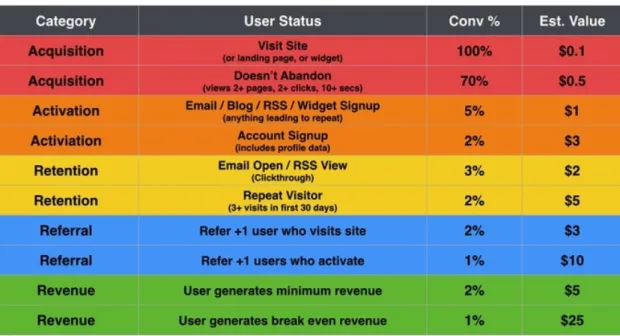
Pirate Metrics is a metric tool, which uses customer behavior in addition to conversion and web analytics to assist marketing and product decisions, throughout the customer lifecycle. The tool is divided into five categories of behavior: Acquisition, where do users come from? Activation, do users have a great first experience? Retention, do they come back? Revenue, do they spend money? Referral, do they tell others? The starting letters of the variables lead to the acronym AARRR, which sounds like a pirate and hence it is called Pirate Metrics (McClure, 2007). In this tool, the data of each funnel is captured in an AARRR Dashboard, as it can be seen in the example below.
Figure 9: AARRR Dashboard
The example dashboard shows the customer lifecycle, which allows having an overview of the macro conversion funnel. This lifecycle is different for every startup, but it should reflect, how a founder hypothesizes the customer lifecycle for the company. In the specific case above, it starts with Acquisition measuring the visits of the page. In the example, 70% of the overall visits do not bounce5 and view different pages within the website. The next step describes the Activation rate of the previously acquired visitor. In the example, this is measured by sign-ups. After the customer signed-up, the company is interested to know how many of those sing-up customers come back, which is measured through newsletter click-through or the number of visits per user per month in the example. In addition, signing up oneself a customer might also refer the product to a friend, which is measured in Referral, broken down in referees that visit and referees that activate. After the customer went through the described lifecycle, Revenue is the final step. In the example, it is measured by minimum revenue and break-even revenue generated. It can be noted, that only 2% of the initial 100% that visited the website converted into paying customers.
In order to improve the lifecycle steps, the macro levels can be broken down into sub-funnels, allowing a greater level of detail on variables that drive each step. The next section will give an introduction to those steps and explain what information a startup can extract from each metric based on the example of Evernote (an online service for creating, organizing and
sharing written notes online). For an extensive explanation of the single sub-funnels, its relevant metrics, measurement techniques and action steps for improvement, please consult Appendix 11.
Acquisition
Acquisition describes the process of turning the visitors of a website or a business facility into interested customers (Maurya, 2012a). Customers will hereby come from different channels, such as SEM, SEO, Blogs, Affiliates, Campaigns, Email, Social Networks, PR or Domains. A startup is interested in choosing the channels with the largest volume, the lowest cost and the best performance. The metrics a startups wants to measure in this step are the traffic that is coming to the page through a channel, the number of page views per customer, to see whether customers show interest and finally the bounce rate, to learn whether customers interact with the page (McClure, 2007). Evernote for example could measure from which channels the customers convert the best and focus their effort on those or optimize the channels that do not perform well.
Activation
In the Activation step, a startup is measuring the customers’ first experience with the product. To measure the experience a startup should use selected qualitative customer interviews, as well as quantitative analytics. The customer interviews serve the purpose of gathering feedback and observing how customers interact with the product and whether they are experiencing the intended value proposition (Croll & Yoskovitz, 2013). Given the experience of the MVP, a startup is mainly concerned about the visitors triggering the key activity. Therefore a startup could define their key activity as sing-ups and measure them using a sub-funnel and cohorts. In the case of Evernote, the key activity would be customers creating their first note (Lofgren, 2012).
Retention
Measuring Retention, a startup is worried about the users coming back to the product or service. Retention is therefore defined by the continuous engagement and repeated use of the product or service and is measured by the churn rate, visits in the last X days or monthly active users (Croll & Yoskovitz, 2013). For Evernote, Retention would mean that the users come back to the service continuing to use the service by creating documents or notes.
Referral
Referral, is an advanced form of acquisition and a business wants to measure, whether current customers refer the product or service to other customers (Maurya, 2012a). Referrals can be measured by the Viral Coefficient, which gives an indication of how many additional customers will be generated by every new customer that signs-up. In order to grow virally this coefficient has to be greater than one (Ries, 2011).
Revenue
Finally, Revenue is measured when the customers place an order and spend money on the product. In the example of Evernote, it could be the upgrade of the account after the free trial period ended. Revenue is measured by Customer Lifetime Value (LTV)6, which describes the net profit from a customer over his lifetime.
Engines Of Growth
Influenced by the Pirate Metrics, Ries developed a framework, which he calls ‘The Three Engines of Growth’. The aim is to give entrepreneurs a small amount of metrics to focus their efforts, without wasting time or losing the big picture. The three engines are: The Sticky Engine of Growth, which focuses on customer retention and a low churn rate; the Viral Engine of Growth, which focuses on high amount of referrals; the Paid Engine of Growth, which focuses on the cost of acquisition versus the revenue per acquisition. However, Ries recommends focusing only on one engine at a time, to avoid confusion (Ries, 2011). The three engines will be explained in greater detail in the following.
Sticky Engine of Growth
The Sticky Engine focuses on a high retention by keeping the attrition rate and churn rate low. Growth is reached by keeping the customer acquisition rate higher than the churn rate (Ries, 2011). The Sticky Engine can be compared to the Retention phase in the Pirate Metrics and therefore use the same optimization tactics as described in 12.