Work Project, presented as part of the requirements for the Award of a Master Degree Management from the NOVA – School of Business and Economics
DETERMINANTS OF MERGER AND ACQUISITION ACTIVITY IN THE RENEWABLE ENERGY INDUSTRY IN THE UNITED STATES OF AMERICA
SANTIAGO DE ORDUNA LOURO E SILVA #24607
A Project carried out on the International Masters in Management Program, under the supervision of Professor Youtha Cuypers
Abstract
For the past few decades, the renewable energy industry has grown and expanded its influence and competitiveness in global markets. This thesis analysis whether certain factors related to the energy industry are conducive to mergers and acquisitions. Using regression analysis, it concludes that solar industry growth, power industry growth, and crude oil prices have no impact on M&A activity on the given timeframe.
1 – Introduction & Thesis Objective
1.1 Introduction
“There is one issue, that will define the contours of this century more dramatically than any other, and that is the urgent threat of a changing climate” (Obama, 2014). In 1896, two centuries before this remark, Svante Arrhenius, the Swedish chemistry Nobel laureate, found that the relationship between atmospheric CO2 concentration and the increase in ground
temperatures was a result of the industrial revolution (Arrhenius, 1896).
Climate change was only concertedly addressed in the late 20th century. In November 1988, the International Panel on Climate Change (IPCC) was created in order to provide policy makers with regular scientific assessments of the impact of climate change on the probability of extreme events and disasters, as well as advice regarding options for mitigation and adaption (IPCC, 2013). The IPCC’s work paved the way for a better understanding of the implications of a man-made global warming era, and urged the prevention of reaching a tipping that would lead to dangerous climate instability.
In December 2015, the Paris Climate Conference (COP21) followed the Kyoto Protocol as the biggest breakthrough on the matter. The key goal of the agreement is to limit the temperature increase to 1.5ºC by reducing greenhouse gas emissions (European Comission, 2016).
The energy industry is a monolith on the verge of a major structural transformation, heading for a new optimal mix of resources. In particular, the generation of electricity has begun leveraging a wide range of inputs for production, encompassing both fossil and non-fossil fuel resources (i.e. nuclear and renewable energy). In contrast to the rest of the world, OECD
countries have increasingly adopted non-fossil fuel energy (U.S. Energy Information Administration, 2016).
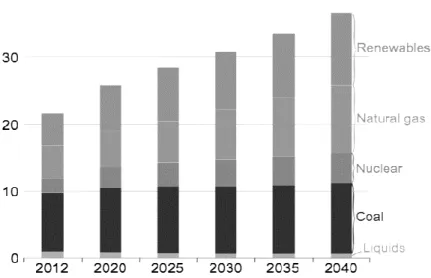
Some forms of renewable energy have been well established and are playing a leading role in global energy markets, as investment in renewable power capacity was an estimated $265.8 billion in 2015. These figures represent twice the amount allocated to new coal and gas generation (Frankfurt School-UNEP Centre & BNEF, 2016). Alternative energy resources – hydropower, wind, solar, geothermal and other (biomass, waste, and tide/wave/ocean) – are growing at 2.9 per cent per year, and are expected to surpass coal as the world’s largest sources of energy for electricity generation by 2040 (U.S. Energy Information Administration, 2016) as illustrated in Figure 1.
Figure 1: World net electricity generation by energy source, 2012–40 (trillion kilowatt-hours), (U.S. Energy Information Administration, 2016)
The growth of the alternative energy sector enables the reduction of corporate exposure to their carbon footprint. This sector has attractive growth rates and exploits innovative technologies that drive down costs and increase its competitiveness in terms of economies of scale and scope. The use of renewable energy resources is considered to be a crucial component of future energy supply (Eisenbach, Ettenhuber, Schiereck, & Flotow, 2011).
This thesis examines the extent of merger and acquisitions’ (M&A) activity in the United States of America, as represented by the accumulated number of completed deals of either targeted or bidder companies year on year on a monthly basis. Thus, M&A activity is considered from July of 2003 to September of 2016. In this case, alternative energy is defined as above, therefore coinciding with Merger Market’s classification.
Despite the extensive literature on M&A at an aggregate industry level, there is a limited pool of research regarding the determinants of M&A activity on an industry level. Gort and Hogarty (1970) state that, “the stock of knowledge on this subject reveals little growth”. Furthermore, empirical evidence appears to be “scanty, desultory, and unrefined” (Kamerschen, 1970). Thus, this work project aims to fill this knowledge gap by analyzing the determinants of M&A within the renewable energy industry.
What are the determinants of M&A activity within the renewable energy industry? In answering this question, this thesis will infer the variables which affect acquisition activity within the renewable energy industry: solar industry growth, wind power industry growth, average real oil price and the time variable. In order to control for confounding factors, it will also use variables for real gross domestic product (GDP) and the interest rates of treasury bills.
Hereafter, the objectives of this work project will be to assess the extent to which these variables drive M&A activity within the renewable energy industry.
This thesis is organized as follows: literature review and hypotheses; data collection and methodology; results and limitations; conclusion; bibliography; and annexes.
2 – Literature Review and Hypotheses
Global levels of corporate M&A activity have been soaring in recent years (J. P. Morgan, 2016), and have been studied by the social science community both at industry and firm level (Shimizu, Hitt, Vaidyanath, & Pisano, 2004; Haleblian, Devers, McNamara, Carpenter, & Davison, 2009). The following literature is based on the neoclassical economical approach, which studies the allocation of scarce resources based on principles of market equilibrium and profit maximization (Oxford University Press, 2016).
The determinants of M&A within an industry vary amongst authors. Despite some academic variations and differences, however, there is consensus regarding the importance of several independent variables. M&A activity is associated with variables such as: regulation (Mitchell & Mulherin, 1996; Andrade & Stafford, 2004; Harford, 2005; Abzahd, Meyerson, & Sahagún, 2009); industry growth rate performance (Christensen & Montgomery, 1981; Audretsch, 1989; Schoenberg & Reeves, 1999); industry concentration (Gort, 1969; Audretsch, 1989; Abzahd, Meyerson, & Sahagún, 2009); and innovation (Audretsch, 1989; Pisano, 1991).
Three of these studies consider topics that are particularly relevant for the research question at hand: the implications of the industry life-cycle hypothesis for M&A behavior (Audretsch, 1989); benchmarking various industries in order to measure the determinants amongst industries of different maturities (Schoenberg & Reeves, 1999); a financial approach regarding the renewable industry (Abzahd, Meyerson, & Sahagún, 2009)
According to Audretsch (1989), companies in industries that are in either mature or declining stages of the life cycle expect reduced growth and profit scenarios (Vernon, 1966; Wells, 1966). Therefore, a profit maximization approach presupposes the acquisition of firms in the introduction or growth stages of the life cycle, in order to obtain new profit and growth streams.
The study finds a negative relationship between number of acquisitions and industry capital intensity, the extent of unskilled labor, and the four-firm concentration ratio. Nonetheless, it finds a positive relationship between acquisitions and industry R&D intensity, industry growth and wage rate.
The second set of authors argue that highly concentrated industries with high growth rates were associated with high acquisition activity, therefore supporting the authors’ views regarding profit maximization strategies (Trautwein, 1990; Holl & Kyriazis, 1997). Contrarily to Audretsch (1989), Schoenberg and Reeves established no relationship between the influence of capital intensity and acquisition activity. In addition, the study revealed regulation as the single most important determinant of M&A activity. Despite the results, there is an understatement of this particular variable given the methods to compute this variable.
Lastly, Abzahd, Meyerson and Sahagún (2009) are partially consistent with previous research. Their study strongly suggests that larger companies are more active players in the takeover market in comparison to smaller firms. Regarding performance, the authors argue that
firms with low expected growth opportunities are more likely to engage in acquisition strategies. The authors’ views contrast with Schoenberg and Reeves’ (1999), as they find no evidence that regulation is a driver for M&A activity.
Accordingly, within the literature, there is no unanimity regarding the determinants of M&A.
Firm level motives for M&A transactions include: economies of scale and scope; vertical integration; expertise; monopoly gains; efficiency gains; tax savings from operating losses; diversification through risk reduction, debt capacity or/and borrowing costs; and earnings growth (Berk & DeMarzo, 2011).
Researchers have found that M&A has a differing impact on firm performance. Mandelker (1974), Jensen and Ruback, (1983) and Bradley, Desai and Kim (1983) find positive returns for the acquirer. On the other hand, Loughran and Vijh (1997) and Moeller, Stulz and Schlingemann (2005) report negative returns.
Regarding M&A activity in the renewable energy industry, transactions have soared in recent years, with wind and solar accounting for the majority of recorded deals. From 2000 to 2004 there were 216 aggregate recorded deals – the number of deals observed in 2008 alone (Eisenbach, Ettenhuber, Schiereck, & Flotow, 2011).
Acquisition arises in line with the shareholder value maximization principle (Lazonick & O’Sullivan, 2000). The concept of maximizing shareholder value and acquisition activity in high growth industry sectors goes hand in hand. Sales growth is an indicator that is particularly associated with high industry growth rates (Rappaport, 2006). Anticipation of high industry growth rates inflates future cash flows from an acquisition target, producing an interesting net present value forecast for the biased purchase (Magni, 2008). Industry growth rate has an
important impact on acquisition activity on various industries - amongst which include electricity production and distribution (Schoenberg & Reeves, 1999).
Thus, in accordance with these studies and previous empirical literature, high growth rate industries are more conducive to acquisition investment opportunities (Christensen & Montgomery, 1981).
Hence, this study puts forth the following hypotheses:
I. On average, the wind power industry growth rate performance has a positive impact on merger and acquisition activity
II. On average, the solar industry growth rate performance has a positive impact on merger and acquisition activity
The threat of substitute commodities (Porter, 1979) – fossil fuel prices - arise as the major limiting factor for renewable energy development, given that electricity input resources compete regarding prices (Loiter & Norberg-Bohm, 1999).
In this particular case, Sadorsky (2012) analyzed the relationship between daily closing prices of the WilderHill Clean Energy Index and the West Texas Intermediate crude oil futures’ contract. On average, a $1 dollar long position in clean energy companies can be hedged for 20 cents with a short position in the crude oil futures market. In other words, oil prices have a positive impact on renewable energy assets’ pricing.
On the other hand, lower oil prices can also benefit renewable energy. Many countries tax fossil fuels and distribute funds to improve renewable energy competitiveness. China for
instance, has raised gas taxes inhibiting demand, maintaining status quo on consumer price and increasing tax collection through a system benefits charges (SBC) (Nyquist, 2015).
In addition, historically, oil-price down cycles have led to an increase in M&A activity. Most commodity industries are inclined to consolidation during the downside of the cycle, when supply surpluses amass, prices decrease and competition ignites (Evans, Nyquist, & Yanosek, 2016). Alternatively, in a high price scenario, renewable energy companies are more competitive, given the relative decrease of price in substitutes, which may lead to an increase in M&A activity.
In the long run, oil prices – assuming that they do not maintain constant – will either decrease due to developments within shale gas extraction and fracking (i.e. commodities which are linked in certain markets), or increase due to political instability, fluctuations in production, or rapid demand increase. Both outcomes will coincide with the inevitable cost reduction of renewable energy output, consolidation and M&A activity.
Hence, it is expected that:
3– Data Collection & Methodology
3.1. Data Collection 3.1.1 Dependent Variable
Following previous studies, M&A activity can be represented by either the number of transactions (Linn & Zhu, 1997), or the average of aggregate dollar value of transactions (Golbe & White, 1993; Yagil, 1996; Schoenberg & Reeves, 1999). This study uses number of transactions to represent M&A activity, given that there is a sizeable number of undisclosed deal values (i.e. more than 50 per cent of the total sample). In addition, the average of aggregate dollar value of transactions method is prone to biases as it can be exaggerated through outlier deal values.
The M&A data refers to: (a) the announced date of the M&A deal in the alternative energy industry; (b) and the number of M&A deals of completed transactions on a monthly basis. The data corresponding to (a) and (b) is treated as the accumulated number of M&A activity between the months of t-12 and t (year on year) in order to capture similar results according to academic literature and to improve interpretation.
M&A activity data was obtained from the Merger Market platform under the search for companies in the renewable energy industry in the United States of America, as target or bidder companies, corresponding to the maximum the wider range of data regarding this variable between July of 2001 and October of 2016.
3.1.2 Selected Independent Variables 3.1.2.1 Wind Power Industry Growth
According to academic literature, it is common to determine industry growth as an average annual percentage growth in sales revenue (Schoenberg & Reeves, 1999; Anand & Delios, 2002; Audretsch, 1989). The data resultant from the wind power industry growth is taken as the accumulated number of net wind generation of electricity produced in the electric power sector in the United States of America between the months of t-12 and t (year on year) on a monthly basis in million kilowatt-hours from June 1999 to September 2016 for the same reason portrayed in point 4.1.1. The information was retrieved on the Energy Information Administration (EIA) and Saint Louis Federal Reserve’s (FRED) Microsoft Excel plug-in.
3.1.2.2 Solar Industry Growth
This variable follows the same set of assumptions as the wind power industry growth’s independent variable. This independent variable was calculated based on the accumulated utility-scale solar electricity net generation produced in the electric power sector in the United States of America between months of t-12 and t (year on year) on a monthly basis in million kilowatt-hours from June 1996 to September 2016 following point 4.1.1’s criteria. The information is part of the Energy Information Administration (EIA) and Saint Louis Federal Reserve’s (FRED) database present in Microsoft Excel plug-in.
3.1.2.3 Oil Price
Taking into consideration aforementioned prior research, renewable energy and oil prices are correlated (Sadorsky, 2012). Thus, in order to evaluate this assumption, the monthly
average real imported crude oil price in dollars was retrieved from June 1999 to September 2016 from EIA’s Short-Term Energy Outlook.
3.1.2.4 Trend Variable
A trend variable was considered as it is expected that M&A activity and the chosen independent variables to have a constant increase (Pollock, s.d.). This variable is portrayed as t and takes the values from 1 to 183.
3.1.3 Control Variables
Gross domestic product of the United States of America, inflation, and interest rates of treasury bonds impact the financial markets, and therefore M&A activity (Koller, Goedhart, & Wessels, 2005). These variables were not considered given the tradeoff between a sizeable data set suited by a Gaussian distribution and the underlying effects of these variables taking the discrepancies of the frequency of the different variables into attention.
3.2. Methodology 3.2.1 Model Definition
Following previous studies (Amihud & Lev, 1981; Abzahd, Meyerson, & Sahagún, 2009; Harzing, 2001), in order to understand the impact of the variables on M&A activity, a regression analysis was conducted. The analysis encompasses two different outcomes given two multi linear regressions and one with logarithmic values for the dependent variable (Royal Holloway University of London, 2018).
Time series challenge the structural expectations of a series, especially when dealing with financial data, assuming that there is the possibility of the occurrence of feedback effects.
They imply a cause and effect relationship for all observations in the sample, given a weakly exogenous time variable and for this reason model assumptions valid for large samples should be verified to validate models conclusions (Reed College, 2013).
Spurious regressions are either regressions with trend without including a time independent variable, or regressions with non-stationary independent variables. Thus, a Dickey-Fuller test was performed to each variable to assess whether a unit root was present using the auxiliary regression (Dickey & Fuller, 1979):
( 1 ) ∆𝑦𝑡= 𝑎0+ 𝛿𝑌𝑡−1+ 𝑢𝑖
The dependent variable, ∆𝑦𝑡 characterizes the original independent variables of the main distributed lag regression models’ difference between year t and t-1, 𝑎0 represents the intercept,
𝛿𝑌𝑡−1 illustrates the one year lagged values and 𝑢𝑡 the error term. The test was calculated in
Excel, using the regression test of data analysis’ add-in with a significance level of 5 per cent and the critical value for a sample larger than 100 in an interval between ] -∞; -3,41 [ with trend and from ] -∞; -2,89 [ without trend (Fuller, 1976).
The structure of the multi linear regression models were calculated as: ( 2 ) ∆𝑌𝑡 = 𝛽0+ 𝛽1∆ 𝑊𝑃𝐼𝐺𝑡+ 𝛽2∆ 𝑆𝐼𝐺𝑡+ 𝛽3∆𝑂𝑃𝑡+ 𝑇𝑡+ 𝜀𝑡
Assuming that:
( 4) ∆ 𝑆𝐼𝐺𝑡 = 𝑆𝐼𝐺𝑡− 𝑆𝐼𝐺𝑡−1 ( 5) ∆𝑂𝑃𝑡= 𝑂𝑃𝑡− ∆𝑂𝑃𝑡−1
( 6 ) log ∆𝑌𝑡 = 𝛽0+ 𝛽1∆𝑆𝐼𝐺𝑡+ 𝑇𝑡+ 𝜀𝑡
Assuming that:
( 7 ) ∆ 𝑆𝐼𝐺𝑡 = 𝑆𝐼𝐺𝑡− 𝑆𝐼𝐺𝑡−1
where ∆𝑌𝑡 accounts for the delta of the dependent variable M&A activity, accumulated year on
year on a monthly basis. 𝛽0 represents the intercept, the remaining 𝛽s are the associated
coefficients of the independent variables. ∆ 𝑊𝑃𝐼𝐺𝑡−1 characterizes one month stationary lagged values of wind production industry growth, ∆ 𝑆𝐼𝐺𝑡−1 represents one month stationary lagged values of solar industry growth. ∆𝑂𝑃𝑡 symbolizes the one month lagged values of the average real crude oil prices, 𝑇𝑡 represents the time variable (t=1,…, 183) and 𝜀𝑡 portrays the
error term. The models were calculated through the ordinary least squares (OLS) method regressions under the data analysis’ add-in in Excel with a significance level of 10%.
3.3.2. Model Validation
Economic data often exhibits characteristics that violate the underlying assumptions necessary for multiple linear regression and its associated hypothesis test to be valid. The main violations are: Multicollinearity; conditional heteroscedasticity; and serial correlation. The test for each of these conditions is possible in order to correct the estimations and hypothesis tests to account for their effects.
Multicollinearity is the effect of high correlations between independent variables, which has and impact on the model’s global significance but it does not interfere with the independent variables’ predictive capacity, despite a possible high R2, which is not the case in this work project. In other words, they are still the best linear unbiased estimators but have high variances affecting the precision of each independent variable coefficients’ (Wooldridge, 2009).
There are two possible corrections in order to address this issue. The first is to compare different models without one of the variables and to choose the one with the higher R2. The second is to identify the cause of multicollinearity by constructing models with that independent variable as dependent variable.
The causes for heteroscesdasticity, are the omission of relevant variables, incorrect functional form and cross section data (not distinguishing situations, could be solved by introducing dummy variables). Thus, the matrix variances’-covariance of the ordinary least squares (OLS) estimator of the 𝛽s are not valid, estimators are unbiased, consistent but not efficient. Previously made hypotheses tests are not valid as the robust inference to the presence of heteroscedasticity using the White’s estimator (Wooldridge, 2009).
In order to correct this matter, it is necessary to either change the functional form (i.e. change the dependent variable to a logarithmic form), or/and add independent variables, compute the estimated least squares though appropriate statistical software (i.e. Stata or SPSS - where there is the need to include a macro).
Autocorrelation is an issue related to models using time series. In statistics, the autocorrelation of a random event is the correlation between values of the process at different periods, as a function of the two periods or of the time lag.
There are two solutions that can tackle this issue. Changing the specification of the initial model by introducing lagged variables to account for model dynamics and adding relevant variables to the model can solve the problem (Griffiths, Hill, & Judge, 1993).
4 – Results and Limitations
4.1. Results
4.1.1 Dickey-Fuller Tests
The summary of the Dicky-Fuller tests is shown in table 0:
The purpose of this test is to understand the behavior of each variable and to difference data in a stationary form reducing standard errors. All of the chosen variables (i.e. M&A activity variable, wind power industry growth, solar industry growth and oil price) portrayed a non-stationary behavior and were later adjusted on the regression using the ∆𝑦𝑡 for each of the
4.1.2. Descriptive Statistics
The descriptive statistics of the variables are shown in table 1:
The descriptive statistics were useful to compute the logarithmic value of the dependent variable in order to transform the value of the Delta of the accumulated M&A activity into a logarithmic form by adding a constant term so that min(Y+a) = 1 (Wicklin, 2011). Thus, for this case the constant used was a = 5.
4.1.3. Multicollinearity Tests
The multicollinearity test foresees the correlation estimates, defines the consistency of the parameters’ estimates and error to conclude if the individual variables have explanatory capacity of the overall model (Joshi, 2012). These tests demonstrate that there is significance and that the null hypothesis can be rejected on both models. The test was performed with the correlation test of data analysis’ add-in in Excel.
4.1.4. Regression Results
There were several regression analyses performed, but only two were taken into consideration. The first multi linear regression ( A ) determines that the delta increase of wind power industry growth, the delta increase of solar industry growth, and delta of real average oil crude prices are not statistically significant for the period between July 2002 and September 2016 at a significance level of 10 per cent. In addition, the model discloses an R2 of 2 per cent which illustrates the small capacity of the model to predict the relationship between variables. In order to address the issue of non-statistically significant model, the functional form of the model was adjusted to a multi linear with a logarithmic dependent variable. This method is a very common procedure to overcome situations where non-linear relationships occur between the dependent and independent variables (Benoit, 2011), namely in time-series.
Model ( B ) concludes that there are not significant reasons to reject the hypothesis that there is a relationship between the ln delta of M&A activity and the delta of solar industry growth at a significant level of 10 per cent. In other words, it is expected that if there is a positive difference between t-1 and t of the accumulated utility-scale solar electricity net generation produced in the electric power sector in the United States of America between months of t-12 and t (year on year) in 100 million kilowatt-hours on a monthly basis, there would be an increase of 1 per cent in the difference concerning t-1 the accumulated number of M&A activity between the months of t-12 and t (year on year).
In addition, the model reveals an increase of 11 per cent when comparing to the previous model in terms of the ability to explain the statistical inferences. Despite this improvement, the R2 of 3 per centhighlights that the model has a minor capacity to describe the overall triggers of M&A activity in the renewable energy industry. The real bottom line in this analysis is measured by similar academic research regarding the determinants of M&A activity
(Audretsch, 1989), where R2 of models is normally smaller than 30 per cent, which means that,
relatively, this model has 10 times less explanatory capacity.
In conclusion, the main criteria for an accurate multi linear regression model are (a) to make the minimum possible errors, in practical terms, when predicting what will happen in the future taking the coefficients of each variable into consideration, and (b) to derive useful inferences from the structure of the model and the estimated values of its parameters.
4.1.5. Regression Tests
Tests on residuals heteroscedasticity and autocorrelation were performed on both models and it was concluded that the hypothesis of homoscedasticity was not verified and errors presented serial autocorrelation. The results of this test shows that the statistical inference made cannot be valid. To solve this problem, the functional form of variables was changed, and lagged variables introduced. Still, the overall model showed no significant improvement. Furthermore, it was not possible to find a model that verified all of the theoretical hypotheses. In order to have a more robust inference, there is the need to do tests with appropriate statistical software (i.e. Stata and SPSS using a macro) to solve these problems and validate the hypothesis testing performed.
Thus, neither of the regressions support the following hypotheses:
I. On average, the wind power industry growth rate performance has a positive impact on merger and acquisition activity
II. On average, the solar industry growth rate performance has a positive impact on merger and acquisition activity
III. On average, oil prices have a positive impact on merger and acquisition activity.
The statistical inference procedures performed do not support the hypotheses introduced underlying the present work. This does not mean that the estimators are not valid, because the presented model assumptions could not be verified.
4.2. Limitations
This work project has had three main limitations: insufficient data, restricted use of statistical software and behavior of the chosen variables.
Regarding the data set, using monthly data was the most appropriate solution in order to have a significant number of observations in order to test the statistical inferences through a multiple linear regression through an ordinary least squares model. Prior to using this data set, there were other variables considered, but the sources were not consistent with this regression to test the same relationship: in Europe as the presented data is given on an annual basis from the beginning of the XXI century; and globally, given the number of observations.
As for the restricted use of statistical software, Microsoft Excel’s user experience revealed a limited array of options when treating data, validating assumptions and performing tests. As mentioned there was the option to compute the heteroscedasticity and autocorrelation tests in proper software. This would be a possible manner to address the verified issues in this work project to use in the future development of this assignment.
Concerning the behavior of the chosen variables, there is the need to understand the limitations of time series, lagged values, omitted variables and feedback effect. As the energy production industry is highly regulated, there can be feedback effects due to the implementation of policy changes in t-n which may have an impact in t. This variable is non-quantifiable and therefore it was not included on the model.
In the case of the United States of America, there is not an homogeneity of policy instruments across different states; adequacy of quantum and nature of subsidies; and need for
a general policy tool per public policy issue (Chavarot & Konieczny, 2015). Policies should encourage production of electricity in addition to investment in renewable energy capital, providing a consistent long-term market.
There are three major demand-pull strategies: subsidies of renewables through a system benefits charges (SBCs); Renewable Portfolio Standard (RPS); and Green Pricing. SBSs are taken in place as the tax in energy consumption is spent on promoting renewable energy projects or energy efficiency programs (Loiter & Norberg-Bohm, 1999). RPS mandates power suppliers to produce a certain percentage of total output from renewable energy resources. In its most effective practice, RPS consents the trade of renewable energy credits, as it occurs on the European Union emissions trading system (2016). Green pricing is a market-based method in which the role of government is to oblige full disclosure of information supporting individual choices.
As a result, external changes to industry regulation have a considerable impact on the average deal value, influencing the volume of aggregate yearly completed deals (Schoenberg & Reeves, 1999). The renewable industry requires a stable horizon, amidst national political cycles and the geopolitical system, in order to counterweight the volatile forces of commodities that had a peak price during the financial crisis, which act as challenges to green investment and ultimately M&A activity.
5 – Conclusion
The primary objective of this thesis was to study the determinants of Merger and Acquisition activity with a focus in the United States of America’s renewable energy industry, based on previous research and hypotheses that attempted to illustrate these triggers in the last 15 years.
As expected, the most stimulating findings of this research were related to the understanding of the complexity of events that may lead to trigger M&A activity, in particular regarding the renewable energy industry, which resulted in a limited explanatory capacity of the model.
The results of this work project indicate that there is the need for further research in order to validate the assumption, despite having consistent estimators for the relationship between a multi linear model with an adjusted logarithmic dependent variable, the growth of the solar industry and the time trend. A possible solution for this issue may be the use of a feasible generalized least squares estimation on appropriate statistical software such as STATA or SPSS. In alternative there will be the need to consider other variables such as regulation (Mitchell & Mulherin, 1996; Andrade & Stafford, 2004; Harford, 2005; Abzahd, Meyerson, & Sahagún, 2009), the impact innovation (Audretsch, 1989; Pisano, 1991).
In conclusion, this thesis does not reject previous studies, revealing a possible avenue for research that explores the recent growth in the solar industry and its impact on the ability to explain the relationship between M&A activity and the determinants within the renewable energy industry.
6 – Bibliography
Bibliography
Abzahd, O., Meyerson, P., & Sahagún, U. (2009). Determinants of Mergers and Acquisitions in the Energy Industry: Evidence from the European Market. Lund: School of
Economics and Management Lund University.
Amihud, Y., & Lev, B. (1981). Risk Reduction as a Managerial Motive for Conglomerate Mergers. The Bell Journal of Economics, 605-617.
Anand, J., & Delios, A. (2002). Absolute and Relative Resources as Determinants of International Acquisitions. Strategic Management Journal, 119-134.
Andrade, G., & Stafford, E. (2004). Investigating the Economic Role of Mergers. Jornal of Corporate Finance.
Arrhenius, S. (1896). On the Influence of Carbonic Acid in the Air upon the Temperature of the Ground. Philosophical Magazine and Journal of Science. Retrieved from
http://www.rsc.org/images/Arrhenius1896_tcm18-173546.pdf
Audretsch, D. B. (1989). The Determinants of Conglomerate Mergers. The American Economist, 52-60.
Auletta, K. (1986). Greed and Glory on Wall Street: The Fall of the House of Lehman. Random House.
Baker, M., & Wurgler, J. (2000). Investor Sentiment and the Cross-section of Stock Returns. The Journal of Finance.
Benoit, K. (2011). Linear Regression Models with Logarithmic Transformations. Retrieved from http://www.kenbenoit.net/courses/ME104/logmodels2.pdf
Berk, J., & DeMarzo, P. (2011). Corporate Finance (2 ed.). Pearson.
Berle Jr., A. A., & Means, G. C. (1932). The Modern Corporation and Private Property. The Macmillian Company.
Bradley, M., Desai, A., & Kim, E. (1983). The Rationale Behind Interfirm Tender Offers: Information or Synergy. Journal of Financial Economics, 183-206.
Breusch, T. S. (1978). Testing for Autocorrelation in Dynamic Linear Models. Australian Economic Papers, 334-355.
Breusch, T. S., & Pagan, A. R. (1979). A Simple Test for Heteroskedasticity and Random Coefficient Variation. Econometrica, 1288-1290.
Chavarot, A., & Konieczny, M. (2015). Mobilizing Private Sector Capital in Developing Countries. In C. W. Donovan, Renewable Energy Finance (pp. 152-153). London: Imperial College Press.
Christensen, H. K., & Montgomery, C. A. (1981). Corporate Economic Performance: Diversification Strategy Versus Market Structure. Strategic Management Journal, 327-343.
Cloodt, M., Hagedoorn, J., & Kranenburg, H. V. (2006). Mergers and Acquisitions: Their Effect on the Innovative Performance of Companies in High-Tech Industries. Research Policy, 642-654.
Cording, M., Christmann, P., & Weigelt, C. (2010). Measuring teoretical complex constructs: the case of acquisition performance. Strategic Organization, 11-41.
Dickey, D. A., & Fuller, W. A. (1979). Distribution of the Estimators for Autoregressive Time Series With a Unit Root. American Statistical Association, 427-431.
Drucker, P. F. (2010). As Lições de Peter F. Drucker. (C. Pedro, Trans.) Lisbon: Babel. Duhaime, I. M., & Schwenk, C. R. (1985). Conjectures on cognitive simplifications in
acquisition and divestment decision making. Academy of Management Review, 287-295.
Eisenbach, S., Ettenhuber, C., Schiereck, D., & Flotow, P. v. (2011). Beginning Consolidation in the Renewable Energy Industry and Bidders' M&A-Success. Technology and Investment, 81-91.
European Central Bank. (2007). Montly Bulletin. Retrieved from ECB:
https://www.ecb.europa.eu/pub/pdf/other/mb200708_focus03.en.pdf?571b91b0bfa889 a6b036c8b9730d3f62
European Comission. (2016). Paris Agreement. Retrieved from
http://ec.europa.eu/clima/policies/international/negotiations/paris/index_en.htm European Union. (2016). The EU Emissions Trading System. Bruxels: European Union
Publications Office. Retrieved from The EU Emissions Trading System: https://ec.europa.eu/clima/publications/docs/factsheet_ets_en.pdf
Evans, B., Nyquist, S., & Yanosek, K. (2016). Mergers in a low-oil-price environment: Proceed with caution. Retrieved from Mckinsey & Company:
http://www.mckinsey.com/industries/oil-and-gas/our-insights/mergers-in-a-low-oil-price-environment-proceed-with-caution
Frankfurt School-UNEP Centre & BNEF. (2016). Retrieved from
http://fs-unep-centre.org/sites/default/files/publications/globaltrendsinrenewableenergyinvestment20 16lowres_0.pdf
Fuller, W. A. (1976). Introduction to Statistical Time Series. New York: John Wiley and Sons.
Golbe, D. L., & White, L. J. (1993). Catch a Wave: The Time Series Behavior of Mergers. The Review of Economics and Statistics, 493-499.
Gort, M. (1969). An Economical Disturbance Theory of Mergers. The Quarterly Journal of Economics.
Gort, M., & Hogarty, T. F. (1970). New Evidence on Mergers. Journal of Law and Economics, 167-84.
Griffiths, W. E., Hill, R. C., & Judge, G. G. (1993). Learning and Practicing Econometrics. John Wiley & Sons.
Haleblian, J., Devers, C. E., McNamara, G., Carpenter, M. A., & Davison, R. B. (2009). Taking Stock of What We Know About Mergers and Acquisitions: A Review and Research Agenda. Journal of Management, 469-502.
Harford, J. (2005). What Drives Merger Waves. Journal of Financial Economics, 529-560. Harzing, A.-W. (2001). Acquisition versus Greenfield Investments: International Strategy and
Management of Entry Modes. Strategic Management Journal.
Holl, P., & Kyriazis, D. (1997). Wealth Creation and Bid Resistance in UK Takeover Bids. Strategic Management Journal, 483-498.
IPCC. (2013). Retrieved from
http://www.ipcc.ch/news_and_events/docs/factsheets/FS_what_ipcc.pdf J. P. Morgan. (2016). Retrieved from
https://www.jpmorgan.com/global/insights/maglobaloutlook
Jensen, M., & Ruback, R. (1983). The Market for Corporate Control: The Scientific Evidence. Journal of Financial Economics, 5-50.
Johnson, J., & Tellis, G. J. (2008). Drivers of Success for Market Entry into China and India. Journal of Marketing Vol. 72.
Joshi, H. (2012). Multicollinearity Diagnostics in Statistical Modelling and Remedies to deal with it using SAS. Retrieved from Cytel: http://www.cytel.com/hubfs/0-library-0/pdfs/SP07.pdf
Jovanovic, B., & Rousseau, P. L. ( 2002). The Q-Theory of Mergers. American Economic Review, 92(2), 198-204.
Kamerschen, D. R. (1970). A Theory of Conglomerate Mergers: Comment. Quarterly Journal of Economics, 668-673.
Kepler, S. (1997). Industry Life Cycles. Industrial and Corporate Change, 145-178. Koller, T., Goedhart, M., & Wessels, D. (2005). Valuation: Measuring and Managing the
Value of Companies. Mckinsey & Company, Inc.
Kwoka, J., & Pollitt, M. (2010). Do mergers improve efficiency? Evidence from restructuring the US electric power sector. International Journal of Industrial Organization.
Lazonick, W., & O’Sullivan, M. (2000). Maximizing shareholder value: a new ideology for corporate governance. Economy and Society, 13–35.
Linn, S. C., & Zhu, Z. (1997). Aggregate Merger Activity: New Evidence on the Wave Hypothesis. Southern Economic Journal, 130-146.
Loiter, J. M., & Norberg-Bohm, V. (1999). Technology Policy and Renewable Energy: Public Roles in the Development of New Energy Technologies. Energy Policy, 85-97.
Loughran, T., & Vijh, A. M. (1997). Do Long-Term Shareholders Benefit from Corporate Acquisitions? Journal of Finance, 52(5), 1765-1790.
Magni, C. A. (2008). Investment Decisions, Net Present Value and Bounded Rationality. Munich University Library.
Maksimovic, V., & Phillips, G. (2008). The Industry Life Cycle, Acquisitions and Investment: Does Firm Organization Matter? The Journal of Finance, 673-708. Mandelker, G. (1974). Risk and Return: The Case of the Merging Firm. Journal of Financial
Economics, 303-335.
Mitchell, M. L., & Mulherin, J. H. (1996). The impact of industry shocks on takeover and restructuring activity. Journal of Finance Economics.
Moeller, S., Stulz, R., & Schlingemann, F. (2005). Wealth Destruction on a Massive Scale: A Study of Acquiring Firm Returns in the Recent Merger Wave. Journal of Finance, 757-782.
Nelson, R. L. (1959). Merger Movements in American Industry, 1895-1956. Princeton University Press.
Nyquist, S. (2015). Lower oil prices but more renewables: What’s going on? Retrieved from Mckinsey & Company:
http://www.mckinsey.com/industries/oil-and-gas/our-insights/lower-oil-prices-but-more-renewables-whats-going-on
Obama, B. (2014, September). Remarks by the President at U.N. Climate Change Summit . Retrieved from The White House:
https://www.whitehouse.gov/the-press-office/2014/09/23/remarks-president-un-climate-change-summit
Owen, S., & Yawson, A. (2009). Corporate Life Cycle and M&A Activity. Journal of Banking and Finance, 427-440.
Oxford University Press. (2016). Oxford Reference. Retrieved from Oxford Reference: http://www.oxfordreference.com/view/10.1093/oi/authority.20110803100228183 Phillips, T., Harvey, F., & Yuhas, A. (2016, September). Breakthrough as US and China
https://www.theguardian.com/environment/2016/sep/03/breakthrough-us-china-agree-ratify-paris-climate-change-deal
Pisano, G. P. (1991). The Governance of Innovation: Vertical integration and collaborative arrangements in the biotechnology industry. Research Policy.
Pollock, D. G. (n.d.). Trends in Economic Series. Retrieved from Time Series: http://www.le.ac.uk/users/dsgp1/COURSES/TSERIES/1TRENDS.PDF
Porter, M. E. (1979). The Five Competitive Forces that Shape Strategy. Harvard Business Review, 137-145.
Porter, M. E. (1980). Competitive Strategy. Free Press.
Rappaport, A. (2006). Ten Ways to Create Shareholder Value. Harvard Bussiness Review. Reed College. (2013). CHAPTER 2: Regression With Stationary Time Series. Retrieved from
Reed College: http://www.reed.edu/economics/parker/312/tschapters/S13_Ch_2.pdf Root, F. R. (1998). Entry Strategies for International Markets, 2nd, Revised and Expanded
Edition . Jossy-Bass.
Royal Holloway University of London. (2018). Lecture 18 - Autocorrelation & Dynamic Models. Retrieved from Royal Holloway University of London: personal
uk/uhte/006/ec2203/Lecture%2018_Autocorrelation&DynamicModels.pdf
Sadorsky, P. (2012). Correlations and volatility spillovers between oil prices and the stock prices of clean energy and technology companies. Energy Economics, 248-255. Schoenberg, R., & Reeves, R. (1999). What Determines Acquisition Activity within an
Industry. European Management Journal.
Shimizu, K., Hitt, M. A., Vaidyanath, D., & Pisano, V. (2004). Theoretical foundations of cross-border mergers and acquisitions: A review of current research and
recommendations for the future. Journal of International Management. Shleifer, A., & Vishny, R. W. (2003). Stock Market Driven Acquisitions. Journal of
Financial Economics, 295-311.
Sorgenfrey, M., & Munch, L. (2009). Market Entry: Fast Moving Consumer Goods Companies in Emerging Markets. Retrieved from http://pure.au.dk/portal-asb-student/files/8180/Final_thesis_1___2___forside_-_appendix.pdf
Stein, J. C. (1988). Takeover Threats and Managerial Myopia. Journal of Political Economy, 96(1).
Stein, J. C. (1989). Efficient Capital Markets, Inefficient Firms: A model of Myopic Corporate Behavior. Quarterly Journal of Economics.
Stigler, G. (1965). The development of Utility Therory. In G. Stigler, Essays in the History of Economics. Chicago: University of Chicago Press.
The Nobel Foundation. (2007). Nobelprize.org. Retrieved from http://www.nobelprize.org/nobel_prizes/peace/laureates/2007/
Trautwein, F. (1990). Merger Motives and Merger Prescriptions. Strategic Management Journal, 283-295.
U.S. Energy Information Administration. (2016). Retrieved from https://www.eia.gov/forecasts/ieo/world.cfm
U.S. Energy Information Administration. (2016). Retrieved from
https://www.iea.org/publications/freepublications/publication/KeyWorld2016.pdf U.S. Energy Information Administration. (2016). International Energy Outlook 2016.
Retrieved from http://www.eia.gov/forecasts/ieo/pdf/0484(2016).pdf
United Nations Framework Convention on Climate Change. (2014). United Nations
Vermeulen, F., & Barkema, H. (2001). Learning through acquisitions. Academy of Management Journal 44, 457-476.
Vernon, R. (1966). International Investment and International Trade in the Product Life Cycle. Quarterly Journal of Economics, 190-207.
Wells, L. T. (1966). The Product Life Cycle and International Trade. Cambridge: Harvard University Press.
Wicklin, R. (2011, 4). Log transformations: How to handle negative data values? Retrieved from SAS: http://blogs.sas.com/content/iml/2011/04/27/log-transformations-how-to-handle-negative-data-values.html
Wooldridge, J. M. (2009). Introductory Econometrics. In A Modern Approach. South-Western Cencage Learning.
Yagil, J. (1996). Mergers and macro-economic factors. Review of Financial Economics, 81-190.
Yoo, K., Lee, Y., & Heo, E. (2013). Economic effects by merger and acquisition types in the renewable energy sector: An event study approach. Renewable and Sustainable Energy Reviews.