Arctic microbiome and
N-functions during the
winter-spring
transition
António Gaspar Gonçalves de Sousa
Mestrado de Biologia Celular e Molecular
Departamento de Biologia da Faculdade de Ciências da Universidade do Porto Dissertação de Mestrado
2016/2017
Orientador
Catarina Maria Pinto Mora Pinto de Magalhães,
Professora Auxiliar Convidada na Faculdade de Ciências da Universidade do Porto e Investigadora no Centro Interdisciplinar de Investigação Marinha e Ambiental (CIIMAR)
Co-orientador
Pedro Manuel da Silva Duarte,
Investigador Científico no Instituto Polar Norueguês (NPI)
Co-orientador
Luís Fernando Rainho Alves Torgo,
Professor Associado na Faculdade de Ciências da Universidade do Porto e Investigador Científico Instituto de Engenharia de Sistemas e Computadores, Tecnologia e Ciência (INESC TEC)
Todas as correções determinadas pelo júri, e só essas, foram efetuadas. O Presidente do Júri, Porto, _____/_____/_____
Dissertação de candidatura ao grau de Mestre em
Biologia Celular e Molecular submetida à
Faculdade de Ciências da Universidade do Porto.
A presente tese foi desenvolvida no Centro
Interdisciplinar de Investigação Marinha e
Ambiental (CIIMAR), sob a orientação científica
da Doutora Catarina Magalhães, do Doutor Pedro
Duarte, e do Doutor Luís Torgo.
Dissertation for applying to a Master’s degree in
Cell and Molecular Biology, submitted to the
Faculty of Sciences of the University of Porto.
The present thesis was developed at the
Interdisciplinary Center for Marine and
Environmental Research (CIIMAR) under the
scientific supervision of PhD Catarina Magalhães,
PhD Pedro Duarte, and PhD Luís Torgo.
“Everything is everywhere, but the environment selects”
Baas-Becking (1934)
Agradecimentos
Antes de mais, gostaria de endereçar um agradecimento especial aos meus supervisores, Dra. Catarina Magalhães, Dr. Pedro Duarte e Dr. Luís Torgo, pela atenção, apoio e oportunidade que me foi dada para desenvolver esta dissertação.
Agradeço também a disponibilização de infraestruturas e equipamentos ao laboratório ‘Funcionamento de Ecossistemas e Biorremediação’ (EcoBioTec) assim como ao respetivo ‘Centro Interdisciplinar de Investigação Marinha e Ambiental’ (CIIMAR) que possibilitaram realizar parte das tarefas experimentais relacionadas com o presente trabalho. Aproveito a oportunidade para agradecer a excelente colaboração e receção por parte dos nossos colaboradores do Instituto Polar Norueguês (NPI), especialmente pela ajuda do Philipp Assmy, na interpretação dos dados de identificação de fitoplâncton.
O meu muito obrigado a uma extraordinária equipa multidisciplinar jovem e dedicada, que integra ou integrou o EcoBioTec, durante o meu período de dissertação e demonstrou um grande sentido crítico e companheirismo.
Particularmente àqueles que intervieram de forma proactiva e construtiva para esta tese. Um especial agradecimento à Maripà por todo o suporte, ajuda e esclarecimento nas análises bioinformáticas. Ao Hugo pela interpretação dos dados. Ao João, Paula, Jacinto e Adriana pelo esclarecimento das pequenas dúvidas intermináveis, e horas de companheirismo.
Também quero agradecer às instituições que financiaram este trabalho, nomeadamente ao Research Council of Norway (projeto Boom or Bust no. 244646) e ao NORTE2020, Fundo Europeu de Desenvolvimento Regional (FEDER) programas estruturados R&D&I CORAL - 01-0145-FEDER-000036 e MarInfo - NORTE-01-0145-FEDER-000031. Obrigado ao Programa Polar Português (PROPOLAR), financiado pela Fundação para a Ciência e a Tecnologia (FCT), pela bolsa de estudo de curto prazo para jovens investigadores 2016 - Fase 2 -, que permitiu a minha curta estadia no NPI.
Um último agradecimento a todos os colegas e professores do Mestrado de Biologia Celular e Molecular (M:BCM) dado durante 2015-2017, na FCUP.
Resumo
Uma das manifestações mais proeminentes das alterações climáticas é a mudança de regime do gelo marinho do Ártico, com uma redução na sua extensão durante o verão e uma substituição de grande parte do gelo perene e espesso por gelo com menos de um ano e de menor espessura. As comunidades microbianas são uma componente chave no momento de avaliar o impacto ecológico do regime de gelo em mudança do Ártico, pois constituem a base das redes tróficas marinhas do Ártico e dos ciclos biogeoquímicos.
Durante a Norwegian young sea ICE expedition (N-ICE2015), que decorreu no gelo à deriva a norte de Svalbard entre Janeiro e Junho de 2015, foram recolhidas amostras de água, a 5, 20 ou 50 e 250 m de profundidade nos dias 9 de Março, 27 de Abril e 16 de Junho, juntamente com dados físicos e biogeoquímicos. Através da sequenciação massivamente paralela do amplicon da subunidade pequena ribossomal do ADN (SSU
rDNA, sigla anglo-saxónica), bem como ADN ambiental (i.e., metagenómica) obtivemos
informação acerca da diversidade, da estrutura e das funções relacionadas com o ciclo do azoto (N) do microbioma do Ártico durante a transição inverno-primavera.
Os resultados mostram que, ao nível da composição, Alpha- (30.7%) e
Gammaproteobacteria (28.6%) são os grupos mais abundantes na coleção procariótica
N-ICE2015, e também os mais diversos filogeneticamente. As tendências de inverno para o início do verão são bastante evidentes com os thaumarchaeotas a representarem uma grande fração das comunidades na coluna de água abaixo do gelo na primavera e praticamente ausentes próximo ao verão. Além disso, o surgimento de Flavobacteria e do clado SAR92 no final da primavera pode estar associado à degradação de um bloom precoce de primavera dominado por Phaeocystis. Surpreendentemente, encontrou-se uma grande representatividade e elevada abundância relativa de bactérias hidrocarbonoclásticas, particularmente Marinobacter (6.3%) e Alcanivorax (54.3%). Estes filótipos suportam a evidência de uma biosfera rara do Ártico propensa a degradar hidrocarbonetos derivados de petróleo e provavelmente associada à infiltração de óleo natural. Além disso, as thaumarchaeotas oxidantes de amoníaco (TAO, sigla anglo-saxónica) não apenas têm uma elevada frequência de ocorrência nas águas cobertas de gelo durante o inverno e a primavera (5 e 50 m de profundidade) bem como as bactérias oxidantes de nitrito (NOB, sigla anglo-saxónica). No entanto, estes grupos estão quase
ausentes próximo ao verão, sugerindo atividade nitrificante ativa debaixo do gelo à deriva apenas no inverno e primavera. Os genes que codificam a urease e ammonia monooxygenase estão correlacionados positivamente com o N total dissolvido, que inclui a ureia, sugerindo que ambas as vias, a ureólise e a oxidação aeróbia do amoníaco estão acopladas. Um dos genes que codifica a urease aumenta ao longo da profundidade, sugerindo que populações de TAO distintas encontradas na coluna de água do Oceano Ártico têm um potencial genómico diferente para realizar a ureólise. Apesar do esforço de sequenciação feito, não foram encontradas evidências genómicas que suportem as vias de fixação, anammox e desnitrificação do azoto.
As bibliotecas microbianas e metagenómica da coleção N-ICE2015 analisadas neste estudo forneceram dados de sequenciação de alto rendimento ao longo da profundidade e da transição de inverno para primavera, que ajudam a melhorar o conhecimento atual sobre a microbiota assim como as comunidades e vias do ciclo-N no Oceano Ártico.
Palavras-chave: Oceano Ártico, Microbiota, Microbioma, SSU rDNA amplicon,
Metagenómica Shotgun Ambiental, Diversidade, Estrutura, Procariotas, Protistas, Vias Biogeoquímicas-N
Abstract
One of the most prominent manifestations of climate change is the changing Arctic sea-ice regime with a reduction in the summer sea-ice extent and a shift from thicker, perennial multiyear ice towards thinner, first-year ice. Microbial communities are a key component when evaluating the ecological impact of the Arctic’s changing ice regime, as they constitute the basis of Arctic marine food webs and biogeochemical cycles.
During the Norwegian young sea ICE expedition (N-ICE2015), that took place in drifting pack ice north of Svalbard between January and June 2015, seawater was collected, at 5, 20 or 50 and 250 m depth in 9th March, 27th April and 16th June, together with physical and biogeochemical data. Through the massively parallel sequencing of small subunit ribosomal DNA (SSU rDNA) amplicon as well as environmental DNA (i.e., metagenomics) we got a snapshot of the Arctic’s microbiome diversity, structure and key N-cycling functions through the winter-spring transition.
Results shows that, at compositional level, Alpha- (30.7%) and
Gammaproteobacteria (28.6%) are the most abundant across the prokaryotic N-ICE2015
collection, and also the most phylogenetically diverse. Winter to early summer trends are quite evident since there was a high relative abundance of thaumarchaeotes in the under-ice water column in late winter while this group was nearly absent during early summer. Moreover, the emergence of Flavobacteria and the SAR92 clade in late spring might be associated to the degradation of an early spring bloom of Phaeocystis. Surprisingly it was found a great representativeness and high relative abundance of hydrocarbonoclastic bacteria, particularly Marinobacter (6.3%) and Alcanivorax (54.3%). This phylotypes supports evidence of an Arctic’s unexpected biosphere, prone to degrade petroleum-derived hydrocarbons and probably associated to natural oil seepage. In addition, not just thaumarchaeal ammonia oxidizers (TAO) have a high frequency of occurrence in the subsurface waters underneath the winter-spring pack ice (5 and 50 m depth), but also nitrite-oxidizing bacteria (NOB). However, they are nearly absent close to summer, suggesting active nitrifying activity underneath of winter-spring pack ice. Urease and ammonia monooxygenase encoding genes are positively correlated with total dissolved nitrogen (N), which includes urea, suggesting that both pathways, ureolysis and aerobic ammonia oxidation, are coupled. Urease encoding gene increases along depth suggesting
that distinct TAO populations found in the water column of the Arctic Ocean have different genomic potential to carry out ureolysis. In spite of the sequence effort made, it was not found genomic evidences to support nitrogen fixation, anammox and denitrification pathways.
The microbial and metagenomic libraries from N-ICE2015 collection analysed in the present study provides comprehensive new knowledge about the microbiota and N-cycling communities and pathways in the Arctic Ocean during the winter to spring transition.
Keywords: Arctic Ocean, Microbiota, Microbiome, SSU rDNA amplicon,
Environmental Shotgun Metagenomics, Diversity, Structure, Prokaryotes, Protists, N-Biogeochemical Pathways
Table of contents
Agradecimentos……….
IResumo………
IIIAbstract………....
VTable of contents………
VIIList of figures………...
XIList of tables……….….
XIIIList of abbreviations………...
XVIntroduction………..……….
11. Assessing the Microbial Diversity and Functionality………...2
1.1. Traditional Methods - DNA-independent………..2
1.2. Modern Methods - DNA-dependent………...2
1.2.1. Next-Generation Sequencing………...4
1.3. Bioinformatics Pipelines and Databases………6
2. Objectives and Thesis Organization………..9
1
stChapter: Pelagic Microbial Communities from an Arctic Drift Ice during
Winter to Spring Transition North of Svalbard………...
111. Background………..
121.1. Norwegian young sea Ice expedition 2015: motivation………...12
1.2. Microbial Oceanography: polar oceans………12
1.4. Objectives……….14
2. Methods………...
152.1. Sampling Sites……….……….15
2.2. Water Column Sampling: environmental data and microbial collection………….17
2.3. DNA Extraction, PCR, Library Preparation, and Sequencing of SSU rDNA amplicon………..19
2.4. Bioinformatics Pipeline: SSU rDNA amplicon...19
2.4.1. Upstream Sequence Analysis: raw OTU table………..19
2.4.2. Downstream Sequence Analysis: composition……….20
2.4.3. Downstream Sequence Analysis: diversity and structure……….21
2.4.4. Taxonomic Assignment of 18S rDNA Amplicon Libraries: Protist Ribosomal Reference database………..21
2.5. Availability of Sequencing Data………..22
3. Results and discussion……….
223.1. Metabarcoding the Arctic Microbiota through the Winter-Spring Transition: prokaryotic and protistan communities………...22
3.1.1. The Dominant Proteobacteria and its Co-occurrence Patterns with Eukaryotes………...23
3.1.2. Evidences of High Frequencies of Hydrocarbon-degrading Bacteria in the Arctic………...27
3.1.3. Link Between Flavobacteriales and Phaeocystis pouchetii Arctic Spring Bloom………..………29
3.1.4. The Evident Seasonal Pattern of the phylum Thaumarchaeota………...31
3.1.5. Composition and Distribution of Picoeukaryotes within the N-ICE2015 Collection………34
3.2. Seasonal and Depth Dependent Trends in Arctic’s Microbial Diversity...35
4. Conclusions………..
392
ndChapter: N-Cycling Microbial Communities and Pathways in the Arctic
Ocean………...…
411. Background………..
421.1. Primary Production in the Arctic Ocean: past, present and future………...…42
1.2. Inputs of Nitrogen in the Arctic Ocean: allochthonous and autochthonous
sources……….42
1.3. N-Biogeochemistry in the World’s Oceans: communities and pathways…………43
1.4. N-Biogeochemistry in the Arctic Ocean: communities and pathways……….45
1.5. Objectives……….47
2. Methods………...
48 2.1. Sampling Sites, Water Column Sampling, DNA Extraction, PCR, LibraryPreparation and Sequencing of 16S rDNA amplicon………..48
2.2. Library Preparation and Sequencing of Metagenomes………48
2.3. EBI Metagenomics Pipeline: upstream analysis of metagenomic reads…………..48
2.4. EBI Metagenomics Pipeline: downstream analysis of metagenomic reads……….49
2.5. ORCA Platform: Spearman correlations between IPRs related to N-biogeochemical pathways and environmental variables………50
3. Results and discussion……….
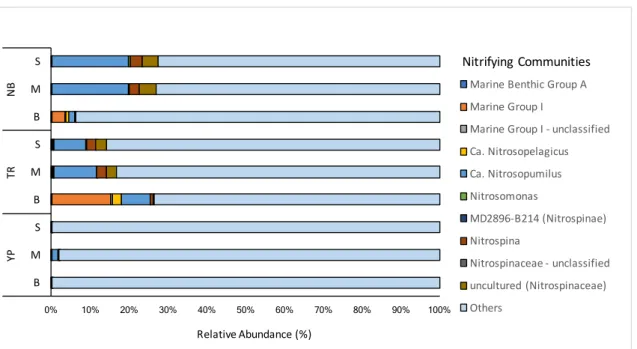
53 3.1. N-Cycling Microbial Communities and Pathways in the Arctic Ocean…………...533.1.1. Nitrifying Communities……….53
3.1.3. N-Biogeochemical Pathways……….57
4. Conclusions………..
64References………
65List of figures
Figure 1 - Map highlighting the sampling sites (red dots) north of Svalbard. ………...16
Figure 2 - Taxonomic profile of prokaryotic N-ICE2015 collection. ………24
Figure 3 - Taxonomic profile of eukaryotic N-ICE2015 collection. ………..26
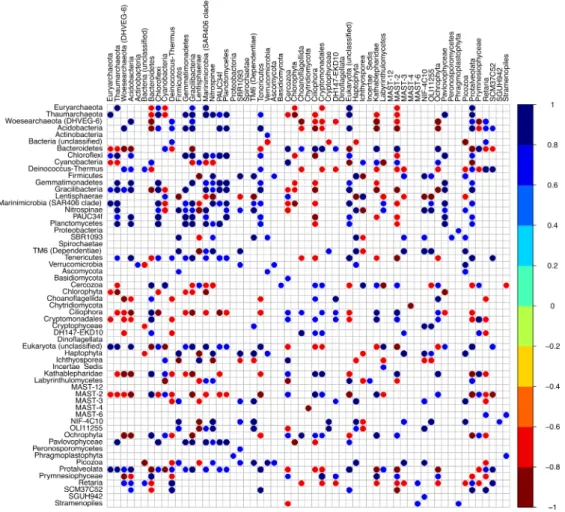
Figure 4 - Heatmap highlighting the significant Spearman correlations between the phyla from the microbial N-ICE2015 collection. ………...32
Figure 5 - Heatmap highlighting the Spearman correlation matrix between microbial phyla and environmental variables collected during the N-ICE2015 cruise. ………….33
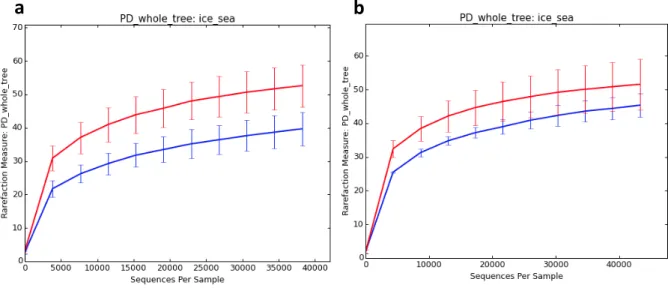
Figure 6 - Faith's Phylogenetic Diversity metric for sample groups snow-covered sea ice (red line, all samples collected in NB and TR) and sea-ice without snow (blue line, all samples collected in YP). ……….……..36
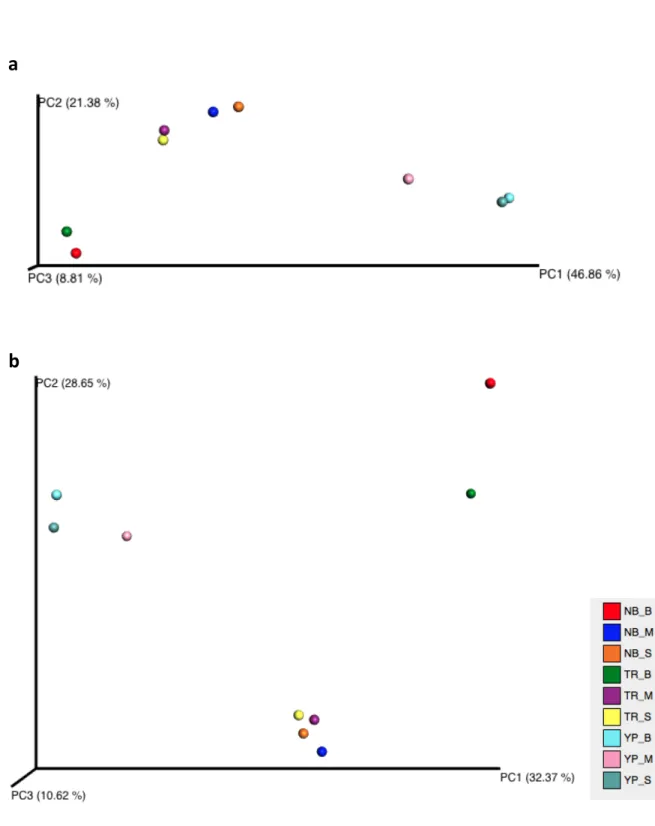
Figure 7 - PCoA of unweighted UniFrac distances across all samples. ……….38
Figure 8 - Distribution of nitrifying communities across the prokaryotic N-ICE2015 collection. ………...55
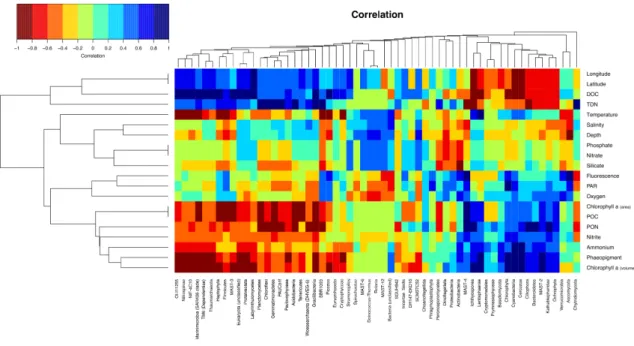
Figure 9 - Heatmap showing the significant Spearman correlations among the enzymes (i.e., family, domain) involved in the different biogeochemical pathways along the N-ICE2015 cruise. ………..61
Figure 10 - Heatmap showing the Spearman correlation matrix between enzymes (i.e., family, domain) involved in N-pathways and some environmental controls. …………63
List of tables
Table 1 - Features of sampling conditions of microbial N-ICE2015 collection. ……...18
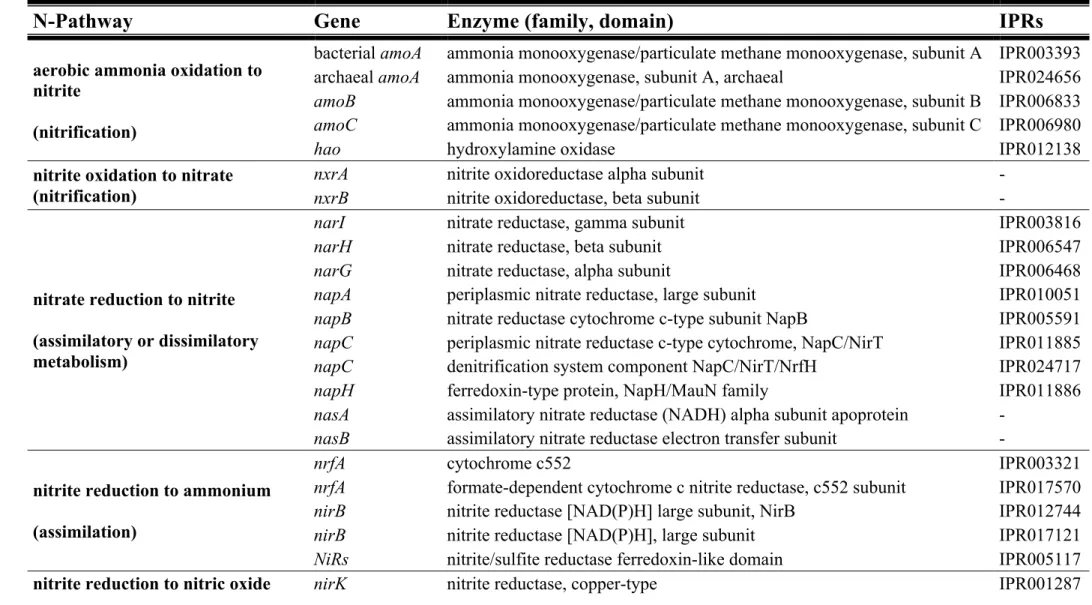
Table 2 - Nitrogen-biogeochemical cycle: pathways, genes, enzymes, and, the
respective InterPro accession number (IPRs). ………51
Table 3 - Absolute number of metagenomics reads that match nitrogen-cycle related InterPro accession number (IPRs) across samples collected during N-ICE2015
List of abbreviations
°C - degrees Celsius µm – micrometre
16S rDNA - 16S ribosomal deoxyribonucleic acid 18S rDNA - 18S ribosomal deoxyribonucleic acid aka - also known as
AMO - ammonia monooxygenase APS - adenosine 5’-phosphosulfate ATP - adenosine triphosphate
BAC - bacterial artificial chromosome
BLAST - Basic Local Alignment Search Tool bp - base pair
C - carbon
Ca. - Candidatus
Chl a - Chlorophyll a CO2 - carbon dioxide
COG - Clusters of Orthologous Groups of proteins CRT - cyclic reversible termination
DMSP - 3-dimethylsulphoniopropionate DNA - deoxyribonucleic acid
dNTPs - deoxynucleotide triphosphates DOC - dissolved organic carbon DOM - dissolved organic matter
e.g. - exempli gratia
eDNA - environmental DNA EMG - EBI Metagenomics
ENA - European Nucleotide Archive FYI - first-year ice
Gb - gigabase pair
i.e. - id est
IAOOS - Ice-Atmosphere-Arctic Ocean Observing System IMG/M - Integrated Microbial Genomes and Metagenomes
IPR - InterPro accession number kb - kilobase pair
KEGG - Kyoto Encyclopedia of Genes and Genomes L - litre
m – metre
MAW - modified Atlantic water Mb - megabase pairs
MGI - Marine Group I
MG-RAST - MetaGenome Rapid Annotation using Subsystem Technology MYI - multi-year ice
N - any base N - nitrogen N2 - di-nitrogen NB - Nansen Basin NGS - next-generation sequencing NH4+ - ammonium
N-ICE2015 - Norwegian young sea ICE expedition NO2- - nitrite
NO3- - nitrate
NOB - nitrite-oxidizing bacteria OMZ - oxygen minimum zones OSD - Ocean Sampling Day
OTUs - operational taxonomic units PAR - photosynthetically active radiation PCoA - principal coordinate analysis PCR - polymerase chain reaction Pfam - Protein family database pH - potential of hydrogen PO43- - phosphate
POC - particulate organic carbon PON - particulate organic nitrogen PPi – pyrophosphate
PSW - polar surface water
PSWw - warm polar surface waters
QIIME - Quantitative Insights into Microbial Ecology RDP - Ribosomal Database Project
RV Lance - Research Vessel Lance SBS - sequencing-by-synthesis SiO44- - silicate
SNA - single-nucleotide addition SOP - standard operating procedure sp. - species (singular)
spp. – species (plural)
TAO - thaumarchaeal ammonia oxidizers TDN - total dissolved nitrogen
TR - Transition Region v. - version
VBNC - viable but nonculturable YP - Yermak Plateau
1.
Assessing the Microbial Diversity and Functionality
1.1. Traditional Methods - DNA-independentTraditional microbial ecology methods rely on cultivation-dependent approaches which causes an enormous bottleneck in the composition assessment of microbial communities. Microbiologists refer to this phenomenon as “the great plate count anomaly” in which ≤ 1% of microbial diversity is recovered from environmental soil samples (Staley and Konopka, 1985; Hugenholtz, 2002). The percentage of viable but nonculturable (VBNC) microbes is even lower to the much less explored vastness of the ocean. The incapacity to access the microbial “dark matter” (the VBNC fraction) arose from the inability of microbiologists to: replicate natural environments in artificial/synthetic media, in part due to the lack of knowledge of environmental/nutritional the remaining 99% to be discovered; and to look to microbes as highly complex, interactive individuals of multi-assemblages instead as tiny, independent parts of communities (Joint et al., 2010). The complexity of the bacterial world is well mirrored in their ability to take concerted behaviours (phenotypes), such as virulence, competence and sporulation, in a population-density-dependent manner through cell-to-cell communication (Miller and Bassler, 2001; Waters and Bassler, 2005). Despite this quorum sensing activity has been studied for more than four decades since it was discovered (Nealson et al., 1970) and their potential ecological impact in marine biogeochemistry cycles (Doberva et al., 2015; Hmelo, 2016), our knowledge still remains scarce about it.
1.2. Modern Methods - DNA-dependent
Modern microbial ecology relies on advances in molecular biology during the second half of the last century that allowed the application of a broad-spectrum of molecular techniques in order to profile microbial communities’ composition. The successful use of 16S rRNA (16S ribosomal ribonucleic acid) gene to assign single-species assemblages of a certain community to a unique taxon was a breakthrough in the field of microbial ecology (Pace, 1997). This kind of studies provided us an accurate and reliable way to access the assemble of species that comprise one environmental microbial community, but there is a lack of confidence about many of the functions predicted and
consequently the services delivered by the community to the ecosystem. Therefore, the low-cost and the high-throughput provided by next-generation sequencing (NGS) technologies, over the last decade until now, aided greatly to solve this problem with the rise of metagenomics. Metagenomics is the scientific field that study the collective genomes of a microbial community, whether archaea, bacteria, virus and eukaryotes (Handelsman et al., 1998; Handelsman, 2004). The latter, to a lesser degree, due to the huge size of eukaryotic genomes with large portions of non-coding DNA (deoxyribonucleic acid) with repetitive sequences which makes difficult to sequence and assemble, respectively. The term metagenomics could also be erroneously applied to any study regarding the sequencing of multiple genomic regions or target genes, e.g., 16S-based metagenomics, from environmental samples that allow to study one community (problem addressed in Esposito and Kirschberg, (2014)). Here, the term metagenomics will be employed to mention the random shotgun sequencing of all environmental DNA (aka whole genome shotgun metagenomics) in order to get the functional and taxonomic content of microbial communities circumventing the pure culture needs. Metagenomics is driven at two levels: functional and sequence (detailed in Handelsman, (2004)). Function-driven relies on the analysis of interesting traits/phenotypes that are heterologous expressed in one metagenomic library, like resistance to antibiotics. Clones displaying the interested trait are picked and sequenced (Handelsman, 2004; Riesenfeld
et al., 2004). Thus, function is easily associated to nucleotide sequence. Whereas,
sequence-driven analysis focus on similarity searches against reference databases. All the clones or only those anchoring the taxonomic marker of interest are selected and sequenced (Handelsman, 2004; Riesenfeld et al., 2004). The function of the genomic fragments sequenced can be predicted by means of similarity searches against reference databases (Handelsman, 2004; Riesenfeld et al., 2004). The former lacks any phylogenetic information regarding the sequence origin, while the latter could have if included one taxonomic marker (Handelsman, 2004; Riesenfeld et al., 2004). Both strategies were developed before the NGS advent relying on Sanger sequencing. Basically, the environmental DNA (eDNA) extracted is sheared in small pieces - shotgun -, which are inserted into a vector like BAC (bacterial artificial chromosome) and cloned in a host (usually Escherichia coli) in order to get a metagenomic library to be sequenced using the dye-termination biochemistry developed by Sanger (Handelsman et al., 1998; Handelsman, 2004; Riesenfeld et al., 2004). Since the sequence content, nucleotide and
their order, is determined by doing an electrophoresis in a 96 or 384-capillary-based gel, the throughput - number of reads sequenced by run - offered is very limited (Shendure and Ji, 2008). Although, it reaches a high read-length of ~1 kb (kilo base pairs) representing the “gold standard” of sequencing technologies with a base-call (the assignment of nucleotides to electropherogram peaks) accuracy of 99.999% (Shendure and Ji, 2008).
1.2.1. Next-Generation Sequencing
Next-generation sequencing rely on massive parallel sequencing of thousands to millions of clonal clusters, the so-called polonies (=polymerase colonies; Shendure and Ji, 2008; Wooley et al., 2010; Goodwin et al., 2016). 454 (Roche), Ion Torrent (Thermo Fisher) and Illumina (sometimes referred as Solexa) are among the most widely used NGS platforms, because they are affordable for small laboratories and offer high-throughput. The workflow followed is quite similar to the traditional Sanger, but the clones and libraries are constructed in vitro instead of in vivo. Clusters (=clones) are amplified in vitro through PCR (polymerase chain reaction) cycles and the libraries (the set of clusters) sequenced using one of sequencing-by-synthesis (SBS) chemistries (Shendure and Ji, 2008; Metzker, 2010; Loman et al., 2012; Goodwin et al., 2016). SBS is the sequencing process catalysed by an enzyme, a polymerase or ligase, over a primed template (Goodwin et al., 2016). It differs among the biochemistries whether it stops at each cycle or not: cyclic reversible termination (CRT) or single-nucleotide addition (SNA), respectively (Goodwin et al., 2016). Quickly, 454 and Ion Torrent makes use of emulsion PCR to amplify the clusters linked to the beads (Loman et al., 2012; Goodwin
et al., 2016). Then, SBS takes place at each cluster through the cyclic addition of each
kind of dNTPs (deoxynucleotide triphosphates) - SNA (Loman et al., 2012; Goodwin et
al., 2016). Since a different dNTP is added at each cycle, it is known which one dNTP is
incorporated by the polymerase at each cycle. The detection of the signal released during the template extension differs between the two technologies. The former is based on pyrosequencing, in which the dNTPs incorporated release PPi (pyrophosphate) to yield ATP (adenosine triphosphate), in the presence of APS (adenosine 5’-phosphosulfate) and sulfurylase (Shendure and Ji, 2008; Metzker, 2010). ATP will be used by luciferase to catalyse a burst of light detected by a charge-coupled device camera (Loman et al., 2012;
Goodwin et al., 2016). The latter (Ion Torrent), at each time that a dNTP is incorporated, protons are released (Loman et al., 2012; Goodwin et al., 2016). The protons released change the pH (potential of hydrogen) which detected by a semi-conductor membrane (Loman et al., 2012; Goodwin et al., 2016). On the other hand, Illumina relies on bridge PCR to amplify the clusters linked to one of the two oligonucleotides tethered to the flow-cell - a glass slide with 8 lanes (Shendure and Ji, 2008; Metzker, 2010). This linkage is established by pairing the complementary sequence of adapters, introduced before. Also, the adapters possess the index (aka barcode) and sequencing primers regions to allow the multiplexing of several samples and the SBS process, respectively. Afterwards, the library is sequenced by using a polymerase to make the extension of the forward primed-template in a CRT way (Shendure and Ji, 2008; Metzker, 2010). CRT technology works by making used of reversible terminators. Reversible terminators are dNTPs with the 3’-hydroxyl (OH) group blocked by a cleavable moiety (Shendure and Ji, 2008; Metzker, 2010). This allows to stop the SBS reaction at each cycle in a reversible way. In addition, each one of the four 3’-blocked reversible terminators have a different cleavable fluorophore linked to the nucleobase (Shendure and Ji, 2008; Metzker, 2010). At each cycle that is incorporated one of the four reversible terminators added, the polymerase repairs the 3’-OH group and release the fluorophore (Shendure and Ji, 2008; Metzker, 2010). Ultimately, the wave-length of the excited fluorophore will be detected by a total internal reflection fluorescent device with two lasers (Shendure and Ji, 2008; Metzker, 2010). The same process can be repeated using the reverse sequence as template - paired-end sequencing. The same is valid to the other two platforms above-mentioned. Moreover, it ensures high quality reads in the overlapping regions between forward and reverse reads. The read-length is determined by the number of cycles and the base-call by the emission wave-length and signal intensity. It is difficult to compare the three sequencing technologies because they vary greatly according to the instrument model and the library preparation method used. Commonly, the Illumina offers the higher throughput, in the Gb (gigabase pairs - 109 bp) order, than 454 and Ion Torrent, that have similar throughputs, in the order of Mb (megabase pairs - 106 bp; Shokralla et al., 2012; Loman et al., 2012). The higher throughput provided by Illumina comes up against the higher run time, usually > 24 h, and smaller read-lengths (up to 150 bp), than the SNA technologies (< 24 h and > 150 bp; Shokralla et al., 2012; Loman et al., 2012). However, the paired-end sequencing overcomes this major drawback allowing to get longer
read-lengths, up to 2 x 300 bp, using V3 chemistry, with Illumina MiSeq instrument. Besides, it has the lowest error rate among the three (Laehnemann et al., 2016). Altogether, the Illumina sequencing platforms are the preferable choice to large-scale projects such as Ocean Sampling Day (OSD; Kopf et al., 2015) and Earth Microbiome Project (Gilbert et
al., 2014). Therefore, thanks to NGS, the metagenomics field underwent a great
breakthrough. Now, microbial communities can be seen as basic units - superorganisms - delivering specific services assigned to their unique repertoire of genomes - metagenome - fulfilling the proposes of microbial ecology. Thus, beyond answer to “Who is there?”, microbial ecology has now the tools to address a more important question, “What are they doing (potentially)?”, to finally respond to “How they interact with each other and with the surrounding environment to do it?”.
1.3. Bioinformatics Pipelines and Databases
High-throughput DNA sequencing technologies generate large amounts of raw sequence data, or reads, that needs to be processed before being annotated against a non-redundant reference database. Processing reads into comprehensive biological information consists in decreasing the level of complexity from these huge datasets using high performance algorithms integrated in bioinformatics pipelines or workflows (Leipzig, 2017). Usually this requires the following steps, concerning the amplicon NGS data: demultiplex the raw amplicon libraries into samples; filter the reads based on quality parameters; align reads for further quality control; merge identical sequences - aka dereplication; detect and remove artificial sequences with multi parent origin produced during PCR amplification - aka chimeras; cluster unique sequences into operational taxonomic units (OTUs) based on user-defined threshold; assign OTUs to taxonomy using a non-redundant, reference database. Several bioinformatics pipelines have been developed to carry out the outlined steps. Within the most widely used are: mothur (Schloss et al., 2009), Quantitative Insights into Microbial Ecology (QIIME; Caporaso et
al., 2010), and UPARSE (Edgar, 2013). Nonetheless, their utilization is limited by
command-line and programming skills that are unusual among microbiologists. For this reason, emerged user-friendly options as well as automated pipelines in web servers, such as: MetaGenome Rapid Annotation using Subsystem Technology (MG-RAST; Meyer et
the latter being easier to deal with, the user has a standardized outcome and less flexibility and interactivity with their own data. Although, both allow to process amplicon sequencing data with more or less flexibility, they could be quite different in their “philosophical” approach focusing on particular step that they (developers) consider crucial and neglecting completely others. For instance, the team that manage the SILVAngs platform at Bremen does not include a step to identify and remove chimeric sequences because they do not trust in the current algorithms to identify them. However, chimeras could represent about 10% of the sequences in SSU rDNA (small subunit ribosomal DNA) libraries (Ashelford et al., 2006; Schloss et al., 2011; Porazinska et al., 2012) being the most common source of error within reference databases (Hugenholtz and Huber, 2003; Ashelford et al., 2005). By including chimeric sequences in the dataset, the SILVAngs pipeline incorporates those artificial sequences as novel taxa (=OTU) overestimating the sample richness. Meanwhile, highly efficient algorithms such as UCHIME (Edgar et al., 2011) prove their worth identifying 99% (7% of the total dataset) of chimeric sequences within mock communities (a defined combination of DNA from known species that are used to mimic a natural microbial community; Schloss et al., 2011). An OTU was the bioinformatics form found to discriminate a set of sequences that come from individuals of the same species (or other taxonomic level). The user-defined threshold to cluster similar sequences into OTU, at species level, is ≥ 97% (Konstantinidis and Tiedje, 2005; Nguyen et al., 2016). This threshold proved to be higher (Nguyen et
al., 2016), but at the same time the 3% dissimilarity can account for some intra-variability
due to sequencing errors (Schloss and Wescott, 2011) and then considered to be a good threshold. Moreover, the SILVAngs pipeline does not discard the singletons (OTUs with just one sequence) from the taxonomy table provided, which could represent spurious OTUs or rare members of communities, with low coverage (Edgar, 2013; Aanderud et
al., 2015; Nguyen et al., 2015). Nevertheless, the use of centroid-based clustering
algorithms, such as UCLUST, by SILVAngs and QIIME (by default) produces high number of OTUs, that spurious or not, do not represent the true structure and diversity of microbial communities (Edgar, 2013). Still, these greedy algorithms, e.g., UCLUST and CD-HIT, are widely used because they offer the best trade-off between accuracy and speed. This contrast with the robustness of average neighbor algorithm (Schloss and Wescott, 2011), a hierarchical-clustering based algorithm, supported by mothur, which can easily take 10 x more time than using QIIME with UCLUST to process the same kind
of data (Plummer et al., 2015). An alternative is the greedy algorithm developed by Edgar (2013) which has been gained wide acceptance. Despite their greedy nature, it offers a better trade-off between robustness and speed than UCLUST with QIIME (Pylro et al., 2014). Another important consideration is the representative sequence assigned to each OTU that goes to be used for classification. While SILVAngs picks the longest read as representative, QIIME considers the most abundant one. These differences will constraint the assignment at taxonomic level. Therefore, since these studies rely on sequence-based analysis, our ability to assign taxonomy to one OTU is by searching for the most similar sequence, usually through pairwise sequence alignments, within a known reference dataset of sequences whose origin was experimental determined.
Among the highly curated, chimera-free, non-redundant, reference databases of 16S rRNA gene sequences are: Greengenes (DeSantis et al., 2006), SILVA (Quast et al., 2013) and RDP (Ribosomal Database Project; Cole et al., 2014). The most widely used non-redundant, reference database of 16S rRNA gene sequences, SILVA (version 123, released in September 2015), comprises 152 308 bacterial full-length sequences and 3 901 archaeal ones, an order of magnitude higher than RDP (version 14, released in May 2015), for both, Bacteria (10 244) and Archaea (435). While, Greengenes (the latest version, released August 2013) accounts for 202 421 of 16S rDNA sequences for both prokaryotic groups. Regarding the 18S rDNA reference databases, the SILVA (Quast et al., 2013) and PR2 (Protist Ribosomal reference database; Guillou et al., 2013) are among the most widely used. Despite the fact that the PR2 database has 135 110 sequences of 18S rDNA not equally distributed among the several groups of protists, just 29.4% (≈39 722) are complete or almost complete, though 63.7% (≈86 065) hold the V4 hypervariable region (Guillou et al., 2013). Whereas, SILVA database (version 123, released in September 2015) comprises 16 209 eukaryotic sequences with full-length.
The multiple tiny pieces of DNA sequenced from a metagenomics library need to be put together like a puzzle. The reads are aligned in order to get larger consensus segments of contiguous stretches of DNA - contigs (Thomas et al., 2012; Oulas et al., 2015). Contigs could be assembled in order to yield scaffolds (Thomas et al., 2012; Oulas
et al., 2015). Since there is not a reference to align against, the process has to be done by de novo (Thomas et al., 2012; Oulas et al., 2015). The last step in this process is bin and
predict the taxonomy and function, respectively, of scaffolds. Depending on the complexity of the metagenome, the scaffolds could be taxonomically assigned or binned
based on composition, e.g., GC-skew, codon usage, k-mer frequency, or by similarity means (Wooley et al., 2010; Thomas et al., 2012). Finally, BLASTing (perform a Basic Local Alignment Search Tool) the scaffolds against a curated, reference database could be the easiest path to predict the function and, at the same time, depend on the extension of conservation - identity -, the taxonomy (Wooley et al., 2010; Scholz et al., 2012). However, BLAST is computationally intensive which led researchers to deal with friendly options available online in order to get their metagenome annotated. MG-RAST, Integrated Microbial Genomes and Metagenomes (IMG/M; Markowitz et al., 2014) and EBI metagenomics (Mitchell et al., 2016) are currently available workbenches to annotate metagenomics sequencing data providing useful graphics visualization for publication. Some of the more used functional - protein - reference databases are KEGG (Kyoto Encyclopedia of Genes and Genomes; Kanehisa et al., 2016) and COG (Clusters of Orthologous Groups of proteins; Tatusov et al., 2000). Given the amount of raw sequence data that remain to be unassembled it’s always very hard to find open-reading frames and other structural elements in metagenomics sequencing data. Nonetheless, searching for short highly conservative domains in reference databases such as Pfam (Protein family database; Finn et al., 2016) and TIGRFAM (Haft et al., 2003) is a good alternative to overcome this problem and annotate our data.
2. Objectives and Thesis Organization
The thesis presented herein - “Arctic microbiome and N-functions during the winter-spring transition” - makes part of an international collaboration with the Norwegian Polar Institute. The data used in this work was collected during the Norwegian young sea ICE expedition (N-ICE2015) that aimed to assess the ecological impact of changing sea-ice regime in the Arctic Ocean. The goals of this thesis are: (1) to describe, at compositional and structure levels, the Arctic’s microbial communities, prokaryotes and protists, based on SSU rDNA amplicon sequencing data; and (2) identify important players in the nitrogen biogeochemical cycle and related pathways given their importance in this polar environment to primary production, through shotgun environmental metagenomics data. In order to give a comprehensive analysis and address properly both points, they were divided into two chapters: the first chapter - “Pelagic microbial communities from an Arctic drift ice during winter to spring transition north of Svalbard”
- focusing on (1); and a second chapter - “N-cycling microbial communities and pathways in the Arctic Ocean” - aiming at (2). Both chapters include “Background”, “Methods”, “Results and discussion”, and “Conclusions” sections.
1
st
Chapter:
Pelagic Microbial Communities from an Arctic Drift Ice
during Winter to Spring Transition North of Svalbard
1. Background
1.1. Norwegian young sea Ice expedition 2015: motivation
Over the last 30 years, the Arctic summer sea-ice extent and thickness have drastically decreased (Meier et al., 2014; Lindsay and Schweiger, 2015). As a consequence, the ice pack became much younger, and the older and thicker multi-year ice (MYI) that survives summer melt, has largely disappeared and been replaced with first-year ice (FYI; Maslanik et al., 2011; Polyakov et al. 2012; Parkinson and Comiso, 2013). The loss of the thicker (> 2 m) MYI pack intensifies positive feedback mechanisms, like the well-known ice-albedo feedback (Perovich and Richter-Menge, 2009), that leads to an increasing rate of decline of ice cover per decade (Serreze et al., 2007). Arctic’s thinner ice regime has been shaped by both atmospheric and oceanic forcing (Screen and Simmonds, 2010; Polyakov et al., 2012; Polyakov et al., 2017). Successive minimum records of sea-ice extent over the last years lead to the prediction of an Arctic summer completely ice-free at the end of the 21st century (Boé et al., 2009).
The Norwegian young sea Ice expedition 2015 (Granskog et al., 2016) that took place in the ice pack north of Svalbard, between January and June 2015, aimed at studying the new sea-ice regime combining atmospheric with oceanographic and sea-ice sampling.
1.2. Microbial Oceanography: polar oceans
The dark-light transition from polar night to polar day and from ice-covered into open waters impacts microbial metabolism through changes in light and nutrient availability. A metagenomics survey in the Southern Ocean showed a transition in dominance of chemolithoautotrophy towards phototrophy from winter to summer (Grzymski et al., 2012). Bottom-up factors are particularly important in polar oceans controlling the growth and abundance of primary producers and heterotrophic bacteria (Kirchman et al., 2009). At the end of winter light triggers not just the emergence of phytoplankton but also the dormant microbial life that relies on phototrophic metabolism, such as those carrying out anoxygenic photosynthesis and light-driven proton pumps - proteorhodopsins (originally found in one proteobacterium) and bacteriorhodopsin (Halobacteria class, Euryarchaeota; Bryant and Frigaard, 2006). While the remaining component of the microbial planktonic community relies directly on grazing on
phytoplankton or, indirectly, feeding on phytoplankton-derived dissolved organic matter (DOM) and “marine snow”. Although often referred as a vital constraint factor for microbial activity, temperature seems to play a minor role on bacterial growth and production when compared to light and nutrients, especially availability of labile DOM (although this could be correlated with temperature; Rivkin et al., 1996; Deming, 2002; Kirchman et al., 2009). Indeed, microbial activity was recorded at -20 °C in Arctic sea- ice cores (Junge et al., 2004) and in one permafrost microcosm experiment (Tuorto et al., 2014). In addition to a drastic seasonal pattern, all these factors show depth gradients that shape the microbial plankton at taxonomic and functional levels along the water column (DeLong et al., 2006).
1.3. Arctic’s Microbial Communities: diversity and structure
The biogeochemical implications of the changing Arctic sea-ice regime need to be monitored in detail at different trophic levels in order to assess its consequences for primary production and ecosystem sustainability. Microbial communities play a central role when evaluating the ecological impact of the Arctic’s thinner ice regime, as the dietary basis of marine food webs and central players of biogeochemical cycles. With a more dynamic Arctic ice cover (Spreen et al., 2011; Itkin et al., 2017), the probability of lead and pressure ridge formation increases under the new Arctic sea-ice regime (Simmonds and Keay, 2009; Wadhams and Toberg, 2012; Willmes and Heinemann, 2016; Itkin et al., 2017). Leads have been shown as an important source of light to initiate and sustain algal blooms dominated by the haptophyte Phaeocystis pouchetii under snow-covered sea ice (Assmy et al., 2017). Early P. pouchetii spring blooms will deplete the nitrate surface inventory (Harrison and Cota, 1991; Comeau et al., 2011) long before summer with possible negative effects on the magnitude of the diatom spring bloom (Assmy et al., 2017). This trend could be further amplified by the observed long-term decline in silicic acid concentrations, a nutrient diatoms are critically dependent on, in the Norwegian and Barents Seas (Rey, 2012). As a direct consequence, a shift in dominance from diatoms towards P. pouchetii and other small-sized phytoplankton, which are much more competitive under nutrient-limiting conditions, has been noticed in recent years (Li
et al., 2009; Lasternas and Agustí, 2010; Lalande et al., 2013; Nöthig et al., 2015).
assemblages concluded that sea-ice harbours microbial communities distinct from those in the underlying water column; however, comparable at diversity levels (Bowman et al., 2012; Hatam et al., 2014; Hatam et al., 2016). Notably, the low abundance of the Archaea domain which is highly abundant and ecologically relevant in polar surface waters (Brown and Bowman, 2001; Bowman et al., 2012). In addition, a transition from stable MYI to transient FYI bacterial communities is expected (Hatam et al., 2016). Further, an increase in ciliates and a reduction in thaumarchaeotes was observed after the record sea-ice minimum in September 2007 (Comeau et al., 2011).
Nevertheless, the Arctic Ocean is still poorly characterized at a genetic level, especially north of Svalbard (Pedrós-Alió et al., 2015) which is well mirrored by the limited number of recently published works (Metfies et al., 2016; Fernández-Méndez et
al., 2016; Meshram et al., 2017). Metfies et al. (2016) and Meshram et al. (2017) reported
the marine picoeukaryotes: as the main photosynthetic protists, mostly related to
Phaeocystis sp. and Micromonas sp. (mixotrophic); and their distribution closely
associated to water mass circulation, while Fernández-Méndez et al. (2016) found a high richness of the related nitrogen-fixing gene nifH, with few genes belonging to cyanobacteria (that are near absent in this region). Interestingly, a good part of it was affiliated to anaerobic diazotrophs (20%), from cluster III, that seem to thrive through this cold and highly oxygenated waters (Fernández-Méndez et al., 2016). All these studies include seawater samples collected during summertime or close to it (May), north of Svalbard, in the Central Arctic Ocean (including Nansen Basin), when the melting of sea-ice is in an advanced state (at least for the south most stations). Therefore, the winter microbial communities (prokaryotic and protistan) underneath the Arctic ice pack remain overlooked. Also, those works focused on specific compartments of microbial communities based on their ecological role, i.e., photosynthetic picoeukaryotes and diazotrophs, neglecting others, that cannot be dissociated.
1.4. Objectives
The Norwegian young sea Ice expedition 2015 (N-ICE2015) that took place in the ice pack north of Svalbard, between January and June 2015, provides high-throughput sequencing data along depth and from winter to spring seasons that will improve current knowledge about the microbiota of the Arctic Ocean. This chapter intends to describe the
Arctic’s microbial communities, prokaryotes and protists: (1) at compositional and (2) phylogenetic (diversity) levels; and (3) how this diversity is structured during the winter-spring transition in order to get insight about how they are being shaped by the changing sea-ice regime.
2. Methods
2.1. Sampling Sites
During the N-ICE2015 expedition, drifting ice camps in the southern Nansen Basin of the Arctic Ocean were established using RV Lance as a research platform and comprehensive data sets of the atmosphere-snow-ice-ocean system were obtained (Granskog et al., 2016). This study uses data collected during the expedition and described in detail in other papers and datasets (Assmy et al., 2016; Peterson et al., 2017; Meyer et al., 2017).
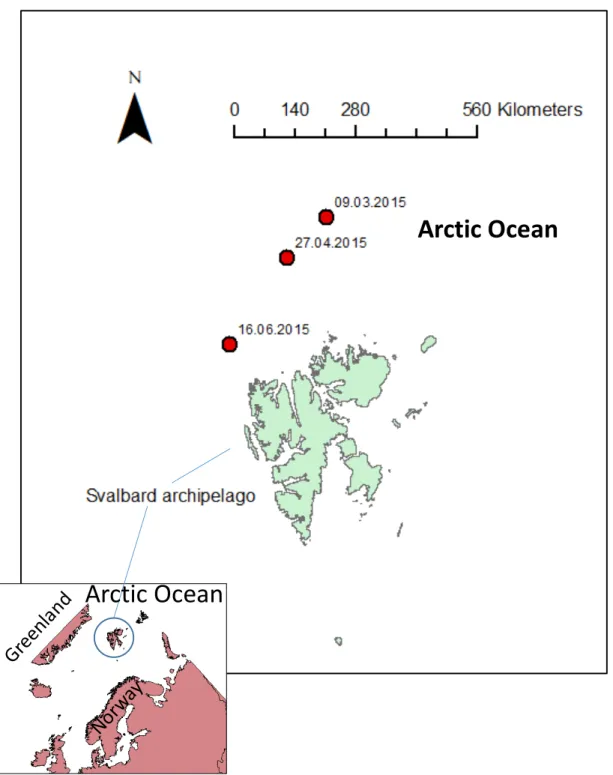
Three microbial sample sets (n=9) were collected along the floe 2, 3 and 4 drifts illustrated in Granskog et al. (2016), from winter (snow-covered sea ice) towards summer (sea-ice without snow). These three sampling sites are highlighted in Figure 1 and were chosen to collect seawater, at three distinct depths; hereafter designated as surface (5 m), middle (20 or 50 m) and bottom (250 m) samples. The north most site sampled is in the deep Nansen Basin (NB, Eurasian Basin) and the south most is in the shallow Yermak Plateau (YP). Between both sites, a sample was obtained in the marginal zone of YP, deeper than YP, but shallower than NB, and hereafter referred as Transition Region (TR). This area is involved by two arms (the Yermak and Svalbard Branches) of warmer and saltier Atlantic water that inflows through the Fram Strait towards the Arctic Ocean surrounding completely the Plateau (Meyer et al., 2017). The advection of relatively warm Atlantic water masses has a profound effect on the Eastern European Arctic including the Svalbard Archipelago (Polyakov et al., 2017). This advection of heat has a pronounced effect on the highly-stratified Arctic colder polar surface waters, resulting mostly in three distinct water masses, regarding temperature and salt properties, as characterized in Meyer et al. (2017): a layer of colder and less saline polar surface water (PSW); an intermediate layer of Atlantic water that suffers great influence of cooler polar waters presenting a sharp gradient of salt - halocline - (MAW, Modified Atlantic Water); lastly, a deeper layer of Atlantic water (AW). Additionally, the melting ice influence the
formation of warm Polar Surface Waters (PSWw) over the YP during springtime (Meyer
et al., 2017).
Figure 1 - Map highlighting the sampling sites (red dots) north of Svalbard. Samples collected during the N-ICE2015 cruise from the surface (S), middle (M) and bottom (B) at Nansen Basin (NB, 09.03.2015), Transition Region (TR, 27.04.2015) and Yermak Plateau (YP, 16.06.2015; see Table 1).
Arctic Ocean
2.2. Water Column Sampling: environmental data and microbial collection
Details about the equipment used for physical, chemical and biological water samples during N-ICE2015 are given in Meyer et al. (2017). This included a vessel-mounted CTD and a CTD operated through a hole made in the ice, both attached to a multi-bottle carousel water sampler holding. The former CTD included several sensors to measure, apart from salinity and temperature, fluorescence, chlorophyll and photosynthetically active radiation (PAR). Moreover, Ice-Atmosphere-Arctic Ocean Observing System (IAOOS) profilers equipped with a CTD and microstructure profilers with temperature, conductivity and depth sensors were also employed. Water samples collected during CTD deployments were used to measure a large number of variables including concentrations of oxygen, ammonium (NH4+), nitrite (NO2-) plus nitrate (NO3 -), phosphate (PO43-), silicate (SiO44-), total dissolved nitrogen (TDN), particulate organic nitrogen (PON), dissolved organic carbon (DOC), particulate organic carbon (POC) and phaeopigments.
Water column physical and biogeochemical data mentioned in the previous paragraph and used here to describe the environmental context from where the microbial communities were collected are described and available in Peterson et al. (2016) and Assmy et al. (2016), respectively.
All the measurements made regarding the physical and biogeochemical data contextualizing the environment of microbial N-ICE2015 collection are given in Additional file 1: Table S1.
In order to get a reproducible, reliable and compatible results, we adopted the scheme from the Ocean Sampling Day (OSD) campaign, from sampling to sequencing the small subunit of ribosomal DNA (SSU rDNA) of microbial communities (Kopf et al., 2015). The seawater was collected using a GoFlow bottle (20 L) and then filtered through a Sterivex® Filter with a 0.22 µm pore size, hydrophilic, PVDF, Durapore membrane (SVGV010RS, Merck Millipore, Portugal) with the help of a peristaltic pump. The filters were sealed and stored at -80 °C until further analysis. See sample IDs attributed to each sample and description summarized below in Table 1.
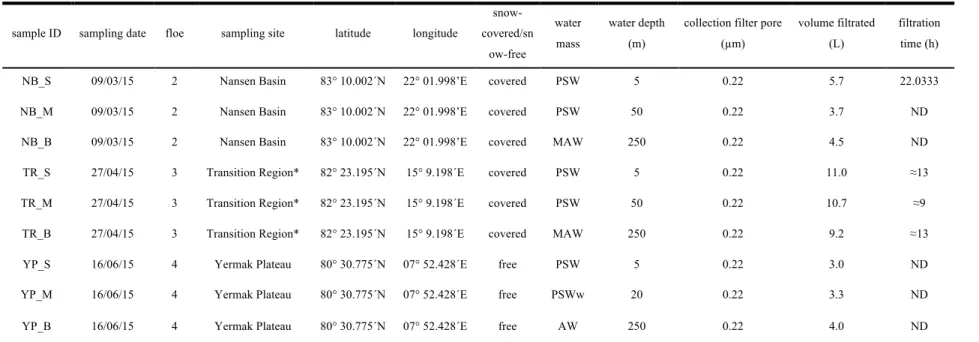
Table 1 - Features of sampling conditions of microbial N-ICE2015 collection
sample ID sampling date floe sampling site latitude longitude
snow-covered/sn ow-free water mass water depth (m)
collection filter pore (µm)
volume filtrated (L)
filtration time (h)
NB_S 09/03/15 2 Nansen Basin 83° 10.002´N 22° 01.998’E covered PSW 5 0.22 5.7 22.0333
NB_M 09/03/15 2 Nansen Basin 83° 10.002´N 22° 01.998’E covered PSW 50 0.22 3.7 ND
NB_B 09/03/15 2 Nansen Basin 83° 10.002´N 22° 01.998’E covered MAW 250 0.22 4.5 ND
TR_S 27/04/15 3 Transition Region* 82° 23.195´N 15° 9.198´E covered PSW 5 0.22 11.0 ≈13 TR_M 27/04/15 3 Transition Region* 82° 23.195´N 15° 9.198´E covered PSW 50 0.22 10.7 ≈9 TR_B 27/04/15 3 Transition Region* 82° 23.195´N 15° 9.198´E covered MAW 250 0.22 9.2 ≈13
YP_S 16/06/15 4 Yermak Plateau 80° 30.775´N 07° 52.428´E free PSW 5 0.22 3.0 ND
YP_M 16/06/15 4 Yermak Plateau 80° 30.775´N 07° 52.428´E free PSWw 20 0.22 3.3 ND
YP_B 16/06/15 4 Yermak Plateau 80° 30.775´N 07° 52.428´E free AW 250 0.22 4.0 ND
*Transition Region between the Eurasian Basin and Yermak Plateau. ND - Not Determined. PSW: Polar Surface Water; MAW; Modified Atlantic Water; PSWw: warm Polar Surface Water; AW: Atlantic Water (see description in “Methods”).
2.3. DNA Extraction, PCR, Library Preparation, and Sequencing of SSU rDNA amplicon
SterivexTM filters were thawed, at room temperature, and the plastic mold that surrounds the filter was cut off to remove the filter itself. Then, DNA extraction was proceeded using the PowerWater® DNA Isolation Kit protocol (MO BIO Laboratories, Inc., Portugal) following the manufacturer’s instructions.
The 16S rRNA gene was amplified with the primer pair 515YF (5’ -
GTGYCAGCMGCCGCGGTAA - 3’) and Y906R-jed (5’
-CCGYCAATTYMTTTRAGTTT - 3’), which was designed initially by Caporaso et al. (2011; 2012) and latter modified by Apprill et al. (2015) and Parada et al. (2016). The primer set has as the target the V4-V5 hypervariable regions of 16S rRNA gene. Both primers (515YF/Y906R-jed) have a degeneracy to cover a broad spectrum of diversity, specifically the Crenarchaeota/Thaumarchaeota (degeneracy at 515YF) phylum and the marine and freshwater clade SAR11 (alphaproteobacterial class; degeneracy at Y906R-jed; Apprill et al., 2015; Parada et al., 2016). The 18S rRNA gene was amplified with the primer set described in Stoeck et al. (2010), TAReuk454FWD1 (5’ – CCAGCASCYGCGGTAATTCC – 3’) and TAReukREV3_modified (5’ – ACTTTCGTTCTTGATYRATGA – 3’), with the exception of reverse primer (TAReukREV3_modified) which had an additional TGA triplet added at 3’ end compared to the original introduced by Piredda et al. (2017). This primer set amplify the V4 region of 18S rRNA gene.
Both SSU rRNA genes independently amplified by PCR were used to build Illumina paired-end libraries sequenced on an Illumina MiSeq platform using V3 Chemistry (Illumina). These steps were performed by LGC Genomics (LGC Genomics GmbH, Berlin, Germany) company and a detailed description is given in Ribeiro et al. (2017, submitted).
2.4. Bioinformatics Pipeline: SSU rDNA amplicon 2.4.1. Upstream Sequence Analysis: raw OTU table
The mothur pipeline was used to preprocess and assign taxonomy independently for each SSU (small subunit) rDNA library, i.e., 16S and 18S rDNA datasets, from the N-ICE2015 campaign following the MiSeq Standard Operating Procedure (SOP;
https://www.mothur.org; Kozich et al., 2013). Individually, the forward and reverse reads of each library were joined from raw Illumina fastq files (mothur v. 1.39.5; Schloss et al., 2009). Merged reads with ambiguities (aka N) and out of the 360-380 bp and 365-385 bp range, for the 16S and 18S rDNA amplicon datasets, respectively, were excluded. The remaining sequences were dereplicated (based on 100% similarity) and aligned against the SILVA database (v. 1.2.8; Quast et al., 2013) to screen the SSU rRNA gene region targeted in our study. Those that didn’t align were excluded as well as the ones with homopolymers (n>8). After undergone a dereplication step, the unique sequences that differ within 3 base pairs similarity from a more abundant one were clustered together. Chimeric sequences were identified de novo and removed with UCHIME (Edgar et al., 2011). Then, the unique reads were assigned against SILVA (v. 1.2.8) using the RDP naïve Bayesian Classifier (Wang et al., 2007). Undesirable lineages, “Chloroplast”, “Mitochondria”, “unknown”, “Eukaryota” were removed from the 16S dataset; while “Vertebrata”, “Annelida”, “Arthropoda”, “Cnidaria”, “Ctenophora”, “Echinodermata”, “Florideophycidae”, “Mollusca”, “Pav3”, “D226”, “FV18-2D11”, “Tunicata” were excluded from 18S. Afterward, a distance matrix was built and the sequences clustered into OTUs (Operational Taxonomic Units) using 0.03 and 0.02 cutoff values for the 16S and 18S rDNA amplicon datasets, respectively, with OptiClust (Westcott and Schloss, 2017). Finally, the 16S and 18S rDNA amplicon-based OTU tables were built.
2.4.2. Downstream Sequence Analysis: composition
In order to fully exploit the downstream analysis, the OTU tables (one for each SSU rDNA library) produced through mothur pipeline were converted into biom format (mothur v. 1.39.5). The OTU tables in biom format were imported to QIIME (v. MacQIIME 1.9.1; Caporaso et al., 2010) to exclude rare OTUs (<5 observations across samples) and rarefy at even sampling depth (to the sample with the lowest number of reads), 38 232 and 43 289 reads for 16S and 18S rDNA amplicon-based OTU tables, respectively. The number of sequences filtered during each upstream step for the 16S and 18S rDNA amplicon datasets are summarized in Additional file 1: Tables S2 and S3, respectively. While, the distribution of prokaryotic taxa across N-ICE2015 collection at phylum, class, order, family, genus and OTU levels is provided in Additional file 2; the raw prokaryotic OTU table (without excluding any taxa, rare OTUs neither rarefying) in
Additional file 3; and, the distribution of eukaryotic taxa at different taxonomic ranks in Additional file 4. To clarify, all analysis described below and presented as figures in the text were conducted in duplicate for the 16S and 18S rDNA datasets based on information retrieved from Additional files 2 and 4, respectively.
2.4.3. Downstream Sequence Analysis: diversity and structure
A multiple sequence alignment with representative sequences of each OTU through 1 000 iterations was performed using MAFFT (v. 7.310; Katoh and Standley, 2013) to build a maximum likelihood tree under the GTRGAMMA model with 1 000 bootstrap replicates using RAxML (pthreads v. 8.0.26; Stamatakis, 2014). The OTU table and tree constructed were used to perform alpha (within samples) and beta (between samples) diversity metrics (using QIIME). Faith's Phylogenetic Diversity (Faith, 1992) was the alpha metrics estimated. While for beta-diversity the unweighted UniFrac metrics was estimated (Lozupone et al., 2005; Lozupone et al., 2007) subsampling the 16S and 18S datasets at 38 232 and 43 289 sequences, respectively, to produce a distance matrix that was visualized through the Principal Coordinate Analysis method (PCoA). Finally, heatmaps and Spearman correlations were generated using Hmisc, corrplot and ggplot2 packages in R (R Development Core Team, 2010; Wickham, 2009; Wei, 2013; Harrell and Harrell, 2015).
2.4.4. Taxonomic Assignment of 18S rDNA Amplicon Libraries: Protist Ribosomal Reference database
In order to improve the taxonomic assignment of 18S rDNA amplicon libraries classified against the SILVA database, the 18S rDNA amplicon dataset was additionally assigned against the Protist Ribosomal Reference database (PR2, v. 4.5; Guillou et al., 2013). Therefore, the 18S rDNA amplicon libraries were processed following the same steps aforementioned, with a few exceptions concerning the mothur MiSeq SOP pipeline. The alignment quality step was skipped because the PR2 database is not aligned, and the sequences clustered using the VSEARCH algorithm (Rognes et al., 2016). Since the PR2 taxonomy is distinct of the SILVA database for some taxa; in addition to the lineages removed above, “Metazoa” was also removed. The rare clusters were excluded (<5
observations across samples) and rarefied at even sampling depth (43 647 sequences). The OTU table with taxonomy is presented in Additional file 5.
2.5. Availability of Sequencing Data
Raw Illumina fastq files, concerning the SSU rDNA amplicon data used in this study, were deposited in the European Nucleotide Archive (ENA) under the project accession number PRJEB21950.
3. Results and discussion
In the following paragraphs, results related with the abundant prokaryotic marine plankton (16S libraries) will be presented and discussed with greater detail than those related with the eukaryotic plankton (18S libraries). Despite the great effort to improve current metabarcoding protocols to reproduce eukaryotic diversity, the poor representation of many eukaryotic species in existing data bases and the lack of discrimination power from a unique universal marker remains a significant hurdle to uncover their true diversity (Stoeck et al., 2010). Thus, in this case the results and discussion will focus on phylogenetic diversity and assignment at order/family level, where there is greater confidence. Also, those groups that fit into 0.2-3.0 µm range (picoeukaryotes) and that are not possible to classify through traditional taxonomic standards will also be discussed.
3.1. Metabarcoding the Arctic microbiota through the Winter-Spring Transition: prokaryotic and protistan communities
The prokaryotic marine plankton collected during the N-ICE2015 expedition, north of Svalbard, possesses a repertoire of 24 phyla (Additional file 2). The majority of them (15) represents < 1% of the sequence reads across the entire N-ICE2015 dataset (Woesearchaeota (DHVEG-6), Acidobacteria, unclassified Bacteria, Chloroflexi,
Cyanobacteria, Deinococcus-Thermus, Firmicutes, Gemmatimonadetes,
Gracilibacteria, Lentisphaerae, PAUC34f, SBR1093, Spirochaetae, TM6, Tenericutes).
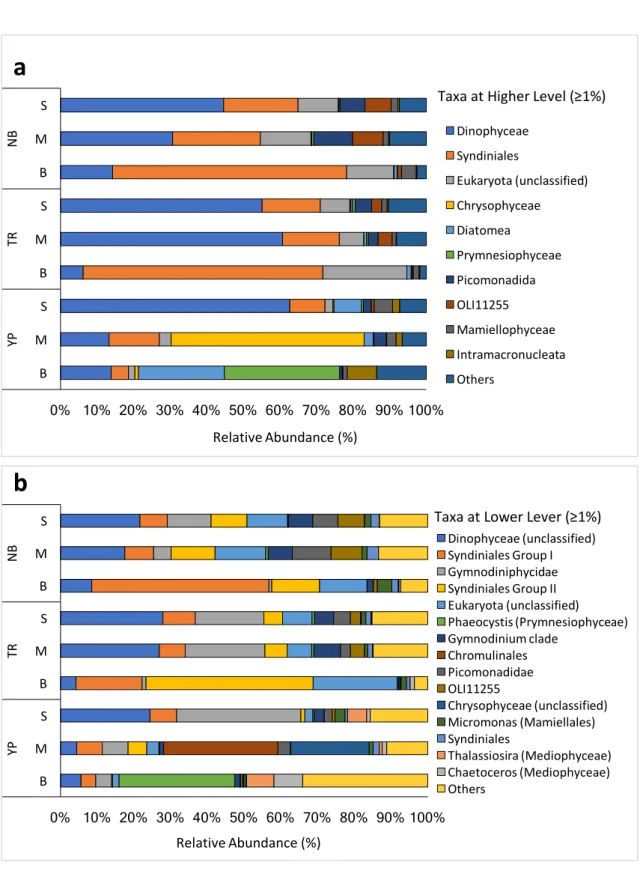
abundance in the entire dataset) and Bacteroidetes (14.1%) beyond the archaeal phylum
Thaumarchaeota (10.4%) (Additional file 2 and Figure 2a). Proteobacteria dominates
the majority (i.e., > 50%) of the Arctic’s prokaryotic libraries, with the exception of the mesopelagic sample from the Yermak Plateau, which is dominated by bacteroidetes (57.1%, comprises mostly Flavobacteriales; Figure 2a).
3.1.1. The Dominant Proteobacteria and its Co-occurrence Patterns with Eukaryotes
Contributing with almost equal parts to the high abundance of Proteobacteria are the Alpha- (30.6% in the prokaryotic N-ICE2015 dataset) and Gammaproteobacteria (28.6%) classes, which is in agreement with previous studies (Figure 2a; Kirchman et al., 2010; Galand et al., 2010; Comeau et al., 2011; Ladau et al., 2013). These two classes are not just the most abundant across the prokaryotic N-ICE2015 collection but also the most phylogenetically diverse (i.e., higher number of phylotypes assigned to both classes than any other phylum or class). Alphaproteobacteria is mainly composed by one ribotype affiliated to “Candidatus Pelagibacter” from SAR11 clade (Figure 2b). SAR11 clade is the most abundant phylotype in the surface of the oceans representing up to one-third of the bacterioplankton (Morris et al., 2002). In the N-ICE2015 dataset SAR11 represents on average ≈30.7% of the epipelagic communities sampled and ≈9.2% of the mesopelagic ones. Previous NGS-based studies (Kirchman et al., 2010; Comeau et al., 2011) reported a representativeness of this group on Arctic surface waters of ≈15% on average. The difference to the results presented herein could be attributable to the primers used in our study that were designed to efficiently catch the diversity of marine and freshwater alphaproteobacteria from SAR11 clade (see “Methods” section; Apprill et al., 2015; Parada et al., 2016). Nevertheless, we cannot rule out the possibility that the differences observed merely reflect the different composition across distinct biogeographical regions of the Arctic Ocean, since the studies outlined before (Kirchman
et al., 2010; Comeau et al., 2011) were conducted in the western Arctic Ocean, while the
Figure 2 - Taxonomic profile of prokaryotic N-ICE2015 collection. N-ICE2015 collection possess bacterial and archaeal sequences retrieved from the surface (S), middle (M) and bottom (B) seawater at Nansen Basin (NB), Transition Region (TR) and Yermak Plateau (YP) (see Table 1). a Distribution of the abundant taxa (≥ 1%) at higher taxonomic level, phylum (Thaumarchaeota, Nitrospinae, Actinobacteria,
Verrucomicrobia, Marinomicrobia (SAR406 clade), Planctomycetes, Euryarchaeota), class (Alpha-, Gamma-, Deltaproteobacteria), and order (Flavobacteriales). b Distribution of the top 10 OTUs
(Operational Taxonomic Units) assigned at genus level; ZD0405, SAR324, SAR11 and SAR92 clades 0% 10% 20% 30% 40% 50% 60% 70% 80% 90% 100% S M B S M B S M B NB TR YP Relative Abundance (%)