DO CREDIT RATING NOTATIONS AFFECT U.S.
COMMERCIAL BANKS’ LEVERAGE LEVELS?
NEW FINDINGS ON THE EFFECTS OF THE FINANCIAL
CRISIS
Helena Pereira Alvarenga
Master Dissertation in Finance
Advisor:
Mohamed Azzim, ISCTE Business School, Phd
Abstract
This paper analyses the link between U.S. commercial banks leverage (both market leverage and book leverage) and their credit rating changes by extending previous results from corporate firms to banks. We found evidence that the credit rating notation variable also explains leverage levels fluctuations in the banking sector as it does for the corporate sector. The results obtained demonstrate that U.S. commercial banks reduce their leverage following credit rating downgrades and augment it after upgrades. These adjustments of the leverage levels have higher statistical significance when we test them for the financial crisis period, where the credit rating variable significance increases. Moreover, we show that the speed of adjustment for U.S. commercial banks is faster during the crisis turmoil period (2008 to 2011) rather than in normal economic conditions (2004 to 2007), and also that the adjustment speed increased by 50% after the crisis (from 40% to 61%) and is statistically significant. As far as we acknowledge, these results are new findings that could open up new avenues of research for this literature, either with banks or corporate firms.
Keywords: Banking Industry, Banking Leverage, Credit Ratings, Financial Crisis JEL Classification: C13, G21, G01
Resumo
Este trabalho analisa a relação entre o grau de alavancagem de bancos comerciais dos E.U.A. (tanto o grau de alavancagem com valores de mercado como o grau de alavancagem com valores contabilísticos) e as alterações ao nível da notação de risco (credit rating) expandido estudos anteriores relativos a empresas para bancos. Com este estudo, encontrámos evidência de que a variável notação de risco de crédito explica parte das variações do nível de alavancagem no setor bancário, à semelhança da evidência empírica para o setor não financeiro. Os resultados obtidos demonstram que os bancos comerciais dos E.U.A. reduzem o seu grau de alavancagem após uma redução da sua notação de risco de crédito e aumentam o seu grau de alavancagem após uma melhoria da sua notação de risco de crédito. Estes ajustamentos do grau de alavancagem revelam uma elevada significância estatística quando testados para o período da crise financeira, com um aumento da significância da variável de notação de risco de crédito. Adicionalmente, mostramos que a velocidade de ajustamento dos bancos comerciais dos E.U.A. é mais rápida durante o período de maior agitação da crise financeira (2008 a 2011) do que durante o período de condições económicas expansionistas (2004 a 2007), e ainda mostramos que a velocidade do ajustamento aumenta em 50% após a crise (de 40% para 61%), sendo estatisticamente significativa. De acordo com o nosso conhecimento, estes resultados são uma evidência que pode conduzir a estudos futuros nesta literatura, tanto para bancos como para empresas não financeiras.
Palavras-chave: Setor bancário, Grau de Alavancagem de Bancos, Notações de Risco de
Crédito, Crise Financeira
Acknowledgements
This work was possible due to the motivation, enthusiasm and support of the people that surrounds me, so I would like to dedicate this achievement to them.
Firstly, to all my family, especially to my husband Miguel, my daughter Madalena and my parents whose support, caring and motivation were essential to be possible to develop this work.
Secondly, to my team colleagues at work, in particular to my good friend Pedro Santos, who contributed with his knowledge as financial analyst and motivation to advance with this study.
Thirdly, I would like to give a special greeting to my friend Ricardo Correia, who contributed with his knowledge and support in a critical phase of this work.
Also, to my mentor and advisor Professor Mohamed Azzim, who guided me and always gave me motivation to never give up despite of the difficulties faced during the work.
Finally, to my company, Caixa Gestão de Activos, that supported me in my efforts related with the Master and provided me conditions to take the best opportunities from the course.
Contents
1. Introduction ... 1
2. Literature Review ... 4
3. Empirical Design... 15
4. Model and Data ... 17
4.1 Model ... 17
4.2 Data ... 18
5. Results ... 21
5.1 Descriptive Statistics ... 21
5.2 Corporate Finance Style Regressions ... 23
5.3 Regression Analysis Before and After the Financial Crisis ... 26
5.4 Bank Fixed Effects and the Speed of Adjustment ... 27
6. Limitations and Further Research ... 28
7. Conclusions ... 29
References ... 31
Appendix I. Summary of Recent Papers on Capital Structure Determinants ... 35
Appendix II. Brief Regulatory Frameworks Appointment on Capital and Leverage Ratios ..36
Appendix III. Monetary Policy Effects Regarding U.S. Banks ... 38
Appendix IV: Definition of Variables ... 39
List of Tables
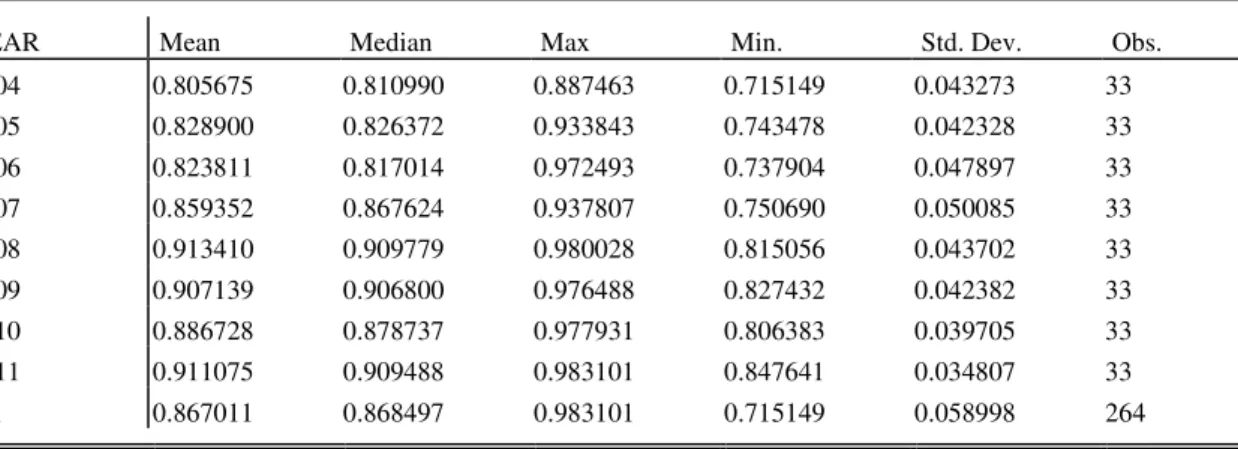
Table 1 - Descriptive Statistics (market leverage) ... 40
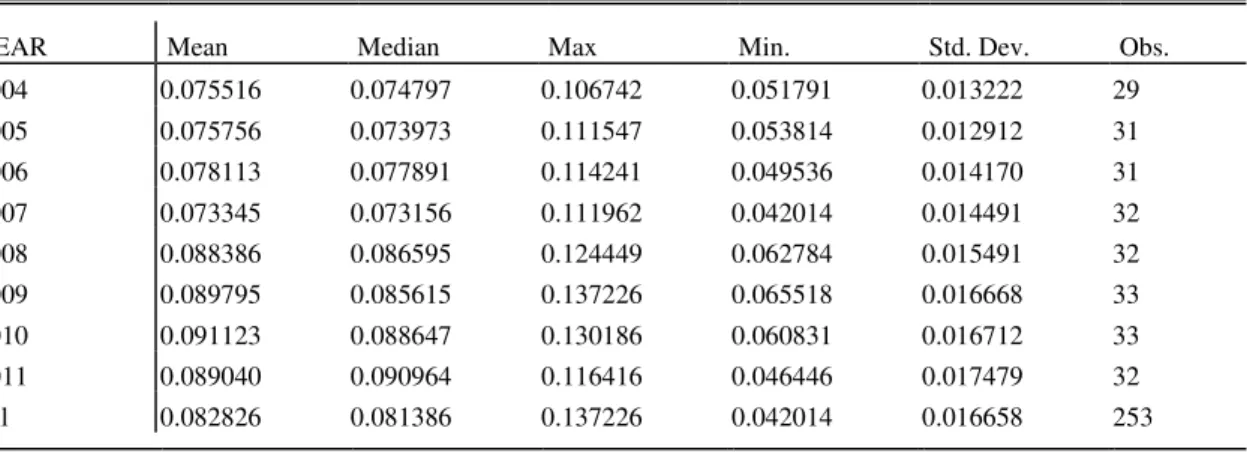
Table 2 - Descriptive Statistics (book leverage) ... 40
Table 3 - Descriptive Statistics (regulatory leverage) ... 41
Table 4 - Descriptive Statistics ... 41
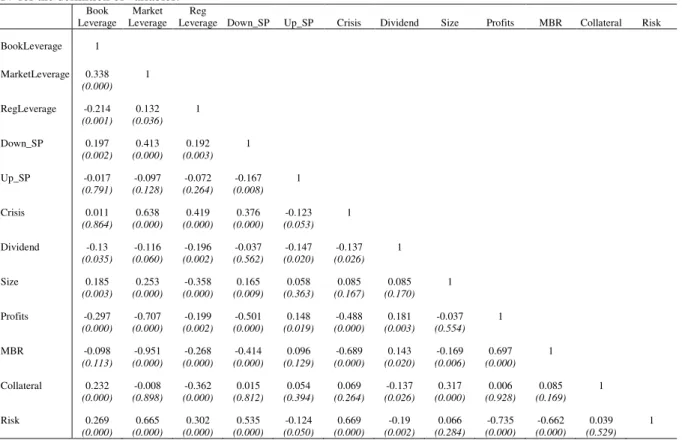
Table 5 - Correlation Matrix ... 42
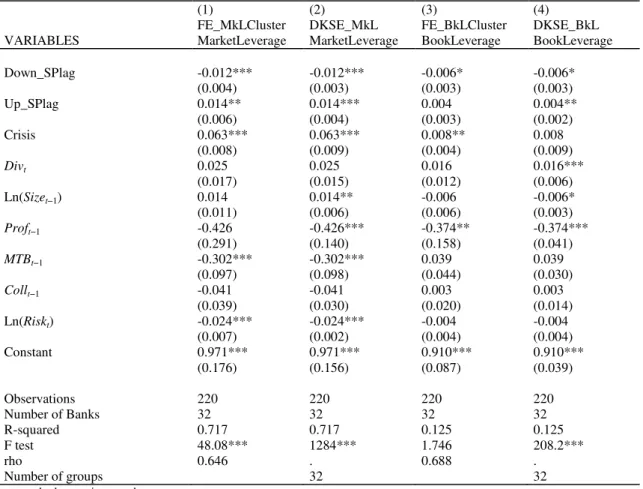
Table 6 - Final Results... 43
Table 7 - Final Regressions Before and After the Crisis ... 44
Table 8 - Bank Fixed Effects and the Speed of Adjustment ... 45
Table 9 - Bank Fixed Effects and the Speed of Adjustment Before and After the Crisis .... 46
Table 10 - Market Leverage Before and After the Crisis ... 47
Table 11 - Book Leverage Before and After the Crisis ... 47
Table 12 - Regulatory Leverage Before and After the Crisis... 48
Table 13 - Descriptive Statistics Before the Crisis (2004-2007) ... 49
List of Figures
Figure 1. Sample Leverage Ratio Evolution (%) (2004 to 2011) ... 13
Figure 2. Histogram of Market Leverage ... 19
Figure 3. Histogram of Book Leverage ... 19
Figure 4. Histogram of Regulatory Leverage ... 20
Figure 5. S&P Banks Sub-index (capitalization-weighted) ($bn) (2004-2011) ... 24
Figure 6. Mean of Market Leverage (+/- 1 standard deviation) (2004-2011) ... 47
Figure 7. Mean of Book Leverage (+/- 1 standard deviation) (2004-2011) ... 48
Executive Summary
The banking industry was hit by a severe financial crisis in the 2008–2011 period that revealed several weaknesses in the sector, in particular an excessive leverage due to a deficit of capital. Commercial banks struggled to cope with regulatory leverage levels, which ultimately could jeopardize the banks credit ratings.
Several studies have been conducted to analyze the link between leverage levels and credit ratings in the corporate sector, and the paper takes the approach of Kisgen (2009) and extends it to the banking industry to assess the relationship between leverage and ratings in the banking industry. Furthermore, the paper was also based on the approach of Gropp and Heider (2010) in order to test how their work on banks’ leverage would still be comparable with a more challenging environment, like the last financial crisis, with the introduction of a new, but extremely relevant, variable: credit rating notation of the bank. The regulatory evolution in the banking industry also affects banks leverage levels and thus the paper includes references to the major global developments regarding banks leverage, with new bank regulators establishing minimum leverage level that banks must comply with.
The paper explores whether rating notations are a relevant factor to explain leverage levels of U.S. commercial banks, and also analysis thoroughly whether the financial crisis has had any consequences on banking leverage levels. The sample used in the paper includes all U.S. commercial banks with total assets over 10 billion USD and the model implemented assesses both the pre-crisis period (2004 to 2007) and the post-crisis period (2008 to 2011).
The model used considers the following factors:
- Adaption of previous studies about the corporate sector relation between debt and leverage to the banking sector and use of leverage as a function of the most relevant variables from other studies applied to corporate sector leverage determinants, using corporate finance style regressions
- Comparison of different leverage variables: market leverage and book leverage, the independent variables
- Significance of credit rating analysis
- Bank fixed effects and adjustment speed to target leverage ratios analysis - Regression analysis before and after the financial crisis
The results achieved with the model show that the link between leverage levels and credit ratings in the corporate sector that was observed in previous research also occurs in the banking sector. The adjustment to the leverage target that is tested in the paper for U.S. commercial banks achieves similar results to those obtained for the corporate sector. We obtain an adjustment speed of roughly 48%, in line with previous literature (Flannery and Rangan (2006)) for the whole period, which represents an increase in the second half period (post-crisis) to 61%, from 40% from the pre-crisis period. It was found evidence that the rating component proves to support leverage levels, especially when the rating agency action is a downgrade.
Regarding the effect of the financial crisis in banks leverage levels, the tests conducted also show evidence that banks were more prone to strengthen their leverage in the post-crisis period.
Throughout this paper is possible to conclude that despite the difference between the corporate sector and the banking sector in terms of business model, economic importance and systemic importance, there are some similarities in terms of the link between leverage levels and credit ratings. These findings are supported by previous research for the corporate sector, which were the ground base and starting point for the paper, and by the analysis conducted in the paper for the banking sector.
1. Introduction
The use of leverage has always been a tool for firms and individuals to multiply gains as it is possible to borrow money that will be applied in investments with a higher return than the cost of that money and generate returns that would not be possible to achieve if only equity was invested. However, there is a limit to the use of leverage as the higher the leverage level is, the more likely it is that the borrower will face troubles to fulfill its obligations. Due to the financial intermediary nature of their business, banks are not only among the most leveraged institutions, but also among the most regulated ones.
The consequences of the last financial crisis (hereafter crisis), which had as one of the most visible causes the high leverage level of banks, i.e. a deficit of equity to cover assets, are still being evaluated as its repercussions constrain the way banks conduct their business. With the Lehman Brothers’ bankruptcy as an historic mark, the crisis’ features and, particularly, the leverage factor of banks, remains an interesting field of study.
The high leverage levels of banks has been pointed as one of the main contributors that led to the crisis and thus our work will focus on banks’ leverage levels and will try to evaluate what has changed since. Essentially, our analysis aims to assess leverage on banks during and after the crisis period in order to confirm its developments and to verify what kind of changes are already being observed in the sector, confining the scope of our analysis to commercial banks of the United States of America.
Another interesting topic we set to study is rating notations and its relevance for the banking industry. Since the Basel Committee on Banking Supervision (2001) proposal to incorporate ratings as a way to define risk exposures, most banking supervisors rely in rating notations for the majority of their capital evaluations.
The first capital framework, the 1988 Basel I Accord, was a generic set of capital requirements recommendations for financial institutions worldwide, in which only credit risk was assessed. This first accord assigned a level of capital (“risk weights”) based on the nature of the assets, ranging from 0% for the assets deemed “safest” to 100% for the assets considered “riskier”. The second capital framework, the Basel II Accord that was introduced between 2004 and 2009, revised how risk weighted assets (RWAs) are computed and
broadened the risks under coverage. Regulatory capital requirements were expanded to consider three major components of risk that a bank may face: i) credit risk, ii) market risk and, a new risk, iii) operational risk. Hence, Basel II assigns risk weights based on the quality of assets, as measured either by external ratings provided by external credit rating agencies (CRAs) and by the supervision regulator, or by internal ratings calculated by the banks based on their own internal models. As a result, rating notations affect the capital structure and the leverage levels of banks.
The motivation for our work is to understand the relationships among these themes: financial sector crisis, banks’ leverage and banks’ credit ratings notations, and we will analyze part of this dynamic throughout our paper. In order to comprehend these relationships we will address the following questions in the paper: Are rating notations a relevant factor to explain leverage on banks, in our case U.S. commercial banks? Is the financial crisis already producing results? By other words, are we already witnessing any consequences on banking leverage levels after the crisis?
Previous literature is quite rich in exploring the leverage theme for the corporate sector and several theories have been developed to explain leverage decisions, such as the trade-off theory, the pecking order theory and the market timing theory. Some authors also tried to relate capital structure with some financial, economic or regulatory variables like Harris and Raviv (1991) or Frank and Goyal (2004), more recently. Flannery and Rangan (2006) developed the trade-off theory by stating that the adjustment speed that a firm takes to converge to its leverage target depends on adjustment costs. Others authors focused on particular issues related with leverage financial markets constraints for firms, like Faulkender and Peterson (2006) who affirm that their relative ability/credit quality to access markets may constrain their leverage level. Even the economic environment or the cultural line may influence the leverage level, like Antoniou, Guney and Paudyal (2008) have emphasized by studying how the effects of a market based or a financial based economic environment may influence corporate firms’ leverage.
However, the vast majority of research conducted to study leverage and its dynamics had been done excluding the banking sector. This is also related to the fact that the banking sector is subject to specific regulation, which could be a factor of distortion.
Despite some difficulties to analyze the banking sector due to its distinct business model and the regulatory constraints that influence the sector, several studies have been produced comparing corporate leverage to financial leverage. Barber and Lyon (1997) complemented Fama and French (1992) work to explain returns on corporate sector by extending their model results also to financial firms. Recently, Gropp and Heider (2010) produced a detailed work comparing cross-sectional variables from their previous work done in the corporate sector to explain leverage levels and apply it to the banking sector. They also reported that regulation is a second order factor to determine banks capital structure.
Our analysis intents to assess the relation between leverage and rating notations in the banking sector and evaluate banks leverage levels dynamics due to the crisis. We take previous work already done for corporates and banks in modeling leverage and complement it by adding the rating variable. We take Heider and Gropp’s (2010) work on leverage for banks and test if their conclusions would still apply in a more challenging environment for banks, like the one experienced during the last crisis, but adding this relevant panel data variable: changes in credit rating of the bank. This new factor is particularly relevant since the last crisis showed some credit rating mistrust from investors related with the sub-prime crisis and complex financial products. Therefore, with our work we intend to strengthen the previous works comparing the leverage levels panel data variable from corporates to financials by adding the rating notation variable during the most challenging period: from 2004 to 2011.
Furthermore, we extend Kisgen’s (2009) work relating ratings levels to corporate leverage and apply it to banks, only to U.S. commercial banks in order to avoid regulation differences, and to a specific time period to limit some regulation effects. We conclude for the relevance of this variable in also explaining leverage for banks. As the rating notation is a factor that affects banks´ reputation and thus determines their funding costs and business model characteristics, is consequently a pressure factor for banks’ leverage levels and their leverage target. Taking into account the works of Kisgen (2009) and Flannery and Rangan (2006) related to the adjustment speed to a leverage target, we also found that during this period the banks accelerated their adjustment to the leverage target after the crisis, from 2008 to 2011, which goes in favor of the huge need for deleverage from banks due to investor and regulatory pressures. We limit our analysis to a short time period, 2004 to 2011, with the purpose of understanding the banks dynamics on the leverage, particularly during the turmoil period, and to verify if this feature (i.e. leverage levels) has been flexible to changes. We
conclude that leverage has changed during the analysis timeframe. Those are important achievements since one of the main characteristics of this financial crisis was excessive leverage or inadequate leverage.
Also on ratings notations, we test for ratings effect during and after the crisis and perceived that this variable is quite relevant to explain leverage. This relevance loses some strength after the crisis burst (2008 to 2011), but is still relevant and statistically significant, which is why it is interesting to evaluate the high reliance investors still have on ratings notations. In fact, and despite the possibility of less reliance on CRAs considerations from investors, our analysis still shows that for U.S. commercial banks credit rating is a relevant factor to leverage levels. This indicates that investors still have to incorporate this variable to some extent in their investment decisions, and thus affects banks business models as they perceive the importance of rating notations for the investor community.
This paper is organized as follows. Section 2 contains the literature review organized by themes and discusses some caveats based on survey research. Section 3 describes the empirical design. Section 4 defines our model and data, followed by the section 5 where we discuss the results of the hypothesis tested. Section 6 states limitations and makes some suggestions for further analysis and section 7 presents the concluding remarks.
2. Literature Review
The last financial crisis has been an attractive topic for a large number of studies, mainly because it happened in a highly regulated environment. The causes of the crisis are many, but one that is most often referred is easy access to credit, which is a common characteristic of financial crises. Jordá, Taylor and Schularick (2010) made a complete study analyzing the past 140 years and the different crises along that period in an attempt to identify the best predictors for crises and concluded that credit growth emerges as the single best predictor of financial instability. They also linked credit growth to current account imbalances, even if this last predictor weakens in a global crisis. However, the main achievement is that credit growth is related with leverage levels in the banking sector. Carmassi, Gros and Micossi (2009) affirmed that it was a lax monetary policy, mainly in the United States of America, allied to a weak regulatory system that was even more pronounced due to product innovation in the
financial sector that built up an excessive leverage level in the financial system. Moreover, Bean (2010), in his financial crisis study, focused on the macroeconomic side, describing the Great Moderation as a context that encouraged an overly optimistic assessment of risk, which combined with low interest rates that reflected both a loose monetary policy and a relatively high Asian savings rates, encouraged the build-up of excessive leverage in the banking system.
Acharya, Philippon, Richardson and Roubini (2009) stated that typical financial crises that started with credit booms and asset bubbles usually ended with a shock that produced a deleveraging process. According to them, even if this process of integration of global financial markets has delivered large welfare gains, these achievements have come at the cost of increased systemic fragility, evidenced by the last financial crisis. The authors explained the origins of the crisis, mainly by leverage levels and credit risk, to propose new regulation and public policies to avoid future crises as weak supervision and regulation were part of the problem that sparked the crisis.
Dia (2011) described banking relations by saying that banks operate by developing a network of personal relationships. By deregulating the system in the 90’s (based on the principle of information disclosure) as an attempt to make it more efficient and diversified, it was meant to create a safer system. However, the results were innovation on financial contracts not backed by trust and reputation as is the case in the conservative bank model, which allowed a more risky and fragile banking model that led to the crisis.
Our study approaches the use of leverage from a creditor or bondholder perspective and assesses the balance sheet leverage of banks and its relation with the credit ratings of the banks. As the credit rating is an indicator of the health condition of a bank, it materially determines the bank’s access to the debt markets.
Previous researchers related the last financial crisis with ample liquidity, which means that credit growth translated into banks with higher leverage levels. We depart from this theme to complement other previous studies (Gropp and Heider (2010) and Kisgen (2009)). Our study focuses in the leverage level of banks and tries to explore their level as a function, among other factors, of credit ratings of CRAs. The paper was based on the approaches of Kisgen (2009) to corporate firms, and Gropp and Heider (2010) to the banking sector. As far as we
acknowledge, the relationship between leverage and credit rating is a new topic, despite the significant number of studies on both leverage and credit rating.
Even though our study is based on Kisgen’s approach regarding the effect of credit ratings changes in the capital structure and in the leverage level of corporate firms, some of the concepts used need to be adapted to comply with the specificities of the banking sector. The goal is to assess the ratings credit status’ changes to a bank’s (financial sector) leverage, and whether credit ratings actions constrain a bank business model and, consequently, its leverage ratio. Kisgen, in previous research, also examined to what extent credit ratings directly affect capital structure decisions. The author concluded that firms near a credit rating upgrade or downgrade issue less debt relative to equity than firms not near a change in credit rating, which implies discrete costs (benefits) of rating changes despite these are not explained by the traditional capital structure theories.
One of the most comprehensive studies on U.S. corporate sector leverage variables has been done by Frank and Goyal (2004) that tried to better understand all the previous theories explaining the motives behind capital structure decisions (trade-off, market timing, pecking order). They included a wide range of variables already covered by literature and conducted a dynamic analysis over time since they believed that the variables relevance may change with time. According to circumstances several theories are valid because variables also point to more or less intensity depending of firm circumstances. They finalized by alerting that a unified theory explaining leverage levels might be beyond reach, but their most relevant contribute is the exhaustive test on almost all variables already studied.
The capital structures of the corporate and financial sectors have been central in many literature models and the leverage target concept has been very relevant for many of these theories. Ranging from Modigliani and Miller (1958) trade-off theory, where firms optimize their capital structures by trading off the tax benefits of debt financing against the costs of financial distress, to agency models according to Jensen and Meckling (1976), where a target leverage minimizes the sum of the agency costs of managerial discretion, associated with equity financing and the agency costs of debt, to justify leverage levels across firms. The evidence on target leverage comes in several studies like Roberts and Leary (2005) that started their research questioning whether firms adjust their capital structures by testing the trade-off theory for the corporate sector. They concluded that the targeting is a goal, but due
to adjustment costs it can be done through a longer period, suggesting that market timing theory is not an explanation. Also, Flannery and Rangan (2006) developed the issue that firms have a target capital structure and “targeting” behavior that explains far more of the observed changes in capital structure than market timing or pecking order considerations.
Antoniou, Guney and Paudyal (2008) worked on corporate capital structure departing from two distinct scenarios: market and bank oriented economies. They took several variables already used in previous studies as the most reliable to explain capital structure and introduced a new concept: the financial orientation of the economy (market-based versus bank-based). Additionally, they confirmed that firms have a target leverage ratio and that the financial context (market or bank orientation) can influence this target.
On the financial sector, Memmel and Raupach (2007) analyzed banks adjustment to capital ratios target to conclude that they do it via a target level and also that private banks with liquid assets are more likely to adjust their capital ratio tightly than those with less liquidity on the balance sheet. They additionally found that banks compensate low target capital ratios with low assets’ volatility and high adjustment speeds, even if banks with a target capital ratio seem to use an internal lower limit for their current ratios that is just above the regulatory minimum. Also, Barber and Lyon (1997) departed from previous studies, particularly Fama and French (1992), to obtain a relation between several variables, such as book-to-market and size as explanatory of returns, applied to financial firms. They managed to prove that this relation is quite similar on financial and non-financial firms, once again transposing work developed on corporate sector to financial.
Flannery and Rangan (2004) in a study of U.S. Bank Holding Company (BHC) regarding bank capital build-up in the 90’s for U.S. banks achieved two interesting considerations. Firstly, academic and industry models for banking firms should not assume that supervisory capital standards always constrain a bank, at least for the largest – and hence most important – U.S. banking firms. In their analysis of U.S. banks during the 90’s, higher capital levels was accompanied by increased risk-taking within the banking sector, and banks with the riskiest portfolios ended up holding the most equity. Secondly, the market’s ability to induce higher capitalization at riskier banks provides further support for the role of market forces in supervising large financial firms. As a consequence, market disciplinary forces appear to have a larger impact on BHC capital ratios than regulatory standards do.
Still on banks leverage levels, Adrian and Shin (2008) also detailed this concept to U.S. banks and started by linking it to economic cycles and money expansion. All the banks seemed to adjust to a leverage target during economic cycles. When considering the volatility of assets and liabilities, book leverage of bank holdings is higher during booms and lower during troughs. They separated their analysis in two different types of banks: commercial banks, where loans are the more representative assets, and more rigid to the economic cycle, explaining more volatility in leverage targets; and investment banks, on the other side, where assets are mainly formed by securities that follow the market prices, the assets and liabilities varies more hand-in-hand. The cycle may even contribute to the strengthening of this adjustment, since a positive cycle contributes to lower leverage via assets valuation, which prompts to more buying to adjust to target, and vice-versa. The authors concluded by stating that credit expansion and bank leverage are significantly correlated and indicated that indeed banks do pursue a leverage target.
On the opposite, Doukas, Guo and Zhou (2010) developed an interesting study relating capital structure shaping to debt markets’ access by linking debt issuance to hot debt markets, which means that a firm with high adverse selection costs (pecking order theory) issues more debt when market conditions are perceived as hot and vice-versa, incorporating market timing of equity. The authors also indicated that there is a persistent hot-debt market effect on capital structure, meaning that hot-debt issuance firms do not rebalance their leverage to converge to an optimal capital structure range, contradicting the premise of leverage target.
Public information is a central need for financial markets, a condition to evaluate uniformly and certify companies. Banks are one of the agents that most rely on this source of information, as regulators are as well and also by regulation. Moreover, as the crisis emerged the focus on credit rating and agencies had been a hot topic.
Regarding the importance of ratings for the banking industry, Cantor and Packer (1994) elaborated a study on credit rating industry, their methodology and growing ascendant to regulators. On the banking side they called attention to the increasingly global capital markets and internationalization, which makes harmonization on CRAs crucial. They concluded by saying that regulators and investors should be more critical on agencies assessments as a source of rational for decisions.
There are already some studies where the rating explaining power is tested in different circumstances. Ferreira and Gama (2007) analyzed the sovereign rating effects on stock markets performance spillover to countries and also applied the crisis variable to achieve similar results. Negative rating news is associated with negative market reaction but positive rating news, in a crisis period, doesn’t necessarily imply a positive reaction.
The question if banks are more difficult to evaluate by CRAs, or even by the investor community in general, is also quite relevant, as the business model and intermediation is somehow more disseminated, with several risks to consider coming mainly from information asymmetry. The most cited reasons to justify regulation are systemic risk and deposit protection. Iannotta (2006) addressed this issue by studying credit agencies discordances (split ratings) on banks bonds versus non-bank bonds, adding the effect by bank assets and capital as a factor to explain disagreements between banks. The author concluded that it exist some differentiation after controlling for risk (lower seniority), size, tangible assets (versus intangibles) and capital ratio. This analysis highlights the argument to also use credit rating as a variable to constrain capital structure at banks.
In the process of assessing the credit rating of a bank, CRAs consider several financial risk aspects as intrinsic factors, such as capitalization, funding profile, asset quality, profitability, business model or diversification. Additionally, CRAs consider other risks as external factors, such as industry risk, economic risk or sovereign risk. The rating process also considers possible rating supports, such as sovereign support due to the systemic importance of banks, thus CRAs assign a credit rating with a credit enhancement and provide a stand-alone assessment of the credit quality of a bank without a credit enhancement. Moreover, CRAs assign both a long-term and a short-term issuer rating to the bank. Our paper will focus only in the long-term rating as it is the most relevant one due to the fact that banks operate in the long-term and this tenure also incorporates the short-term issues affecting a bank. Regarding the leverage ratio of a bank, the main point of analysis of our paper, is considered within the capital assessment part of the financial risk rating process.
Among the major world CRAs, three arise as the most important ones, mainly Standard & Poor’s, Moody’s and Fitch Ratings. In February 2007, Moody’s introduced a new methodology framework – Joint Default Analysis (JDA) – whose main modification was the
incorporation of Joint Default Analysis into Moody’s bank rating methodology, identifying four potential sources of external supports for banks; i) parent support, ii) support from a cooperative or mutualistic group, iii) support from a regional or local government and iv) systemic support. As a consequence, countless banks around the World had a material rating upgrade of several notches, which obfuscated the real credit rating of banks. Even though the approached used in this paper is similar to the one applied by Kisgen, banks ratings are somewhat more complex than corporate ratings as the former incorporate a significant a significant sovereign support due to the systemic risk of banks.
Within the most impacting U.S. financial regulation, in a brief note to situate the U.S. banking sector regulation nowadays, we refer first to The Glass–Steagall Act of 1933, which was passed as a reaction to the collapse of a large portion of the American commercial banking system in early 1933. One of its provisions introduced the separation of bank types according to their business (commercial and investment banking). In order to comply with the new regulation, most large banks split into separate entities, a feature that prevailed until the crisis. Such a separation can be regarded as a weakness of the U.S. financial system, mainly for the investment bank sector that lacked a solid and stable deposit base and was highly dependent on wholesale funding, which motivated a series of M&A (Mergers and Acquisitions) during the crisis and consequently reshuffled the U.S. banking sector.
In the end of 2007, while the most important U.S. commercial banks and investment banks enjoyed a relatively high rating level, their leverage ratio reflected the excessive leverage taken to improve profitability and boost results. The excessive leverage level was even more significant for some of the investment banks, especially for Lehman Brothers and Merrill Lynch, the only banks with a rating in the “A” bucket. Those two institutions faced harsh problems to the point that they were no longer able to subsist and on September 14, 2008, Merrill Lynch had to be rescued by Bank of America and Lehman Brothers went bankrupt. As a measure to help the survival of U.S. banks, the Public Law 110-343 was enacted in October 3, 2008, and created the TARP (Troubled Assets Relief Program) in order to buy toxic assets from banks, thus reducing its leverage ratio levels as balance sheet started to shrink. We considered only commercial banks in our analysis due to the specific characteristics of investments banks that could distort the analysis.
Kisgen (2009) examined whether managers target credit ratings in making their capital structure decisions on the corporate sector. He argued in a previous paper (Kisgen (2006)) that higher credit rating levels provide a benefit to a firm by showing that firms adapt (increase/decrease) their leverage levels according to their credit rating levels (upgrade/downgrade). In this paper he tested firms’ behavior after rating changes to conclude that firms react asymmetrically, by lowering leverage after downgrades and responding little to upgrades, due to rating conservation purpose. Therefore, a complete model of capital structure should include credit rating along with other variables.
Other authors, such as Graham and Harvey (2001), surveyed most corporate sector significant companies to conclude that firms Chief Financial Officers (CFO’s) heavily rely on credit rating to guide debt decisions. Faulkender and Petersen (2006) relate capital structure with capital source, by stating that firms that have access to the public bond markets, by having more public information and a credit rating, have significantly more leverage. This makes the credit rating inclusion on capital structure models valid.
Conventional wisdom set the idea that lower leverage balance sheet is positive for creditors; however, from a shareholder perspective, the higher the leverage, the greater the possible return. While for creditors the presence of leverage reflects a higher risk for the bank to fulfill its obligations, for shareholders the presence of leverage increases the bank’s equity value until the optimal amount of leverage that maximizes the firm value. Hence, banks face a delicate balancing act of finding the appropriate leverage level to operate, while maintaining appropriate ratings and addressing both creditors concerns and regulatory leverage requirements.
According to the G-20 Declaration on Strengthening the Financial System (2009) “risk-based capital requirements should be supplemented with a simple, transparent, non-risk based measure that is internationally comparable, properly takes into account off-balance sheet exposures, and can help contain the build-up of leverage in the banking system”. Moreover, the Financial Stability Board report on pro-cyclicality (2009) recommends that “the Basel Committee should supplement the risk-based capital requirement with a simple, non-risk based measure to help contain the build-up of leverage in the banking system”.
The capital structure of a bank includes two main capital layers; the Tier I Capital and the Tier II Capital, with the Tier I Capital including a sub-layer of Core Tier I Capital whose main difference is the exclusion of hybrid perpetual instruments from its calculation (see Appendix II). Since 2011, regulators have been focusing on Core Tier I Capital rather than Tier I Capital; nevertheless, leverage ratios are still focused only in Tier I Capital. The purpose of this paper is not to address the Basel Accords’ evolution, but rather how different changes influenced the leverage ratio. So far the impact has been minimal for two reasons: i) U.S. banks have not yet fully adopted the Basel II Accord and thus were not affect by its changes and ii) the banks that already have to cope with Basel II capital requirements are not subject to leverage requirements.
Prior to the emergence of leverage ratios (Basel III), major central banks of the world developed under the sponsorship of the BIS (Bank for International Settlements), a set of capital standards to more accurately align regulatory capital with risk. The first accord, the Basel Accord of the Basel Committee on Banking Supervision (1988)specified that the Total Capital adequacy ratio must be at least 8% of risk-weighted assets and the Tier I Capital adequacy ratio must be at least 4% of risk-weighted assets. First published in June 2004, revised in June 2006 and started to be implemented in 2006 / 2007, Basel II is the second of the Basel Accords by the Basel Committee on Banking Supervision (2006) and one of its main developments, compared to Basel I, is a more risk sensitive capital allocation, meaning that if until that date banks could only improve their regulatory capital by issuing equity, reducing assets or both, banks now could increase their regulatory capital by changing the composition of their assets. Some criticism may be addressed to the capital requirements of this second accord as it did not fully control the leverage level being adopted by banks and that ultimately was one more spark to the financial crisis. Moreover, the first two Basel Accords neglected the leverage level of banks, thus most banks were not considering the impact of their leverage in the ratings. There were however two exceptions: U.S. banks and Canadian banks.
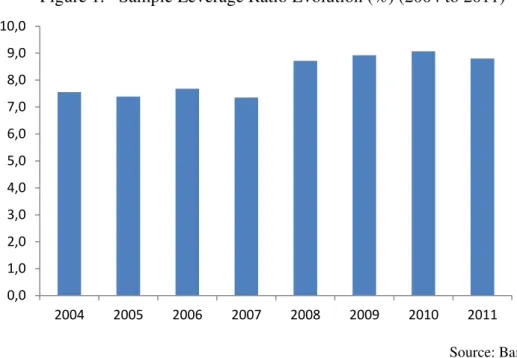
Before the crisis (2008), only two regulators had leverage ratios regulation, mainly the U.S. regulator FDIC (Federal Deposit Insurance Corporation) that required a minimum leverage ratio of 3% for strong bank holding companies and 4% for all other bank holding companies, (please refer to fig. 1 to our sample leverage evolution) and the Canadian regulator OSFI
(Office of the Superintendent of Financial Institutions) that established a maximum assets to capital multiple of 20 times.
Figure 1. Sample Leverage Ratio Evolution (%) (2004 to 2011)
Source: Bankscope
The importance of leverage in the banking system grew due to the crisis and several new regulators established a leverage ratio as a regulatory measure. The Swiss regulator FINMA (Swiss Financial Market Supervisory Authority) introduced a limit of a 3% leverage ratio at the group level in 2009 to be progressively implemented until it is fully applicable in 2013.
The Basel Committee on Banking Supervision (2010) presented the framework for the Basel III Accord, introduced a leverage ratio as a supplementary measure to the Basel-risk framework, proposing a minimum ration of 3%, although European Banks will start to calculate the leverage ratio only in 2013, reporting the leverage ratio in 2015 and will become a mandatory ratio only in 2018. The end of 2011 came with APRA’s (Australian Prudential Regulation Authority) proposal to also introduce a leverage ratio that will be the global minimum requirement to be implemented in the globally mandated timeframe. However, other regulators, such as the UK’s HM Treasury (2011), are requiring a quicker disclosure of the leverage ratio and UK banks are asked to start reporting their leverage ratios to investors not only in 2015 but already in 2013.
As the leverage ratio becomes a regulatory ratio and banks have to comply with two different capital requirements – risk-based capital requirement and leverage capital requirement –
0,0 1,0 2,0 3,0 4,0 5,0 6,0 7,0 8,0 9,0 10,0 2004 2005 2006 2007 2008 2009 2010 2011
banks will be more aware of their leverage levels and will accommodate those to successfully meet its minimum required level, which could influence credit ratings of banks. Despite the introduction of a leverage ratio by the BCBS, already implemented by the FINMA, the banks of those jurisdictions are only now starting to cope with leverage requirements and probably their balance sheet is yet to be structured according to not only the regulatory minimum leverage ratio, but also to the banks’ target and optimal leverage ratio. In fact, a simple statistics analysis, as we did previously, confirms that there is a huge dispersion among leverage measures, and that there is a specific target for each bank as indicated by previous literature (as already pointed by Gropp and Heider (2010)). That is one of the reasons why the paper focus its analysis exclusively in U.S. commercial banks as these have been coping with a leverage ratio for several years, including the pre-crisis and the post-crisis periods.
There is an interesting study on regulation and the consequences to financial sector on U.S. and Canada banking system, by Brean, Kryzanowski and Roberts (2011). The authors concluded that the differences in industry concentration, regulation and competitive structures can explain why those two systems fared so differently during crisis. One of the main reasons why Canada, known by the banking robustness during the crisis, did so well is its stricter limits on bank leverage. Answering to the question “did financial supervision matter?” an IMF paper by Masciandaro, Pansini and Quintyn (2011) tried to explore the main weaknesses on regulation that permitted the crisis to happen. The paper points to a system where the supervision should be set at a macro and micro levels, with several checks and balances.
When Basel III was proposed, the U.S. commercial banks only had to comply with a new high risk-based capital requirement as the leverage capital requirement was already implemented in the U.S. banking system. The stress tests conducted by the U.S. Federal Reserve System (2012) showed that the whole sector aggregated leveraged ratio were 7.4% in third quarter of 2011 was significantly above the minimum regulatory ratio of 3% or 4%, and would still be at 4.7% in the end of 2013 under the hypothetical Supervisory Stress Scenario. Similar tests were conducted by the European Banking Authority (2012) and a positive trend can be witnessed as the aggregated leverage ratio improved from 4.0% (2.7% assuming full Basel III implementation) in June 2011 to 4.1% (2.9% assuming full Basel III implementation) in December 2011.
Our study departs from leverage on U.S. banks as the central idea and tries to expand it using prior contributes (on both the corporate and the banking sectors) by explaining the leverage level taking in consideration some central variables. Then we introduce a new variable: credit rating departing from Kisgen (2009) methodology and applying it to two periods (pre-crisis and post-crisis) to evaluate the impact of the determinants of leverage levels. Considering some of those studies on capital structure, particularly those who focus on the most consensual covariates (Kisgen (2009), Flannery and Rangan (2006), Frank and Goyal (2004)) on corporate sector, but also on banking sector. Gropp and Heider (2010) adopted a similar methodology, taking some of most consensual corporate finance theory and apply it to banks.
We relate all these themes that we have described - leverage, credit ratings and crisis - to deliver empirical results regarding U.S. commercial banks.
3. Empirical Design
The purpose of our work is to study two main subjects – ratings notations relevance for bank leverage and the impact of the crisis on bank leverage – and extends two analyses, Gropp and Heider (2010) on capital structure determinants and Kisgen (2009) on credit ratings notation changes and firm’s leverage.
Our first aim is to test for the consequences of rating changes in the leverage levels of the banking sector in a specific period (2004 to 2011). We chose this period as a complement to Gropp and Heider (2010) analysis in order to extend their analysis to a period that covers important regulatory and financial industry changes. We also want to apply the partial adjustment model of capital structure as in Kisgen (2009), which departed from Flannery and Rangan (2006), according to Gropp and Heider’s (2010) approach. Our second goal is to evaluate whether the crisis has already produced any effect on banks’ leverage levels according to the massive rating chances observed in the sector during the analysis timeframe, which we break in two sub-samples covering the pre-crisis period (2004 to 2007) and the post-crisis period (2008 to 2011).
Considering Gropp and Heider (2010) approach, it was adapted previous research regarding the corporate sector relation with debt level to apply it to the financial sector, proving that the leverage variables that explain leverage can be transposed to the banking sector.
1) Lt = β0 + β1MTBt−1 + β2Proft−1+ β3Ln(Sizet−1) + β4Collt−1 + β5Divt + εt
Gropp and Heider (2010) equation 1) explains leverage (L) as a function of the most relevant variables from other studies applied to corporate sector leverage determinants, such as MTB, market-to-book ratio (please consult Appendixes I and IV for further explanations), Prof to define profits, ln(Size) to define the total book assets size (as a logarithm to standardize variables), Coll to define collateral, Div to dividend payout ratio and ε to define the error term. All variables, except the dividend, are lagged by one period (as in Gropp and Heider (2010)).
We take risk as a relevant factor, particularly for the timeframe covered (equation 2)). Risk is stock returns volatility as explained in Appendix IV). We prefer to apply an absolute volatility measure rather than asset risk to more accurately reflect the period conditions.
2) Lt = β0 + β1MTBt−1 + β2Proft-1+ β3Ln(Sizet−1) + β4Collt−1 + β5Divt + β6Ln(Riskt)+ εt
According to Kisgen’s model, credit rating is a valuable variable in the manager’s capital structure decisions because there are discrete benefits linked to a higher credit rating level. This assumption – named Credit Rating Capital Structure or “CR-CS” – applied to the financial sector implies that the leverage level should also be constrained via those variables.
Departing from Kisgen (2009), defining BX as the matrix of independent variables already exposed in 1) and 2), we want to apply credit rating changes to financial sector to test if the results obtained for the corporate sector are also applicable to our study, in a particular period where rating classifications were put to test. Moreover, we add a crisis variable. Thus we arrive to the next equation, where we search for the significance of rating credentials, by adding rating negative changes with downgrade variable and positive changes with upgrade variable (for further details please consult Appendix IV).
3) Lt = β0 + β1MTBt−1 + β2Profi−1+ β3Ln(Sizet−1) + β4Collt−1 + β5Divt + β6Ln(Riskt)+ θ
downgrade it-1 + φ upgrade it-1 + π crisis it + εt
We validate this analysis for the whole sample and additionally for both periods (pre-crisis and post-crisis) to better understand the dynamics of rating variables.
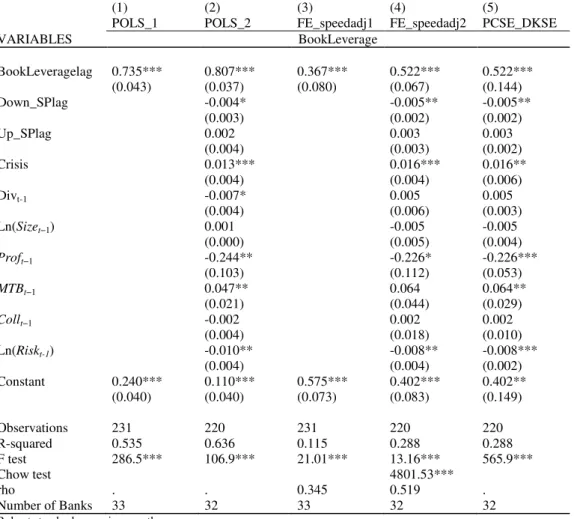
Following Kisgen (2009) and Gropp and Heider (2010) we add adjustment speed to target leverage ratios. Our main purpose is to estimate the adjustment speed for leverage in banks, in this particular period for U.S. commercial banks, containing several regulatory constraints and at same time a structural adjustment for the banking industry.
4) Lt = β0 + λBXt−1 + (1 − λ)Lt−1 + εt
We depart from Antoniou, Guney and Paudyal (2008) and Flannery and Rangan (2006) that explained that the adjustment for the leverage target is done partially due to costs. So firms would adjust their leverage level at a certain degree which in equation 4 comes as λ (the coefficient is 1 less λ), and a value close to one implies a fast adjustment. We extend our tests to both periods (pre-crisis and post-crisis) to understand the dynamics in between.
4. Model and Data
4.1 Model
Our data come from two sources: the book data from Bankscope and the market data from Bloomberg. The purpose was to achieve a simple and homogeneous sample, particularly in regulation in order to extract the regulatory effect from the analysis, and relevant in financial terms. This is why we chose U.S. commercial banks.
Regarding the data extracted from Bankscope, and in order to obtain a complete database, we also limit the initial sample to commercial banks with total assets over 10 billion USD (for at least one year on the analysis period) as these institutions would be the more representative of market tendencies across the analyzed period. As the central focus of this study is the crisis since the end of 2007, the period under analysis starts from four years before crisis until four
years after, with the 2004 to 2007 years defined as the pre-crisis period and the 2008-2011 years defined as the post-crisis period. The U.S. financial market is quite diversified with a wide range of institutions so we restrict the analysis exclusively to commercial banks, leaving investment banks and savings banks aside, as they could contort the initial purpose of our study. As the credit ratings are a determinant variable, the sample was also restricted to those commercial banks that had credit ratings for at least one of the main CRAs (Standard & Poor’s, Moody’s and Fitch Ratings) throughout the analysis period or at least for two consecutive years. The rating is the bank Long Term Issuer Credit Rating for Standard and Poor’s, Long Term Issuer Default Rating for Fitch Ratings and Issuer Rating for Moody’s.
After our database has been settled we extracted from Bloomberg all the data related to market data for the same variables and for the period analysis, also according to Gropp and Heider (2010) methodology, in order to achieve the market data (market leverage).
The summary statistics for both market and book leverage are displayed in Tables 1 and 2. In Table 1 market leverage, via financial market effects (lower equity levels), confirms the tendency to augment, as expected. Additionally, Table 2 presents very consistent and equal levels for leverage for the sample period as book values are quite similar. Table 3 also confirms a similarity on regulatory leverage values, as expected, since its parameters are controlled by supervisors. On Table 4 is possible to confirm that mean value for downgrades is higher to mean value for upgrades, since we consider a crisis period on the sample and we also worked with a sample where the size of the banks is less homogeneous if we compare it with other works, such as Antoniou, Guney and Paudyal (2008) or Frank and Goyal (2004).
4.2 Data
We start the analysis by comparing the different leverage variables: i) market leverage and ii) book leverage to evaluate whether there is any considerable distinction among them.
We do not reject the null hypothesis for market leverage by Jacques Bera (JB) tests (at 1% significance level) and the variable has normal shape. This is confirmed via other tests as Lilliefors, Cramer-von Mises and Watson, that validates our findings.
Figure 2. Histogram of Market Leverage
As for descriptive statistics (Tables 1, 13 and 14) is possible to confirm a tendence before and after Lehman Brothers, with higher market leverage (as per defenition in Gropp and Heider (2010)) after the crisis (September 2008) in all the measures. In tables 10 and 11 we present further information about market leverage and book leverage, for both the pre-crisis and post-crisis periods.
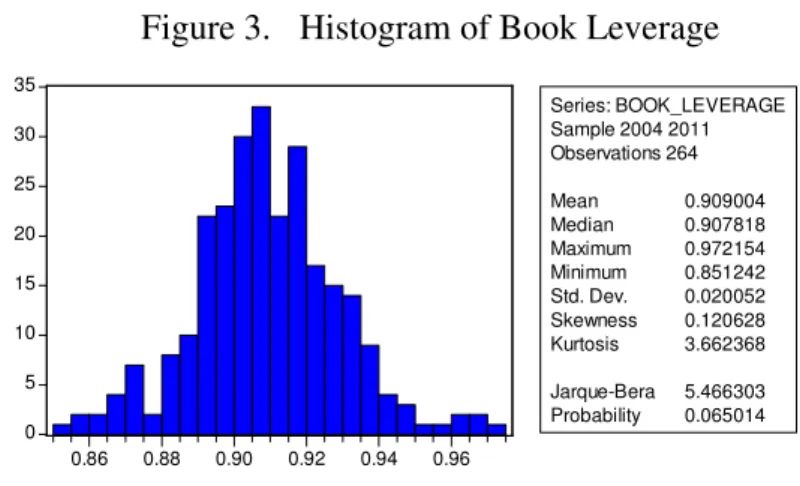
Testing for book leverage we find similar characteristics; book leverage appears to have a normal distribution (1% of SL on JB test also confirmed via the same tests as Market Leverage).
Figure 3. Histogram of Book Leverage
The numbers are quite similar for book leverage for the time horizon as expected, with a slightly decrease explained by the strenghtning of equity to comply with regulatory requirements. 0 4 8 12 16 20 24 0.75 0.80 0.85 0.90 0.95 Series: MARKET_LEVERAGE Sample 2004 2011 Observations 264 Mean 0.867011 Median 0.868497 Maximum 0.983101 Minimum 0.715149 Std. Dev. 0.058998 Skewness -0.170214 Kurtosis 2.383341 Jarque-Bera 5.457755 Probability 0.065293 0 5 10 15 20 25 30 35 0.86 0.88 0.90 0.92 0.94 0.96 Series: BOOK_LEVERAGE Sample 2004 2011 Observations 264 Mean 0.909004 Median 0.907818 Maximum 0.972154 Minimum 0.851242 Std. Dev. 0.020052 Skewness 0.120628 Kurtosis 3.662368 Jarque-Bera 5.466303 Probability 0.065014
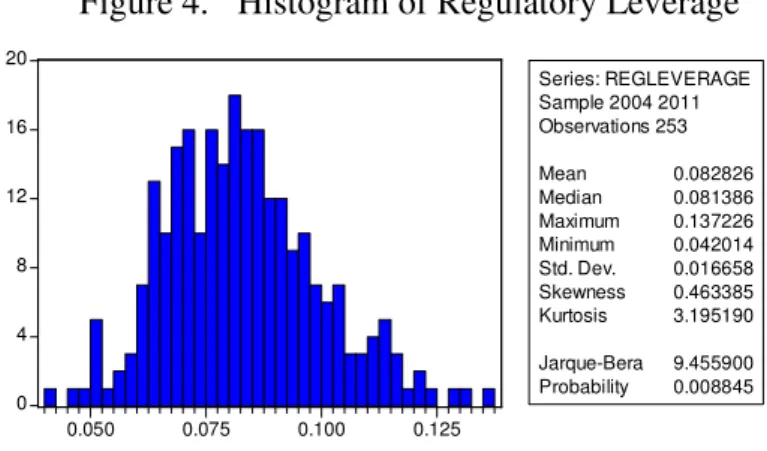
The distribution does not appear to be normal for the regulatory leverage, according to the rejection of the null hypothesis. This variable, a regulatory one, implies that there is a buffer on legislative capital, as already shown in Gropp and Heider (2010).
Figure 4. Histogram of Regulatory Leverage
The regulatory leverage variable diminishes after the crisis started, also as expected, as a consequence of capital increase. However, the evolution of the regulatory leverage levels shows a greater dispersion within our sample banks. On one hand, the trend remains for the bigger banks and the regulatory leverage not only continues to diminish, but more importantly reaches its minimum level since the crisis, which is an interesting feature. On the other hand, the smaller banks present an increase in the regulatory level due to the severity of the crisis, with increased impairments’ due to regulatory demands in order to achieve a cleaner balance sheet and that forced losses recognition in the already weaker banks.
We test for the three CRAs in order to evaluate the most suitable one. When using Standard & Poor’s ratings we have evidence for Fixed Effects being a consistent model (Hausman test reject H0 with 1% significance level). Moreover, we found evidence of Cross Section Fixed Effects. When we test for book leverage (with Standard & Poor’s also) we obtain Random Effect as the most efficient, but no bank effects. As for the regulatory leverage (again with S&P) we obtain a even lower r-squared (34%) and there is Random Effect evidence with no bank effects.
From all these attempts the S&P ratings is the most robust rating agency for our regression. We could obtain Cross Section Fixed Effects evidence, where all but two variables (profits
0 4 8 12 16 20 0.050 0.075 0.100 0.125 Series: REGLEVERAGE Sample 2004 2011 Observations 253 Mean 0.082826 Median 0.081386 Maximum 0.137226 Minimum 0.042014 Std. Dev. 0.016658 Skewness 0.463385 Kurtosis 3.195190 Jarque-Bera 9.455900 Probability 0.008845
and size) are significance at 1% SL (dividend at 10% SL). Also testing for book leverage we obtain the most robust regression.
Moreover, and according to Alsakka and Owain (2010) there is evidence that a lead–lag relationship exists in sovereign ratings and evidence of interdependence in rating actions, which also supports our restriction to one rating agency.
5. Results
Our main achievements extends Gropp and Heider (2010) sample considering the crisis period (between 2004 and 2011) and the regulation changes period, which makes the conclusions to the banking sector more robust. As for the model we complete Kisgen (2009) regarding ratings variable in explaining leverage also for the banking sector. Rating changes do apply for the banking sector as a covariate for leverage levels, particular to market leverage measure and in a more adverse scenario for CRAs. Additionally, we test the adjustment speed for the leverage target in the crisis period (2008-2011) to conclude that it increased.
5.1 Descriptive Statistics
In Table 4 we present an overview of the variables used. As for the independent variables, book leverage and market leverage, we have similar characteristics to previous studies (Gropp and Heider (2010)) even if we stick to just one jurisdiction to avoid regulation issues that could affect our analysis. Book leverage has a mean of 91%, ranging from 85% minimum to 97% (slightly lower than Gropp and Heider (2010)) with a lower mean for market leverage (87%). If we compare it with Antoniou, Guney and Paudyal (2008) or Frank and Goyal (2004) for similar corporate analysis, both variables are much smaller in this author’s work than for the banking sector that has leverage as one of main features.
Furthermore, we have a dividend pay-out ratio smaller than in Gropp and Heider (2010) as expectable since we are covering a pre-crisis and post-crisis periods while other studies covered the corporate sector during a non-crisis period (e.g. Frank and Goyal (2004)). Our sample mean to the variable total book assets size is 183 billion euros but there is also a large dispersion among the banks considered. Moreover, the profits variable is, for our sample,
much lower than Gropp and Heider (2010) and Frank and Goyal (2004), which could be partially explained by the fact that the period covered (2004 to 2011) contains a post-crisis period. As for the market-to-book ratio, we obtain a smaller mean for the whole sample, comparing with the prior research for either banks or corporate firms (Gropp and Heider (2010) and Frank and Goyal (2004)), also potentially explained by the fact that the period covers part of the crisis. The collateral variable in our sample is bigger than in the previous period, which can be explained by the necessity to get a more liquid balance sheet to better and more rapidly adjust business models that prompt banks to augment their exposition to collateral eligible securities. Others potential reasons are that these banks are operating in a market-oriented economy which propels less leverage and more collateral, and because with the low level of interest rates has been a higher pre-payment tendency among mortgage segment. Finally, for risk variable we use volatility in our analysis.
Regarding the credit rating variables that we use - downgrade and upgrade variables - we point to the fact that the number of downgrades substantially exceeds the upgrades during the period of analysis, as expected. This reflects a period of financial and economic downturn that led to the deterioration of banks’ balance sheets and consequently impacted capital ratios and funding capabilities, putting pressure on banks’ business models.
Table 5 presents the correlations among the main variables at the bank level, which are close to those typically found for the banking sector (Gropp and Heider (2010)). Banks’ market leverage and book leverage increases with size, as bigger banks have more facility to increase leverage due to their systemic importance (“too big to fail”) and also an easier access to the wholesale debt market due to their bigger size. A bank’s market-to-book ratio correlates positively with profits, which means that if a good profitability level is expected, market prices would reflect it. Market to book ratio correlates negatively with leverage since 2008 when US supervisors proposed the Volcker Rule, which would increase capital requirements for trading activities, bring capital cost for trading activities higher and also when Basel III legislation was presented, which would increase costs for the banking activity, meaning a more conservative but less profitable business model. Most of the correlations are higher than those in Gropp and Heider (2010), due to not only the set of the analysis period, but also due to a more homogeneous sample, at least geographically (only U.S. commercial banks).
5.2 Corporate Finance Style Regressions
As we previously stated, we used the methodologies of Gropp and Heider (2010) and Kisgen (2009). Firstly we test through a top-down analysis several independent variables in order to obtain the most significant ones (results not shown). We test for all the initial independent variables statistical significance and arrive to a final regression for market leverage, as in equation 3) in line with Gropp and Heider (2010) with all variables lagged except dividends and crisis (after selecting Standard & Poor’s rating agency for the credit rating variable as already exposed).
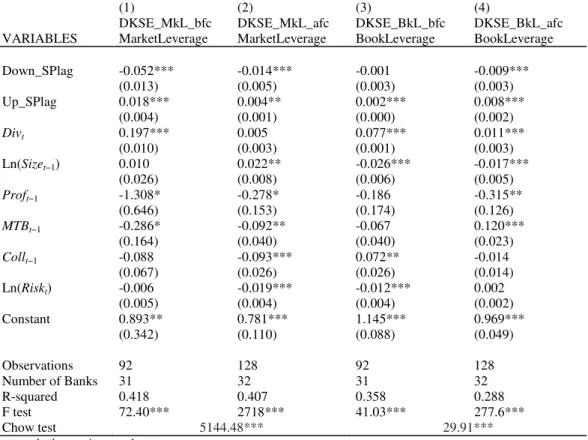
In Table 6 we compare the final model results for market leverage and book leverage. We arrive to results in line with Gropp and Heider (2010), with most of covariates’ signs in line with previous research. In columns 1 to 4 we exhibit the final regressions for market leverage and book leverage (FE_MkLCluster1, DKSE_MkL2, FE_BkLCluster, DKSE_BkL).
Market leverage regression inicially shows evidence for Fixed Effects, via Wald test with 1% SL. We also obtain evidence for fixed effects through Hausman test. Then we perform a test for period and cross section heteroskedasticity3, finding evidence of period heteroskedasticity and cross-section homoscedasticity (results not shown). Next we test cross-section independence (null hypothesis) with Pesarans’ test, which strongly rejects null hypothesis (H0), hence there is evidence suggesting the presence of cross-sectional dependence (contemporaneous autocorrelation) (results not shown). As for first order autocorrelation, we use Wooldridge test for autocorrelation in panel data and do not reject the null hypothesis of no first order correlation (results not shown).
We arrive to our market leverage fixed effects model (final) adjusted for heteroskedasticity (cross-section and period) and contemporaneous correlation. After identifying these problems we correct on the model (with fixed effects) using Driscoll and Kraay standard errors (DKSE) since they have better results in the presence of heteroskedasticity, cross-section (spatial)
1Clustering at bank/firm level was applied to standard errors as a way to correct for heteroskedasticity
2 Driscoll and Kraay propose a nonparametric covariance matrix estimator that produces heteroskedasticity and autocorrelation consistent standard errors which are robust to general forms of spatial and temporal dependence, adapted on Stata.
3 We perform a robust equal variance test, Robvar, which tests the equality of standard errors, departing from Levene (1960) statistical test and Brown and Forsythe (1974) statistical test.
correlation and autocorrelation (temporal correlation), as Hoechle (2007)4 highlights (these standard errors are robust to very general forms of cross-sectional and temporal dependence).
We apply the same analysis to book leverage (model on column 3 and 4 respectively).
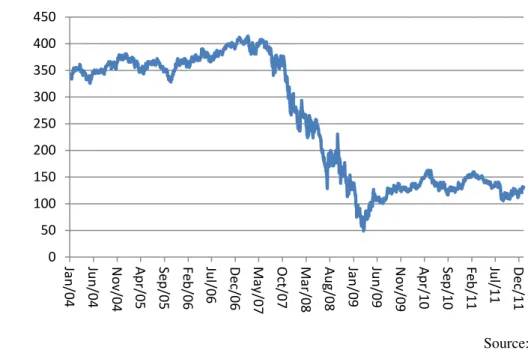
Our final results using DKSE (column 2, DKSE_MkL) show a globally more precise model using only clustering for standard errors at firm/bank level as explained before (see footnote 2) (column 1, FE_MkLCluster), since the robust standard errors are lower for almost all variables than in the DKSE_MkL model (column 1), excluding collateral and dividends which are not significant for the final model. We obtain a significant coefficient (at 1% level) for downgrade, with a negative sign, very similar to Kisgen (2009); however, contrary to this author, we also obtain a significant (at 1% level) and positive coefficient for upgrade. The downgrade coefficient is slightly lower based on the fact that commercial banks may encounter higher difficulties (compared to Kisgen sample) to deleverage as they are more exposed to leverage than corporates. Also, here the upgrade coefficient is significant because in fact as a commercial bank is perceived as a higher quality institution (by rating effect) that translates into leverage expansion. Moreover, the crisis covariate’s sign is positive with market leverage increase, here quite related with equity market performance during the crisis (figure 5). The size coefficient is positive, as expected, as the liability side is slower to adjust which complies with crisis variable positive with market leverage.
Figure 5. S&P Banks Sub-index (capitalization-weighted) ($bn) (2004-2011)
Source: Bloomberg
4 Acording to Hoechle (2007), the Driscoll and Kraay method for standard errors is quite robust when cross-sectional dependence is present. 0 50 100 150 200 250 300 350 400 450 Ja n /0 4 Ju n /0 4 N o v/ 0 4 A p r/ 0 5 S e p /0 5 F e b /0 6 Ju l/ 0 6 D e c/ 0 6 M a y /0 7 O ct /0 7 M a r/ 0 8 A u g /0 8 Ja n /0 9 Ju n /0 9 N o v/ 0 9 A p r/ 1 0 S e p /1 0 F e b /1 1 Ju l/ 1 1 D e c/ 1 1