Repositório ISCTE-IUL
Deposited in Repositório ISCTE-IUL: 2018-09-10
Deposited version: Post-print
Peer-review status of attached file: Peer-reviewed
Citation for published item:
Nave, M., Rita, P. & Guerreiro, J. (2018). A decision support system framework to track consumer sentiments in social media. Journal of Hospitality Marketing and Management. 27 (6), 693-710
Further information on publisher's website: 10.1080/19368623.2018.1435327
Publisher's copyright statement:
This is the peer reviewed version of the following article: Nave, M., Rita, P. & Guerreiro, J. (2018). A decision support system framework to track consumer sentiments in social media. Journal of
Hospitality Marketing and Management. 27 (6), 693-710, which has been published in final form at https://dx.doi.org/10.1080/19368623.2018.1435327. This article may be used for non-commercial purposes in accordance with the Publisher's Terms and Conditions for self-archiving.
Use policy
Creative Commons CC BY 4.0
The full-text may be used and/or reproduced, and given to third parties in any format or medium, without prior permission or charge, for personal research or study, educational, or not-for-profit purposes provided that:
• a full bibliographic reference is made to the original source • a link is made to the metadata record in the Repository • the full-text is not changed in any way
The full-text must not be sold in any format or medium without the formal permission of the copyright holders. Serviços de Informação e Documentação, Instituto Universitário de Lisboa (ISCTE-IUL)
Av. das Forças Armadas, Edifício II, 1649-026 Lisboa Portugal Phone: +(351) 217 903 024 | e-mail: administrador.repositorio@iscte-iul.pt
1
POST-PRINT VERSION
A Decision Support System Framework to Track Consumer Sentiments in
Social Media
Marta Nave, Paulo Rita, João Guerreiro
ABSTRACT
With the evolution of web 2.0 and social networks, customers and companies’ online interaction is growing at a fast pace, containing valuable insights about consumers’ expectations that should be monitored and explored in a day-to-day basis. However, such information is highly unstructured and difficult to analyze. There is an urgent need to set up transparent methods and processes to integrate such information in the tourism industry technological infrastructure, especially for small firms that are unable to pay for expensive services to monitor their online reputation. The current paper uses a text mining and sentimental analysis technique to structure online reviews and present them on a decision support system with two different dashboards to assist in decision making. Such system may help managers develop new insights and strategies aligned with consumers’ expectations in a much more flexible and sustainable pace.
Keywords: Sentiment Analysis; Text Mining; Decision Support System; Social Media; Tourist Destination.
2
1. INTRODUCTION
Web 2.0 sites and social media platforms have generated a tremendous amount of valuable information in the last decade due to the relationship that consumers have established with companies and with one another online. Most information reflects individual interpretations of the experiences that consumers are willing to share with others through online reviews. In the tourism sector, such opinions are extremely important because they directly affect booking probability in real-time (Månsson, 2011). Managers must be constantly aware of such information to quickly answer negative opinions or reinforce positive ones. Moreover, online information may help managers to understand which are the most important drivers of consumer satisfaction.
The use of text mining (TM) and sentiment analysis (SA) to analyze reviews has increased in recent years, allowing managers to understand the unstructured environment of textual messages and assist them in designing strategic advantages as they learn the risks and threats of their activity (Bai, 2011). Berezina et al., (2016) have recently used text mining techniques to highlight common categories in consumer opinions and found that satisfied consumers often use intangible rather than tangible aspects on their reviews. However, despite the previous literature on the subject, managers often have no way to quickly highlight the most important reviews, other than research based tips to guide them on which opinions to answer. The current paper aims to bridge such gap by developing a decision support system (DSS) based on the classification of positive and negative experiences reported by tourists on a recommendation system. The main objectives of such system are to allow managers to continuously monitor the market trends, their online reputation and their main competitors’ weaknesses and strengths. Theoretical contributions include: (1) the development of an extraction, transformation and loading (ETL) procedure to deal with unstructured data; (2) the classification of latent topics
3 and sentiments from recommendation systems; and (3) the design of a new data model to accommodate a flexible analysis on big data. The paper uses accurate topic-modeling algorithms based on Bayesians models (Blei & Lafferty, 2007) to group terms into latent topics as well as a dimensional model approach (Kimball & Ross, 2002) to set the basis for a DSS in hospitality and tourism analysis.
Although there are other commercial platforms that allow managers to follow some social media metrics (ReviewPro, 2017), managers often have to rely on a black-box service that limits a more thorough analysis of the algorithms’ accuracy. The current paper presents a data model and a methodology to allow managers to develop their own systems at a much lower cost, in a transparent approach and with the capacity to include customized metrics from gathered data. Managers may be able to use the current DSS to identify opportunities and weaknesses, and perform better informed analyses about the current positive and negative trends in the market while devising their strategies. The current method may be replicated to allow managers to automatically include consumer opinions in their daily decisions.
This paper is organized in three key sections: first, a literature review, which presents a theoretical support for the present research; second, the methodology used; third, the discussion of results and conclusions of this study.
2. LITERATURE REVIEW
Tourism has embraced technological advances, and was one of the first sectors to have a strong presence in social media to allow tourists to better select among multiple different experiences. The current review of the literature starts to discuss such advances in the tourism area and the role that electronic word of mouth (eWOM) played in shaping todays’ decision processes. However, despite the huge amount of information generated online, the adoption
4 of DSS to proactively manage online reputation is still growing, particularly among small and medium sized companies. Thus, the literature review also discusses the introduction of DSS and how they have been used to assist hospitality and tourism managers in their daily decisions using text mining and sentiment analysis techniques.
2.1. Tourism and Social Media
Tourism is a complex and globalized phenomenon of great socio-economic importance due to its economic effects on the destination countries (Darbellay & Stock, 2012). One of the main concerns of the tourism industry is to understand what makes a memorable experience for a tourist, and whether initial expectations materialize during such experience (Xu, 2010). The importance of word-of-mouth (WOM) has been extensively discussed and researched, particularly since the worldwide adoption of the Internet, which made opinions more democratically available and a core influencer of the decision-making process (Anderson, 1998; Goldenberg, Libai, & Muller, 2001; Pan, MacLaurin, & Crotts, 2007; Stokes & Lomax, 2002; Zhu & Zhang, 2006). The number of tourists using the internet to search for
information and make online reservations has increased substantially in recent years (Amaral, Tiago, & Tiago, 2014). Tourism has embraced technology for more than three decades, starting with the evolution of computer reservation systems, communication with customers, interactivity, research tools, mass data storage and support for strategic decision making (Cooper & Hall, 2008). Through the Internet, and more specifically through social media, individuals today can easily read and comment on the ideas and opinions of other tourists (Dellarocas, 2003). Social media is thus considered as one of the most powerful
communication tools to build strong relationships with customers, either through the use of mobile technologies or via web-based devices (Zeng & Gerritsen, 2014). Web 2.0
technologies have promoted User Generated Content (UGC) sites - media content created or produced by the general public rather than paid professionals - and have changed the way
5 people search, find, read, collect, share, develop and consume information (Daugherty, 2008; Ye, Law, Gu, & Chen, 2011). Recent studies have shown that the feedback generated by online users has a significant influence on sales in general, and in tourism in particular
(Akehurst, 2009; Chevalier & Mayzlin, 2006; Duan, Gu, & Whinston, 2008; Schmallegger & Carson 2008; Xiang & Gretzel, 2010). Park, Lee & Han (2007) also suggest that online consumer reviews are often considered more reliable and credible than information provided by suppliers of products and services, since consumers are considered to be more honest information providers. Such phenomenon has been reported by Ayeh et al. (2012), stating that 84% of travel review users reported that online reviews significantly influenced their purchase decision. In addition, Chatterjee & Wang (2012) showed that 47% of tourists were already searching and selecting travel destinations and hotels via the Internet, with 40% using the web to explore and learn about their vacation destination beforehand, 33% deciding on the airline they would choose to travel, and 32% to learn about the culture, events and heritage in the destination country. Recommendation websites, such as TripAdvisor, have become so important that 60% of tourists who use it read reviews online before buying a new product or service, and 80% of those consumers are influenced by such opinions (O'Connor, 2010). Opinions are thus extremely important for marketers to develop their marketing strategies, and align their offerings with consumer’s expectations. However, consumer opinions are typically unstructured in the form of free text, and the enormous amount of information available requires mechanisms of analysis that go beyond reading and interpreting individual opinions. Hence, a semi-automatic approach such as Text Mining (TM) is needed to structure the ever-increasing amount of information and help decision-makers find the positive and negative patterns that affect their organizations.
6
2.2. Text Mining
Text Mining (TM) is the semiautomatic process of extracting non trivial patterns out of unstructured documents (Sumathy & Chidambaram, 2013; Tan, 1999). TM offers innumerous benefits for organizations, such as understanding customers' opinions and studying the brand's reputation online (Sharda et al., 2017). Text Mining is essential for the tourism sector since most of the information shared online is in text format (Moro et al., 2017a; Pande & Khandelwal, 2014). Therefore, a method that is able to structure textual information is needed to uncover the main terms and topics highlighted in text. Text Mining usually starts by extracting reviews, tweets or any other textual information of interest. The corpus is typically a text file (ASCII) free from any formatting styles (Sumathy &
Chidambaram, 2013). The text is then transformed into a bag-of-words format which represents the text as a set of words, ignoring the grammar and their order (Sharda et al, 2017). A common transformation performed is stopword removal, which consists in
eliminating everything that is auxiliary verbs, determinants, articles, pronouns, prepositions, interjections, and more common and irrelevant terms (Blake, 2011; Liu, 2008). A document-term-matrix (DTM) is then generated. DTM is one of the most common ways to structure data contained in the corpus (Feinerer, Hornik, & Meyer, 2008). Due to the high dispersion of the relation between documents and terms, dispersion is often reduced using a weighting factor, such as the term frequency-inverse document frequency (TF-IDF) (Blei & Lafferty, 2009; Feinerer, Hornik, & Meyer, 2008). The text is then tokenized, a process which segments all text into n-grams (one or more words), removing whitespaces and commas (Sumathy & Chidambaram, 2013). A subsequent process of part-of-speech (P-O-S) is usually performed. P-O-S categorizes all terms with a corresponding grammatical feature in the text, such as names, verbs, adjectives, adverbs, pronouns, among others. A similar word may be used in different contexts and P-O-S is able to separate both cases (Indurkhya & Damerau,
7 2010; Provost & Fawcett, 2013; Sharda et al., 2017). A final transformation step before applying clustering or classification methods is the stemming of text, which consists in removing suffixes and prefixes, leaving the root of the word, that is, allowing similar words to be reduced to their radicals, in order not to be identified as being different words (Porter, 1980). For a better understanding of this process, it can be observed, for example, that the words singer and singing are reduced to their radical word sing (Liu, 2008; Porter, 1980).
The previous transformations are performed to make sure text is structured correctly. However, words remain isolated from a broader perspective if they are not grouped into meaningful clusters. Common clustering methods for text mining (topic models) allow mixed membership segmentation, in which a term can be in several clusters at the same time (Blei & Lafferty, 2007). One of the most used clustering algorithms for topic models is the Correlated Topic Model (CTM), which is based on the Latent Dirichlet Allocation (LDA) (Blei &
Lafferty, 2009). This Bayesian model allows latent topics to be formed where each term has a different probability of belonging to each topic. The current paper uses text mining to
categorize the various opinions formulated online using clustering methods such as
Correlated Topic Models (CTM), and using sentiment analysis to extract the polarity of these comments, and prepare them to be used in the decision support system.
2.3. Sentiment Analysis
Sentiment analysis is a set of techniques that seek to find phrase valence in countless comments, blogs or social networks (Mostafa, 2013). Phrases are compared with a
lexicon/dictionary that determines the polarity (positive, negative or neutral) and strength of sentiment markers in text (Kontopoulos, Berberidis, Dergiades, & Bassiliades, 2013;
Paltoglou & Thelwall, 2012). Sentiment analysis has been successfully used in Marketing (Liu, 2012) and may be used to improve the relationship between brands and consumers as it works as a magnifying lens into feelings, and attitudes expressed by consumers online
8 (Prabowo & Thelwall, 2009). Some authors reveal the influence of social media on
companies and tourism, at a time when these businesses are losing control over what is being written on social networks, resulting in unexpected consequences, mainly online negative comments (Calheiros, Moro, & Rita, 2017; Dwivedi, Shibu, & Venkatesh, 2007; Thevenot, 2007; Zeng & Gerritsen, 2014). If managers are able to successfully reply to consumers’ comments, they may be able to convert unsatisfied consumers into loyal ones (Pantelidis, 2010). The current paper shows how to develop a decision support system (DSS) that allows for proactive decisions using such information.
2.4. Decision Support System
A Decision Support System (DSS) is a computerized system that contains knowledge of a specific domain and analytical decision models to assist the decision maker. It presents information that can be explored from various perspectives (Wang, 1997). Inevitably, when designing a DSS, one looks to convert data into information and then into knowledge (Setzer, 2015). In the tourism industry there is no lack of market research data; instead, there is actually a fairly uncontrolled growth of several data sources. There are surveys on tourism from national and international market research institutes that are published at increasingly shorter intervals and the level of discrimination of market data increases rapidly (Wöber, 2003). In the tourism industry, several DSS have been previously developed, such as a systems to support marketing decisions in national tourism organizations (Mazanec, 1986; Rita & Moutinho, 1994), travel counseling systems for transport staff (Hruschka & Mazanec, 1990), regional planning support systems for the ideal selection of sites to invest (Calantone & Benedetto, 1991; Walker, Greiner, McDonald, & Lyne, 1998) and systems that provide tourism portfolio analysis (Mazanec, 1994; Wöber, 1998).
This article presents a data-driven DSS to allow managers to analyze online reviews for patterns and display them around various different perspectives and levels of analysis. The
9 decision support system presented in the current paper is grounded on previous literature, but details the extraction, transformation and loading (ETL) procedure to deal with unstructured data and classify latent topics and sentiments from recommendation systems. It then assists managers to design their own systems by proposing a new dimensional model approach based on Kimball and Ross’s (2002) methodology. Such model may be used to accommodate data from multiple sources for later analysis on a dashboard front-end such as Qlikview (Qlikview, 2017). A set of dashboards for data analysis are also presented so that managers may drill-up/drill-down the dimensional model in search for opportunities and weaknesses in the market.
3. METHODOLOGY
CRISP-DM methodology for data mining projects was used since it is considered a standard methodology applied to the extraction of knowledge from big datasets (Sharda et al., 2017).
The methodology has 6 stages such as business understanding, data understanding, data preparation, modeling, evaluation and deployment (Chapman et al., 2000).
3.1. Business Understanding
Yelp is a website/application which acts as an urban electronic city guide to help users find places of leisure such as restaurants, shopping, relaxing, playing, movie theaters, museums, art in general, night time entertainment, among others, based on customers’ opinions who cooperate with this application/website. Yelp was founded in 2004 in San Francisco, California, and was selected due to the growing number of businesses relying on its
information as a recommendation system. Most restaurants in the US are represented in Yelp (78%) while 42% of hotel and travel firms hold a presence in this platform (Statista, 2017). Users rely on Yelp not only to search for information about restaurants and hotels when they have to decide what service to choose when they travel abroad, but also to share their
10 experiences online. For the purposes of this study, a dataset provided by Yelp was collected containing information about users, reviews, and businesses registered there. Customers' opinions were explored using TM and SA to create a decision support system to help develop tourism in cities, identifying what tourists value more and less in those cities.
3.2. Data Understanding
A random sample of 12,371 validated reviews from 2005 to 2012 were extracted from a dataset of Yelp reviews (Yelp, 2014). The sample included reviews from 4615 different businesses in 51 cities classified in 22 business categories (Active Life, Arts &
Entertainment, Automotive, Beauty & Spas, Education, Event Planning &Service, Health & Medical, Home Services, Hotel & Travel, Local Flavor, Local Services, Mass Media, Night Life, Pets, Professional Services, Public Services & Government, Real Estate, Religious Organizations, Restaurant, Shopping).
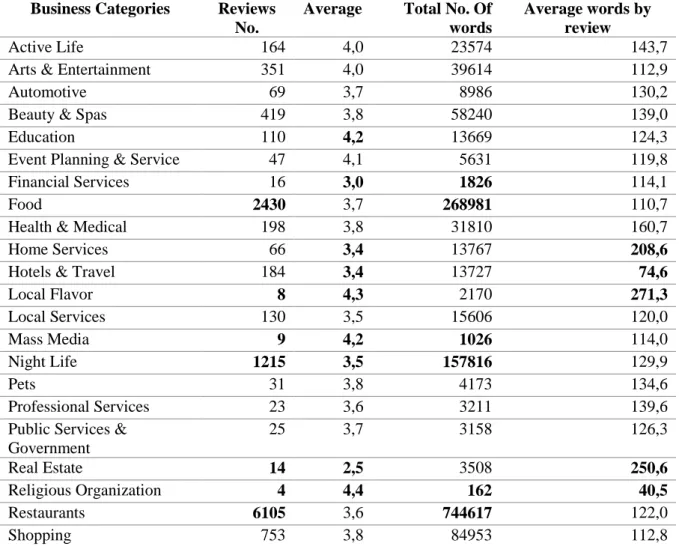
In order to begin structuring the data, an exploratory analysis was performed on the sample. Table 1 shows the total number of reviews and the average rating of reviews by category, the total number of words per category, and finally the average number of words per review.
[TABLE 1 AROUND HERE]
The business categories with the highest number reviews were restaurant (6,105), food (2,430) and night life (1,215), whereas those with less number of opinions were real estate category (14), mass media (9), local flavor (8), and religious organizations (4), which indicated a higher concern of users for food and restaurant issues than those related to site characteristics. The business categories with the lowest average rating were home services (3,4), hotels & travel (3,4), financial services (3.0), real estate (2.5), while best average ratings were experiences related to religious organizations (4.4), local flavors (4.3), education (4.2), and mass media (4.2). Moreover, business categories in which customers used a higher
11 number of words were local flavor (271.3), real estate (250.6) and home services (208.6), with the former having both best average evaluations and the highest average number of words, and the latter having the worst average evaluation by category.
3.3. Data Preparation
Data was prepared using R, an open source programming language and software environment for statistical computing and graphics. Words were extracted into unigrams (individual terms with three or more characters) and bigrams (a sequence of two adjacent terms). Numbers were removed, since for the desired analysis the numbers would not change the results. This is a current practice in this type of analysis (Amado et al., 2018; Feinerer, Hornik, & Meyer, 2008; Guerreiro, Rita, & Trigueiros, 2016). An elimination of punctuation was performed. Such transformation eliminated all punctuation marks, braces, quotation marks, asterisks, among others, since, for the intended analysis, punctuation did not change the results
(Feinerer, Hornik, & Meyer, 2008). Stopwords were removed using commonly used methods (Feinerer, Hornik, & Meyer, 2008; Guerreiro, Rita, & Trigueiros, 2016; Liu, 2008; Moro et al., 2017b). Stemming was also performed to allow words to be transformed into their radical according to Porter model (1980). Finally, term frequency-inverse document frequency was used as a weighting factor (Grün & Hornik, 2011).
A DTM matrix was built consisting of 12,377 documents crossed with 29,894 terms. Figures 1 and 2 show the code used in R and the words in DTM matrix that occur at least 1000 times for unigrams and 100 times for bigrams. These thresholds were selected by observing and analyzing the most frequent words.
[FIGURE 1 AROUND HERE]
12 For a clearer, simpler and more insightful view of the word frequencies highlighted
previously, two wordclouds are presented in figure 3 showing a representation of the words and their frequencies in which word size increased with the number of times the word appeared in reviews.
[FIGURE 3 AROUND HERE]
3.4. Modeling and Evaluation 3.4.1. Analysis of Latent Topics
After analyzing the individual terms found in each review, these terms were segmented into latent topics. While Yelp defines topics across business categories, these categories are imposed by management, and are not the concerns and topics customers are discussing about their experience. It was therefore strictly necessary to find latent topics to be able to
distinguish the themes within reviews, through a Bayesian contextual analysis algorithm known as Correlated Topic Models (CTM) (Blei & Lafferty, 2007). Individual terms were selected through part-of-speech (POS) tagging of substantive terms (nouns-singular, or singular), in order to facilitate the categorization of the topics and to include only relevant terms for the analysis (Cambria, Schuller, Xia, & Havasi, 2013; Feinerer, Hornik, & Meyer, 2008; Kasper & Vela, 2011; Liu, 2012). Since CTM does not provide the exact number of clusters that should be considered valid, the perplexity of the model was calculated (Blei & Lafferty, 2007). Figure 4 presents the results of perplexity for 5 to 60 possible topics.
[FIGURE 4 AROUND HERE]
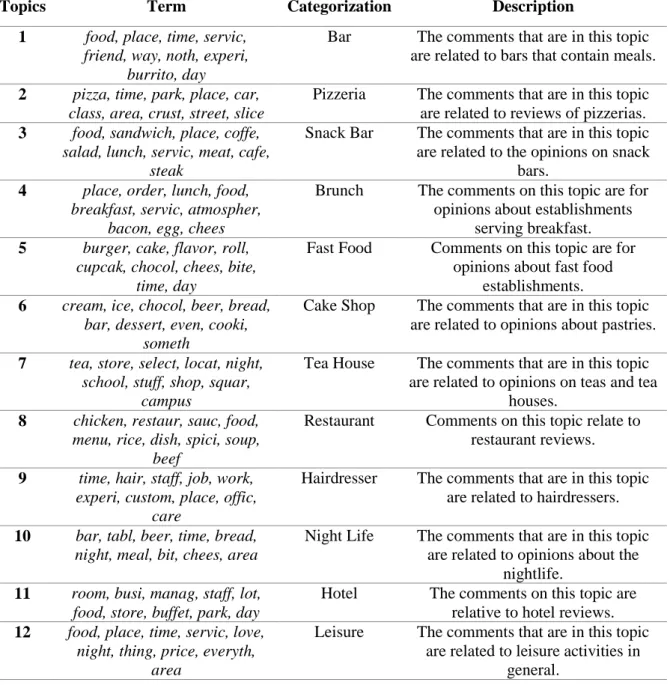
When observing the perplexity metric in figure 4, it can be verified that the ideal number of topics was 15. However, profiling revealed that 12 latent topics would be more appropriate to explain the latent groups of words. Hence, a topic model was created based on 12 clusters. Table 2 presents topics found using CTM.
13 [TABLE 2 AROUND HERE]
The terms presented in table 2 were the 10 most correlated terms with each of the twelve topics, sorted from the most correlated to the least correlated with the topic. For example, in topic 1, the term food was the most correlated, whereas the term day was the least correlated with the topic.
3.4.2. Sentiment Analysis
After categorizing the topics, Semantria was used to classify phrase polarity and sentiment strength. Semantria is a Lexanalytics software and has been successfully used in extracting knowledge from unstructured data (Gao, Hao, & Fu 2015). The software analyzes sentiments automatically using a lexicon-based approach. The sentiment analysis is performed at a document level, sentence level and term level. Each review, sentence and term has a polarity (positive, neutral and negative) and a sentimental score ranging in a logarithmic scale. Using Semantria, the latent topics previously found were also classified as groups of terms
(categories) into polarity and score. The 12,371 reviews revealed a set of 83,037 different sentiments that were used in the DSS to explore patterns of behavior in different perspectives.
3.4.3. Decision Support System - Data Model
Two dimensional models were created for developing a DSS that could help decision-makers to identify factors with positive or negative influence on customer satisfaction. The first model was focused on the 12 latent topics previously created with the CTM approach. The second model focused on the unigrams and bigrams identified previously. The choice of two dimensional models instead of one was justified by the comprehensiveness and
complementarity of the results and the different granularities in both perspectives. The two dimensional models were created following Kimball methodology (Kimball & Ross, 2002). In both models there was a transactional fact table: (1) TF_TR_Category_Sentiment recorded the sentiments of the latent topics for each review; (2) TF_TR_Term_Sentiment recorded all
14 term sentiments that were identified for each review. In both fact tables, the metrics were of an addictive nature, meaning that it is possible to aggregate them around all perspectives. Figures 5 and 6 show the implemented dimensional models.
[FIGURE 5 AROUND HERE] [FIGURE 6 AROUND HERE]
Figure 7 shows a flowchart of the whole procedure, from data extraction to the decision support system.
Although the dimensional model presented in the current paper reads data from Yelp’s dataset, it is designed to accommodate any other source of data, such as reviews from Booking or TripAdvisor. The extraction, transformation and loading (ETL) procedures may be replicated for any other recommendation platforms and be added to the dataset using the presented data model. Such inclusion guarantees that data from multiple sources is able to be analyzed using the DSS.
[FIGURE 7 AROUND HERE]
3.5. Deployment
The deployment stage is where the decision support system dashboards are presented, showing how useful the current DSS may be for the tourism industry. The current analysis is only partially used to show how tourism managers may develop and identify which factors may affect satisfaction on consumers experiences. The dashboards presented in the current paper were developed using Qlikview software (Qlikview, 2017). On both dashboards, managers are able to drill down from year to month, as well as from state to city. The first dashboard is entitled “Category Management Dashboard” and allows managers to understand how sentiments are different between reviews, countries, types of businesses and latent
15 topics. The second dashboard, entitled “Term Management Dashboard”, allows managers to check differences in sentiments between reviews, countries, and types of businesses.
[FIGURE 8 AROUND HERE]
Figure 8 shows the category management dashboard designed with nine graphics. "Percentage of Reviews” and “Quantity of Reviews” allow managers to visualize the
percentage and total number of reviews in the sample and drill down the date hierarchy from year to month and the region hierarchy from state to city. In the current illustrative figure, one can see which state/city has the greatest influence on social media, that is, which has the largest number and percentage of reviews. For example, CA (California) is the state with the highest number of reviews (4,026). In the "Percentage of Reviews per Category" graph, one can see that categories such as Snack Bar (17.52%), Bar (14.13%) and Restaurant
(14.13%) have the highest percentage of reviews, while Pizzeria and Fast Food are the ones with the lowest percentage, which suggests that these categories are not so discussed by tourists in social media platforms. The graph "Quantity of Reviews by Polarity" shows that from all opinions in the sample, 6,132 are positive, 2,853 are neutral and 1,400 have a negative tone. Such graphic may help managers to check the balance between opinion polarities. The graph "Sentiment Score by Category" shows that Snack Bar, Bar and Restaurant have the highest sentiment score while Pizzeria is the topic with a lower sentiment score. Results may assist managers to explore the reviews and study some useful patterns. For example, the illustrative figure suggests that the topic pizzeria is not so
discussed in reviews but when consumers express their opinion about it usually is not a very positive one. The “Sentiment Polarity by Category" allows managers to have a global view of all categories as well as their polarity. Furthermore, the graph "Percentage of Positive
Sentiments by Category" shows that all categories obtained positive reviews. However, categories with the highest relation between positive sentiments versus other sentiment
16 polarities are Snack Bar, Bar, Restaurant and Brunch. The "Average Ratings by
Category", shows the highest and lowest mean ratings observed, and finally the "Distribution by Category" chart shows that more than half scored positively (at least 3 stars). To sum up, one can conclude that tourists enjoy good satisfaction scores mainly when discussing topics such as Snack Bar and Restaurant.
[FIGURE 9 AROUND HERE]
Figure 9 shows the “Term Management Dashboard” which contains eleven different graphics. The graph "Percentage of Reviews" allows managers to explore the percentage of reviews drilling down from year to month. The "Quantity of Reviews" chart also allows to drill down from state to city. In this analysis, one can see which state or city is commonly more discussed in reviews. For example, CA (California) is the state that has the highest number of reviews (3,943). The "Number of Different Terms" graph shows that both Texas and California are the states that contain the largest number of different terms discussed in reviews (89). The "Term polarity” graph shows that 89 terms have neutral polarity, 89 show positive polarity, while 87 terms have a negative tone.
The graphs "Term Frequency" and "Percentage of reviews by term" show that the most frequent words with the highest percentage in the sample are place (2196 times and 7.28%), and food (1842 Times and 8.11%). These results are due to the fact that most of the
comments from the sample are related to the Snack Bar, Restaurant, Bar and Brunch topics. The graph "Sentiment Polarity by Term" shows the top polarities per term. The graph Percentage of “Positive Sentiments by Term" shows a ratio of positive terms versus other polarities in the reviews. There is one term with the percentage of 100%, Restaurant, since all occurrences of this term have a positive tone. Finally, in the graph "Sentiment Score by Term" one finds that three were identified as having a higher score, namely: place (1285.6), food (968, 0) and love (797.2).
17 Although the graphics presented in the paper reflect a given analysis, they may be used to drill-up/drill-down on every dimension of the model shown on figure 5 and 6. For example, if managers would like to drill-down on the type of business (e.g. Restaurants), they may be able to click on the pie chart of the graphic entitled "Percentage of Reviews per Category" and all the other graphics filter the selected criteria. The same happens if managers want to compare suppliers. Due to the attribute on DIM_BUSINESS entitled Business_Name, managers can select the name of the supplier using for example a combo-box and all the remaining graphics only show the information regarding each supplier individually for comparison purposes.
4. DISCUSSION AND CONCLUSION
The current paper is focused on the development of a decision support system to assist tourism managers in improving their offer aligned with consumer’s explicit online behavior.
The findings represent only a sample of all the possible analysis that may be conducted using the dimensional model presented in Figure 5 and 6. However, the analysis performed here shows that overall most reviews have a positive tone, which agrees with the previous
literature on e-WOM (Xiang, 2017). Words like food and place are some of the most positive in the study, showing that consumers in the current analysis take location as a very important driver of satisfaction. Indeed, such issue is often referred in the literature as a critical success factor to influence customer experience (Wang & Hung, 2015). However, a drill-down to individual suppliers or categories may show conflicting results due to the particularities of each supplier, which allows managers to understand the different perspectives leading to the overall market trend.
18 The paper provides important contributions to the literature by presenting an ETL procedure that may be replicated to structure text using transparent and readily available algorithms and a new dimensional model that may accommodate data from multiple sources. The study uses sentiment analysis and text mining techniques to extract unstructured information. Results were obtained using R for cleaning, transforming and structure data and to carry out descriptive statistics. Sentiment analysis was performed using Semantria to classify the polarity and sentiment score of each comment, term and latent topics. Two dimensional models were developed to allow managers to explore sentiment markers using multiple different perspectives such as date, region or type of business reviewed. The current DSS helps managers to align their offer and set strategies about which business to invest in the future in each city and how to better manage their own online reputation. Although
companies that wish to develop such systems may need to reinforce their marketing teams with new business intelligence skills, we believe that in todays' market it is important for companies to develop their own metrics and customized analysis to gain not only competitive advantages but also a better and pro-active understanding of the emerging opportunities.
There are some limitations in this study such as being focused on only one platform of reviews. Such a DSS might use multiple sources to increase insight value. Although this paper allows for other sources to be included in the dimensional model, future research might show how other online platforms such as TripAdvisor or Zomato may be treated so that they may adhere to the standard model presented here. Such integrated view might give tourism managers an important competitive advantage due to their ability to set up innovative offers that the market lacks but consumers wish for.
19
REFERENCES
Akehurst, G. (2009). User generated content: The use of blogs for tourism organisations and tourism consumers. Service Business, 3(1): 51–61.
Amado, A.; Cortez, P.; Rita, P.; Moro, S. (2018). Research trends on Big Data in Marketing: a text mining and topic modeling based literature analysis. European Research on
Management and Business Economics, 24(1): 1-7.
Amaral, F., Tiago, T., and Tiago, F. (2014). User-generated content : tourists ’ profiles on TripAdvisor. International Journal of Strategic Innovative Marketing, 1(3): 137-145.
Anderson, E. W. (1998). Customer Satisfaction and Word of Mouth. Journal of Service
Research, 1(1): 5–17.
Ayeh, J. K., Leung, D., Au, N., and Law, R. (2012). Perceptions and strategies of hospitality and tourism practitioners on social media: An exploratory study. Paper presented at Information and Communication Technologies in Tourism 2012: Proceedings of the International Conference in Helsingborg, Sweden, January 25–27, 2012 (pp. 1–12).
Bai, X. (2011). Predicting consumer sentiments from online text. Decision Support Systems, 50(4): 732–742.
Berezina, K., Bilgihan, A., Cobanoglu, C., & Okumus, F. (2016). Understanding satisfied and dissatisfied hotel customers: text mining of online hotel reviews. Journal of Hospitality
Marketing & Management, 25(1), 1-24.
20
Blei, D. M., and Lafferty, J. D. (2007). A correlated topic model of Science. The Annals of
Applied Statistics, 1(1): 17–35.
Blei, D. M. and Lafferty, J. D. (2009). Topic models. In A. N. Srivastava and M. Sahami (Eds.), Text mining: classification, clustering, and applications, (pp. 71-94). Boca Raton: CRC Press.
Calantone, R. J., and Benedetto, C. A. (1991). Knowledge Acquisition. Annals of Tourism
Research, 18: 202–212.
Calheiros, C., Moro, S., and Rita, P. (2017). Sentiment classification of consumer-generated online reviews using topic modelling. Journal of Hospitality Marketing and
Management. 1-19.
Cambria, E., Schuller, B., Xia, Y., and Havasi, C. (2013). New avenues in opinion mining and sentiment analysis. IEEE Intelligent Systems, 15–21.
Chapman, P., Clinton, J., Kerber, R., Khabaza, T., Reinartz, T., Shearer, C., and Wirth, R. (2000). Crisp-Dm 1.0. CRISP-DM Consortium, 76.
Chatterjee, P., and Wang, Y. (2012). Online Comparison Shopping Behavior of Travel Consumers. Journal of Quality Assurance in Hospitality and Tourism, 13(1): 1–23.
Chevalier, J. a, and Mayzlin, D. (2006). The Effect of Word of Mouth on Sales: Online Book Reviews. Journal of Marketing Research, 43(3): 345–354.
Cooper, C., and Hall, C. M. (2008). Contemporary tourism an international approach. Taylor & Francis.
21
Darbellay, F., and Stock, M. (2012). Tourism as complex interdisciplinary research object.
Annals of Tourism Research, 39(1): 441–458.
Daugherty, T. (2008). Exploring Consumer Motivations for Creating User-Generated Content. Journal of Interactive Advertising, 8(2): 1–24
Dellarocas, C. (2003). The Digitization of Word of Mouth: Promise and Challenges of Online Feedback Mechanisms. Management Science, 49(10): 1407–1424.
Duan, W., Gu, B., and Whinston, A. B. (2008). Do online reviews matter? - An empirical investigation of panel data. Decision Support Systems, 45(4): 1007–1016.
Dwivedi, M., Shibu, T. P., and Venkatesh, U. (2007). Social software practices on the Internet: Implications for the hotel industry. International journal of contémporary
hospitality management, 19(5): 415-426.
Feinerer, I., Hornik, K., and Meyer, D. (2008). Text Mining Infrastructure in R. Journal Of
Statistical Software, 25(5): 1–54.
Gao, Shanshan, Jinxing Hao, and Yu Fu. (2015). The Application and Comparison of Web Services for Sentiment Analysis in Tourism. Paper presented in 12th International
Conference on Service Systems and Service Management (ICSSSM), 1–6.
Goldenberg, J., Libai, B., and Muller, E. (2001). A Complex Systems Look at the Talk of the Network : Process of Word-of-Mouth Underlying. Marketing Letters, 12(3): 211–223.
Grün, B., and Hornik, K. (2011). Topicmodels : An R Package for Fitting Topic Models.
22
Guerreiro, J., Rita, P., and Trigueiros, D. (2016). A text mining-based review of cause-related marketing literature. Journal of Business Ethics, 139(1): 111-128.
Hruschka, H., and Mazanec, J. (1990). Computer-assisted travel counseling. Annals of
Tourism Research, 17(2): 208-227.
Indurkhya, N., and Damerau, F. J. (2010). Handbook of Natural Language Processing,
Second Edition. CRC Press.
Kasper, W., and Vela, M. (2011). Sentiment analysis for hotel reviews. Paper presented at
the Computational Linguistics-Applications Conference, 45–52.
Kimball, R., & Ross, M. (2002). The data warehouse toolkit: the complete guide to
dimensional modelling. John Wiley and Sons, Inc: New York.
Kimball, R., and Ross, M. (2013). The Data Warehouse Toolkit: The Definitive Guide to
Dimensional Modeling, 3rd Edition. John Wiley and Sons, Inc.
Kontopoulos, E., Berberidis, C., Dergiades, T., and Bassiliades, N. (2013). Ontology-based sentiment analysis of twitter posts. Expert Systems with Applications, 40(10): 4065– 4074.
Liu, B. (2008). Web Data Mining: Exploring Hyperlinks, Contents, and Usage Data, 2nd ed. Springer Berlin Heidelberg New York.
Liu, B. (2012). Sentiment Analysis and Opinion Mining. Synthesis Lectures on Human
Language Technologies, 5(1): 1–167.
23 Mazanec, J. A. (1986). Allocating an advertising budget to international travel
markets. Annals of Tourism Research, 13(4): 609-634.
Mazanec, J. A. (1994). International tourism marketing-adapting the growth share matrix. Marketing in Europe, Case Studies. Sage Publications: London.
Moro, S., Rita, P., and Coelho, J. (2017a). Stripping customers' feedback on hotels through data mining: The case of Las Vegas Strip. Tourism Management Perspectives, 23: 41-52.
Moro, S., Rita, P., Cortez, P. (2017b). A text mining approach to analysing Annals literature.
Annals of Tourism Research, 66: 208-210.
Mostafa, M. M. (2013). More than words: Social networks’ text mining for consumer brand sentiments. Expert Systems with Applications, 40(10): 4241–4251.
O’Connor, P. (2010). Managing a Hotel’s Image on TripAdvisor. Journal of Hospitality
Marketing and Management, 19(7): 754–772.
Paltoglou, G., and Thelwall, M. (2012). Twitter, MySpace, Digg: Unsupervised sentiment analysis in social media. ACM Transactions on Intelligent Systems and Technology, 3(4): 66.
Pan, B., MacLaurin, T., and Crotts, J. C. (2007). Travel Blogs and the Implications for Destination Marketing. Journal of Travel Research, 46: 35–45.
Pande, V., and Khandelwal, A. (2014). A Survey of Different Text Mining Techniques.
IBMRD’s Journal of Management and Research, (1): 125–133.
24
Restaurant Comments. Cornell Hospitality Quarterly, 51(4): 483–491.
Park, D.-H., Lee, J., and Han, I. (2007). The Effect of On-Line Consumer Reviews on Consumer Purchasing Intention: The Moderating Role of Involvement. International
Journal of Electronic Commerce, 11(4): 125–148.
Porter, M. F. (1980). An algorithm for suffix stripping. Program, 14(3): 130–137.
Prabowo, R., and Thelwall, M. (2009). Sentiment analysis: A combined approach. Journal of
Informetrics, 3(2): 143–157.
Provost, F., and Fawcett, T. (2013). Data Science for Business: What you need to know about
data mining and data-analytic thinking. O'Reilly Media, Inc..
Qlikview (2017). Qlikview, Retrieved from http://qlikview.com
ReviewPro (2017). Review Pro, Retrieved from https://www.reviewpro.com/
Rita, P., and Moutinho, L. (1994). An expert system for national tourist offices. Annals of
Tourism Research, 21(1): 143-145.
Schmallegger, D., and Carson, D. (2008). Blogs in tourism: Changing approaches to information exchange. Journal of Vacation Marketing, 14(2): 99–110.
Setzer, V. W. (2015). Dado, Informação, Conhecimento e Competência. Instituto de
Matemática E Estatística Da Universidade de São Paulo, 1–14.
Sharda, R., Delen, D., and Turban, E. (2017). Business Intelligence, Analytics and Data
25
Statista. (2017). Retrieved from: https://www.statista.com/statistics/263251/most-popular-activities-us-users-search-yelp-for/.
Stokes, D., and Lomax, W. (2002). Taking Control of Word-of-Mouth Marketing: The Case of an Entrepreneurial Hotelier. Journal of Small Business and Enterprise Development, 9(4): 349–357.
Sumathy, K., and Chidambaram, M. (2013). Text Mining: Concepts, Applications, Tools and Issues–An Overview. International Journal of Computer Applications, 80(4), 29–32.
Tan, A. (1999). Text Mining : The state of the art and the challenges Concept-based. Paper
presented in Proceedings of the PAKDD 1999 Workshop on Knowledge Discovery from Advanced Databases, 8: 65–70.
Thevenot, G. (2007). Blogging as a social media. Tourism and Hospitality Research, 7(3-4): 287–289.
Walker, P. A., Greiner, R., McDonald, D., and Lyne, V. (1998). The Tourism Futures
Simulator: A systems thinking approach. Environmental Modelling and Software, 14(1): 59–67.
Wang, H. (1997). Intelligent agent-assisted decision support systems: Integration of
knowledge discovery, knowledge analysis, and group decision support. Expert Systems
with Applications, 12(3): 323–335.
Wang, S., Hung, K. (2015). Customer perceptions of critical success factors for guest houses.
26
Wöber, K. W. (1998). TourMIS: An adaptive distributed marketing information system for strategic decision support in national, regional, or city tourist offices. Pacific Tourism
Review, 2: 273-286.
Wöber, K. W. (2003). Information supply in tourism management by marketing decision support systems. Tourism Management, 24(3): 241–255.
Xiang, Z., and Gretzel, U. (2010). Role of social media in online travel information search.
Tourism Management, 31(2): 179–188.
Xiang, Z., Qianzhou, D., Yufeng, M., Weiguo, F. (2017). A comparative analysis of major online review platforms: Implications for social media analytics in hospitality and tourism. Tourism Management, 58(2017), 51-65.
Xu, J. B. (2010). Perceptions of tourism products. Tourism Management, 31(5): 607–610.
Ye, Q., Law, R., Gu, B., and Chen, W. (2011). The influence of user-generated content on traveler behavior: An empirical investigation on the effects of e-word-of-mouth to hotel online bookings Computers in Human Behavior, 27(2): 634–639.
Yelp (2014). Yelp, Retrived from http://www.yelp.com
Zeng, B., and Gerritsen, R. (2014). What do we know about social media in tourism? A review. Tourism Management Perspectives, 10: 27-36.
Zhu, F., and Zhang, X. (2006). The Influence of Online Consumer Reviews on the Demand for Experience Goods: The Case of Video Games. Paper presented at International
27
TABLES AND FIGURES
Business Categories Reviews No.
Average Total No. Of words
Average words by review
Active Life 164 4,0 23574 143,7
Arts & Entertainment 351 4,0 39614 112,9
Automotive 69 3,7 8986 130,2
Beauty & Spas 419 3,8 58240 139,0
Education 110 4,2 13669 124,3
Event Planning & Service 47 4,1 5631 119,8
Financial Services 16 3,0 1826 114,1
Food 2430 3,7 268981 110,7
Health & Medical 198 3,8 31810 160,7
Home Services 66 3,4 13767 208,6
Hotels & Travel 184 3,4 13727 74,6
Local Flavor 8 4,3 2170 271,3 Local Services 130 3,5 15606 120,0 Mass Media 9 4,2 1026 114,0 Night Life 1215 3,5 157816 129,9 Pets 31 3,8 4173 134,6 Professional Services 23 3,6 3211 139,6
Public Services & Government 25 3,7 3158 126,3 Real Estate 14 2,5 3508 250,6 Religious Organization 4 4,4 162 40,5 Restaurants 6105 3,6 744617 122,0 Shopping 753 3,8 84953 112,8
28 Topics Term Categorization Description
1 food, place, time, servic, friend, way, noth, experi,
burrito, day
Bar The comments that are in this topic are related to bars that contain meals. 2 pizza, time, park, place, car,
class, area, crust, street, slice
Pizzeria The comments that are in this topic are related to reviews of pizzerias. 3 food, sandwich, place, coffe,
salad, lunch, servic, meat, cafe, steak
Snack Bar The comments that are in this topic are related to the opinions on snack
bars. 4 place, order, lunch, food,
breakfast, servic, atmospher, bacon, egg, chees
Brunch The comments on this topic are for opinions about establishments
serving breakfast. 5 burger, cake, flavor, roll,
cupcak, chocol, chees, bite, time, day
Fast Food Comments on this topic are for opinions about fast food
establishments. 6 cream, ice, chocol, beer, bread,
bar, dessert, even, cooki, someth
Cake Shop The comments that are in this topic are related to opinions about pastries. 7 tea, store, select, locat, night,
school, stuff, shop, squar, campus
Tea House The comments that are in this topic are related to opinions on teas and tea
houses. 8 chicken, restaur, sauc, food,
menu, rice, dish, spici, soup, beef
Restaurant Comments on this topic relate to restaurant reviews. 9 time, hair, staff, job, work,
experi, custom, place, offic, care
Hairdresser The comments that are in this topic are related to hairdressers. 10 bar, tabl, beer, time, bread,
night, meal, bit, chees, area
Night Life The comments that are in this topic are related to opinions about the
nightlife. 11 room, busi, manag, staff, lot,
food, store, buffet, park, day
Hotel The comments on this topic are relative to hotel reviews. 12 food, place, time, servic, love,
night, thing, price, everyth, area
Leisure The comments that are in this topic are related to leisure activities in
general.
29
30
31
A) B)
32
33
34
35
36
37