ISSN 1516-635X Jul - Sept 2014 / v.16 / n.3 / 233-240
http://dx.doi.org/10.1590/1516-635x1603233-240
Feed Mill in the Brazilian Cerrado
Author(s)
Rodrigues SIFCI,II Stringhini JHIII Ribeiro AMLIV Pontalti GCIV McManus CMI,IV
I Faculdade de Agronomia e Veterinária, Universidade de Brasília, Brasilia, DF, Brazil sandra.rodrigues@kemin.com;
II Kemin South America, Rua Ettore Soliani, 471 Distrito Ind. Nova Era, Indaiatuba, SP, 13.347- 394, Brazil;
III Department of Animal Production, Vete-rinary School, Federal University of Goiás, Goiânia, Brazil henrique@vet.ufg.br and IV Department of Animal Production,
Uni-versidade Federal do Rio Grande do Sul, Av. Bento Gonçalves, 7712, Porto Alegre, 91.540-000, Brazil concepta.mcmanus@ ufrgs.br
Mail Address
Corresponding author e-mail address: Faculdade de Agronomia e Veterinária,
Universidade de Brasília, Brasilia, DF, Brazil E-mail: sandra.rodrigues@kemin.com
Keywords
Chemical composition, grain damage, corn density, nutritional value, physical traits.
Submitted: September/2013 Approved: July/2014
ABSTRACT
This study aimed at investigating factors that contribute to changes in the quality of corn used in compound poultry feeds. Samples were collected from 6488 bulk cargos received at a feed mill located close to Brasília, Brazil. The parameters studied were divided into two groups: those related to corn chemical composition, including crude protein (% CP), ether extract (% EE), crude fiber (% CF), nitrogen-free extract (% NFE), and estimated metabolizable energy (ME), and corn physical characteristics, including density, moisture, and grain physical damage. High coefficients of determination (R2) and low coefficients of variation
(CV) were determined for the chemical and physical parameters. The analysis of variance showed low to medium R2. Month, year, supplier,
and their interactions influenced (p <0.05) all chemical properties, as well as density, moisture, and ME. Physical characteristics were less affected by those factors, except for quantity of damaged grains. The principal component analysis separated the physical and chemical factors. The coefficients of the first component explained 54% of the total variation between variables. The first principal component showed that NFE and ME increased as humidity decreased. The second component also showed a decrease of physical problems due to reduction in humidity. Results indicate that the feed mills should take preventive measures when selecting suppliers, and diets should be formulated according to the differences in chemical and physical composition of corn supplied in different months and years.
INTRODUCTION
Several factors may affect both feed quality and feed mill feed manufacturing parameters (Loar & Corzo, 2011). The nutritional value of grains for poultry varies as a function of grain cultivar, its chemical characteristics and non-starch polysaccharide content, diet physical
form, and bird category (Gutiérrez-Alamo et al., 2008). Feed mills
usually produce large quantities of feed during a short time frame and reliable values for the nutrient content of feed components are essential for precise diet formulation. Feed costs accounts for the largest share of live production costs (Donohue & Cunningham, 2009) and therefore, any mistake in formulation can negatively affect company profits as well as animal production. For instance, Gutiérrez-Alamo et al. (2008) stated that the increased costs of production have eliminated company profitability of US poultry producers.
for about 65% of metabolizable energy Dalhke et al.
(2001), and about 20% of protein of starter diets (Dale, 1994). Corn occupies the largest cultivated area of all grains in Brazil and it is important for the social-economic development of the country, as it is also exported to other countries as a feedstuff (Barbour et al., 2008). These authors determined that every 100 kg of imported corn grain (not only from Brazil) contains 22.1 kg of other seeds and foreign matter plus broken kernels, whereas the percentage of both materials ranged from 11.2 to 46.9%, suggesting that it should be better monitored, as this could negatively affect Brazilian corn exports.
Corn quality is classified in Brazil as type 1, 2, or 3 according to the presence of impurities, broken, hollow, or moldy grains (Tardin, 1991), and in the USA, the scale ranges between 1 and 5 (Dale 1994 a,b). In feed mills, grains with poor or dubious quality, such as type 3, are often used, which would require the correction of its nutritional levels, but this is rarely the case, resulting in deficiency. Corn grain damage may be very high (Barbour et al., 2008). The main insects that infest stored corn are the weevil (Sitophilus zeamais) and the grain moth (Sitotroga cerealella), according to Stringhini et al. (2000). Lopes et al. (1988), working with 5, 20, 30, 40 and 50% corn grains infested by
Sitophilus zeamais, found grain weight losses of 0, 5, 8, 10 and 13%, respectively, in addition to gross energy losses as infestation levels increased. Rostagno (1993) points out that damaged grains have poorer nutritional value compared with normal grain due to changes in their chemical composition, including reduced bioavailability of some nutrients, the presence of anti-nutritional factors, and the proliferation of fungi, with or without the production of mycotoxins.
The objective of this study was to evaluate the quality of corn batches received at a feed mill that are used for broiler feeds, and the factors that affect its quality, as well as the relationships between corn sample characteristics.
MATERIAL AND METHODS
Corn from the Brazilian states of Mato Grosso, Goiás, Bahia, Tocantins, Distrito Federal, and Minas Gerais Brazil were examined. Corn delivered to the feed mill in the Federal District was sampled directly (6488 samples) from the truck before unloading during a five year period, with an average of 100 samples per month.
Sampling was carried out according to regulations (Brasil, 1976). An average of 30 1-kg samples per 30
tonne truck were pooled, reduced, and divided into four subsamples (each weighing 0.25kg). Subsamples were identified and one sample sent to the classifier, one to the laboratory for chemical analysis and the remaining two were stored for retesting purposes.
Corn chemical composition was analyzed for crude protein (% CP), ether extract (% EE), crude fiber (% CF), nitrogen free extract (% NFE), and metabolizable energy (ME MJ/kg) was estimated. Analyses were carried out according to Silva & Queiroz (2002). ME corrected for nitrogen was calculated using the prediction equation of Janssen (1989), which is based on grain chemical composition: ME = 36.21CP + 85.44EE + 37.26NFE. The difference between maximum and minimum levels, expressed as a percentage of the mean (DIF), was also calculated.
Physical quality was evaluated by separating 0.1kg samples of corn which was then classified according to the Decree n. 845 of 8/11/1976 of the Brazilian Ministry of Agriculture (Brasil, 1976). This classification is based on the percentages of broken (BR), hollow (HOL), insect infested (IF), burnt (BUR), moldy or infested with fungi (MOU), fermented (FER), or damaged (DAM) grains, foreign material, impurities or fragments (MIF), grit (GRI) or damaged for other reasons (DOT). Regular or good corn (REG) was calculated by subtracting of the above fractions from the initial weight of the sample and expressed as a percentage. Density (DEN,
kg/m3) and humidity (HUM,%) were estimated using a
GEHAKA G 800 apparatus.
Analysis of variance was performed using SAS/ STAT ® software (Statistical Analysis System, Cary, NC, USA) after transformation of percentages in arcsine, and included the fixed factors of years, months, and origin (supplier) and their interactions. Complementing the analysis of data, correlations and FACTOR components were calculated to verify the contribution of each variable to the variability of the system. Variables with final communality (KMO) values of less than 0.4 (grit, burnt, foreign matter and damaged) were removed from the factor analysis. Cluster analyses were carried out together with discriminant analyses to define which factors were important to segregate corn samples.
RESULTS
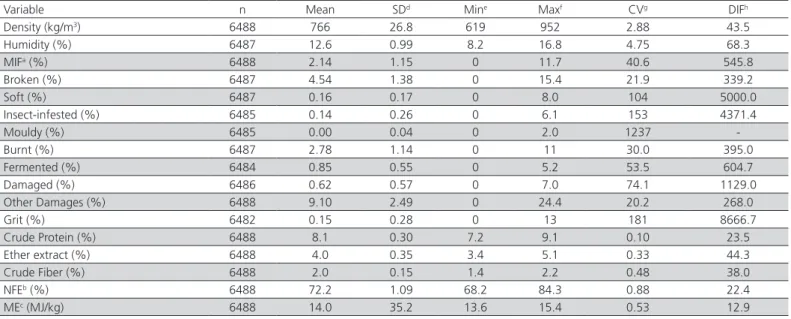
Quality measures (Table 1) shows that the corn received at the feed mill presented 765.7kg/m3 mean
was considered good. In particular, the percentages of soft, insect-infested, grit, moldy, fermented, and damaged corn were below 1% each. Corn contained approximately 8% crude protein, 4% ether extract, and 2% crude fiber. Metabolizable energy was estimated as 14.0 MJ/kg. High coefficients of variation were obtained for several sources of damage, particularly those found at low percentages (mould, insect infested, soft, grit). DIF indicates degree of error, and
the results show that the feed mill could make huge errors when formulating feeds based on mean values compared with actual values as those obtained in the present study.
Month, year and supplier, and their interactions were, in general, highly significant sources of variation for most of the corn characteristics studied (Table 2). The coefficients of determination were lower for the damage sources of damages present at lower
Table 1 – Means, standard deviations, minimum and maximum value obtained, coefficient of variation of corn analyzed.
Variable n Mean SDd Mine Maxf CVg DIFh
Density (kg/m3) 6488 766 26.8 619 952 2.88 43.5
Humidity (%) 6487 12.6 0.99 8.2 16.8 4.75 68.3
MIFa (%) 6488 2.14 1.15 0 11.7 40.6 545.8
Broken (%) 6487 4.54 1.38 0 15.4 21.9 339.2
Soft (%) 6487 0.16 0.17 0 8.0 104 5000.0
Insect-infested (%) 6485 0.14 0.26 0 6.1 153 4371.4
Mouldy (%) 6485 0.00 0.04 0 2.0 1237
-Burnt (%) 6487 2.78 1.14 0 11 30.0 395.0
Fermented (%) 6484 0.85 0.55 0 5.2 53.5 604.7
Damaged (%) 6486 0.62 0.57 0 7.0 74.1 1129.0
Other Damages (%) 6488 9.10 2.49 0 24.4 20.2 268.0
Grit (%) 6482 0.15 0.28 0 13 181 8666.7
Crude Protein (%) 6488 8.1 0.30 7.2 9.1 0.10 23.5
Ether extract (%) 6488 4.0 0.35 3.4 5.1 0.33 44.3
Crude Fiber (%) 6488 2.0 0.15 1.4 2.2 0.48 38.0
NFEb (%) 6488 72.2 1.09 68.2 84.3 0.88 22.4
MEc (MJ/kg) 6488 14.0 35.2 13.6 15.4 0.53 12.9
aMIF = Foreign matter, impurities and fragments; bNFE = nitrogen-free extract = [100-(Hum +CP+CF+EE+MM)]; cME = metabolizable energy (ME = 36.21CP + 85.44EE +
37.26NFE); dSD = Standard deviation; eMín = minimum; fMax = maximum; gCV = Coefficient of variation; n= number of observations; hDIF Difference between maximum and mini-mum levels expressed as a percentage of the mean.
Table 2 – Summary of analysis of variance and coefficients of determination (R2) and variation (CV) for the physical and chemical properties of corn.
Variable R² CV Month Suppd Month
*Suppd
Year Month* Year
Year*Suppd Year*Month *Suppd
Density (kg/m3) 0.36 2.88 *** *** *** *** *** *** ***
Humidity (%) 0.65 4.75 *** *** *** *** *** *** ***
MIFa (%) 0.46 40.59 *** *** *** ** *** *** ***
Broken (%) 0.51 21.94 *** *** *** ** *** *** ***
Soft (%) 0.14 103.56 ns *** ** ns *** * *
Insect damaged(%) 0.33 152.57 *** *** *** ns *** ns ns
Mouldy (%) 0.11 1237.95 ns ns *** ns ns ns ns
Burnt (%) 0.49 30.05 *** *** *** ** *** *** ***
Fermented (%) 0.36 53.55 ns ns ns ns ns ns ns
Damaged (%) 0.38 74.08 ** *** *** * *** *** ***
Other damages (%) 0.48 20.19 *** *** *** *** *** *** ***
Grit (%) 0.14 181.18 * *** *** ns ** ** **
Crude Protein (%) 0.99 0.1 *** *** *** *** *** *** ***
Ether extract (%) 0.99 0.33 *** *** *** *** *** *** ***
Crude Fiber (%) 0.99 0.48 *** *** *** *** *** *** ***
NFEb (%) 0.67 0.88 *** *** *** *** *** *** ***
MEc (MJ/kg) 0.76 0.53 *** *** *** *** *** *** ***
percentages, which also had the highest coefficients of variation. The coefficients of determination (R2)
were high and the coefficient of variation (CV) was low as obtained by analysis of variance of the chemical characteristics of the analyzed samples. The coefficients of determination (R2) were 0.65 for relative humidity
(RH), and 0.99 for crude protein (CP), fiber (CF) and ether extract (EE) contents. The calculated CV was 0.10% for CP and 4.75% for humidity.
The R2 of the physical properties were from low to
intermediate (0.11 for moldy, 0.14 for hollow, and 0.49 for rotten grains), with CV of 74.1% for damaged grains and 1238% for moldy grains. The latter is due to the large number of samples no moldy grains.
Month, year, supplier, and their interactions affected (p <0.05) all chemical properties (CP, CF, EE and NFE), density, moisture and ME. The physical characteristics, except for damaged grain, were less affected by these factors than the chemical composition. The interactions among the main factors, in particular years, were not significant (p> 0.05), except for the month x supplier interaction (p <0.001), which may be attributed to several factors, particularly different soil conditions and climate.
Correlations (Table 3) between the traits were in general intermediate to low, with highest correlation for the percentage of grains damaged by other reasons. Humidity presented high negative correlations with NFE and ME. The observed correlations between density and physical and chemical characteristics were low (<0.2). This indicates that the variation in density does not necessarily indicate variations in the chemical composition. Positive correlations (0.60) were found between density and the proportions of foreign matter + impurities + broken fragments, while the correlation with fermented and burnt grains was lower (0.38), but significant (p <0.001). Broken grain presented low, but significant correlations (p <0.001) with most other physical measures (0.14 to 0.23), except for damaged grain, which was highly correlated (0.75), since it is expressed in part by the total.
The principal factor analysis separated the physical characteristics from the chemical (Figure 1). The first component explained 54% of the variation between the variables, while the second explained 18%. The first component showed that physical problems, such as fermented, moldy and soft grains, generally increased as moisture increased. The second principal component showed that NFE and ME increased as
moisture content decreased. Table 3 –
Pearson corr
elations of physical and chemical variables and estimated metabolizable energy density and grain.
V a r. HUM MIF BRO HOL IF MOU BUR FER DAM DOT GRI CP EE CF NFE ME DEN 0.21*** -0.06*** -0.05*** -0.01ns 0.02ns -0.02ns -0.07*** -0.09*** 0.06*** -0.07*** -0.08*** -0.03** 0.06*** 0.06*** -0.20*** -0.14*** HUM -0.12*** -0.07*** -0.04*** -0.14*** 0.00ns -0.04** -0.06*** 0.08*** -0.07*** -0.06*** -0.08*** -0.13*** 0.01ns -0.86ns -0.85ns MIF 0.60*** 0.15*** -0.05*** -0.04** 0.15*** 0.11*** 0.04*** 0.44*** 0.36*** 0.09*** 0.00ns 0.16*** 0.06*** 0.06*** BRO 0.14*** 0 -0.01ns 0.21*** 0.16*** 0.23*** 0.75*** 0.17*** -0.04** -0.05*** 0.10*** 0.07*** 0.02ns HOL 0.07*** -0.02ns 0.05*** 0.09*** 0.16*** 0.23*** 0.09*** -0.01ns -0.06*** 0.03* 0.06*** 0.00ns IF 0.11*** 0.19*** 0.15*** 0.18*** 0.27*** -0.01ns 0.00ns 0.03* 0.02ns 0.1*** 0.12*** MOU 0.09*** 0.02*ns 0.03* 0.08*** 0.00ns -0.02ns -0.02ns 0.00ns 0.01ns -0.01ns BUR 0.38*** 0.06*** 0.70*** 0.07*** -0.07*** -0.010ns 0.08*** 0.05*** 0.01ns FER 0.05*** 0.52*** 0.09*** -0.08*** 0.000ns 0.09*** 0.06*** 0.03* DAM 0.42*** 0.06*** -0.13*** -0.18*** -0.04** 0.02ns -0.15*** DOT 0.17*** -0.1*** -0.08*** 0.11*** 0.10*** 0.00ns GRI -0.01** -0.04ns -0.02*** 0.07ns 0.03* CP 0.34*** 0.09*** -0.33ns 0.2*** EE -0.15*** -0.28ns 0.6*** CF -0.12ns -0.23*** NFE 0.58*** * p<0.05; ** p<0.01; *** p<0.001; ns=not significant;
CP – crude protein;
EE = ether extr
act;
CF – crude fiber – NFE – nitrogen-free extr
act;
ME= Metabolizable energy;
Brok en (BR), hollow (HOL), insect infested (IF), burnt (BUR),
moldy or attack
ed by fungi (MOU),
fermented (FER),
damaged (DAM),
F
oreign material,
impurities or fr
agments (MIF),
grit (GRI) or damaged for other reasons (DO
T),
regular or good corn (REG),
Density (D
EN
, kg/m3) and humidity
The cluster analysis of the data showed six distinct clusters with approximately 1000 samples each (ranging between 837 and 1166). Discriminant analyses (Figure 2) among the clusters showed that, in general, these groups of samples presented different energy levels,
densities, metabolizable energy, and NFE, as well as humidity and percentages of burnt, damaged, insect-damaged, fermented, and broken grains, along with foreign matter. This reflects the differences among the corn samples delivered in the feed mill and emphasizes
Figure 1 – Component analysis of the characteristics that represent the physical, chemical, density and ME of corn.
aME= Metabolizable Energy = (36.21CP + 85.44EE + 37.26NFE) bNFE=Nitrogen free extract =[100-(Hum+CP+CF+EE+MM)] cMIF Foreign material, impurities or fragments
the need for constant analysis of corn to properly formulate feeds.
DISCUSSION
Mean humidity of the corn was 12.6% (Table 1), which is within the type 1 corn quality range, which upper limit is 14.5%. Dry matter (87.4%) results were also close to those mentioned by Rostagno (2005) and Rostagno (2011), of 87.1 and 87.48%, respectively. However, the obtained humidity values were lower than those obtained by Rodrigues et al. (2001), of 87.86%; however, when the deviations are considered, the average content of dry matter were similar. Barbour
et al. (2008) obtained 14.0% humidity in corn grain imported by Lebanon, including in Brazilian samples, and 8.54, 3.52, 2.09, and 1.51% crude protein, crude fat, crude fiber, and ash, respectively, on dry matter basis. The difference between the highest and lowest moisture, crude protein, crude fat, crude fiber, and ash contents among the 44 corn shipments weighing 5,851 t was 4.20, 2.78, 1.66, 2.55, and 0.51%, respectively. There was also a relatively high percentage of unsound seeds, foreign materials plus broken kernels (Scott et al., 1982).
An average score of 2.14% was obtained for to impurities, foreign matter and debris, meeting the specifications of corn type 3, which minimum and maximum tolerance levels are 2.1 and 3.0%, respectively. Moreover, the average value of 2.8% obtained for burnt grains would meet the specifications for type 1 corn, which upper limit is 3%.
Average total damaged corn percentage, which includes the other physical fractions analyzed, was 9.1%, which would meet the standard specification of type 1 corn , which upper limit is 11%. However, when considering the maximum value of 24.3% obtained for the samples, this corn would be classified as type 3, which minimum and maximum limits are 19 and 27%, respectively.
The mean corn density values described by
Rodrigues et al. (2001) ranged between 724 and 758
kg/m3, which are lower than the 766 kg/m3 obtained
in the present study. However, there was less variation compared with the minimum and maximum values of 619 kg/m3 to 952 kg/m3 found in this study, respectively.
Corn density is influenced by genetic differences among cultivars, as well as other factors, according to Gutiérrez-Alamo et al. (2008). Silva (2006) compared corn with high (805 kg/m3), intermediate (737 kg/m3)
and low (593 kg/m3) density as determined in a gravity
table, and concluded that higher density corn has higher energy value due to its higher starch content.
Average crude protein values ranged from 7.2 to 9.1%, with an average 8.1%, similarly to those reported by Rostagno (2005) and Rostagno (2011), of 8.6 and 7.9%, respectively, but higher than those obtained by Agostini et al. (2004), who obtained 7.3%, which is close to the minimum value obtained in the present study. The CP values reported by Rodrigues et al. (2001) and Freitas et al. (2005) were close (9.3 and 9.8%, respectively) to the maximum values obtained in the present study. Fertilization practices and frequency influences the composition of corn grain, particularly nitrogen content, and consequently its crude protein levels (Lima, 2000).
Ether extract differences were observed, with values ranging between 3.4 and 5.1% (average of 4.0%)
which are higher than those reported by Rostagno et
al. (2005), Freitas et al. (2005), and Rostagno (2011) (3.5, 3.5, and 3.6%, respectively), but lower than that reported by Agostini et al. (2004), of 4.7%.
Crude fiber content ranged between 1.4 and 2.2%, with an average of 2.0%, which was higher than the averages (1.3% and 1.7%) reported by Agostini et al. (2004) and Rostagno (2011), respectively.
The average NFE values ranged from 68.2 to 84.3%, with an average of 72.2%, which are close to the value (72.95%) reported by Rostagno (2011). NFE is a measure of soluble carbohydrates and readily digestible nutrients. The main criticism to this fraction is that it is obtained after other fractions are evaluated. According to Barbarino Junior (2001), NFE is not determined, but calculated, and therefore carries the determination errors of all other fractions.
Significant ME differences were obtained, with values ranging 13.6 and 15.4 MJ/kg (average of 14.0 MJ/kg) which is similar than those reported by Rostagno et al. (2005, 2011) of 14.1 MJ/kg. According to Colnago et al. (1979), Mittelstaedt & Teeter (1993), and McNab (1996), the chemical composition of feedstuffs derived from different regions and cultivars may be significantly different, resulting in different energy values. This indicates that using average values from feedstuff tables may affect the quality of the feeds produced.
must be constantly analyzed to ensure that the quality standards are being met by the suppliers. Corn density and moisture were affected by supplier, month, and year (p <0.05), which means that the same supplier did not always offered the best or worst corn density or moisture, which may affect other corn characteristics. For instance, adverse plant growth conditions, reduced density is associated with reduced starch and energy grain contents (Barbarino Junior, 2001). Krabbe et al. (1995) determined apparent metabolizable energy corrected by nitrogen balance (MEn) values of corn with 12 and 18% humidity. The MEn obtained for corn at 12% moisture content was 0.6MJ/kg higher than the grain stored at 18% moisture, on a dry matter basis. Different results were obtained by Jost et al. (1996), who did not find, for broilers, any MEn differences of corn stored during 60 days at 17.5% moisture, with or without the addition of organic acids. In the present study, year also influenced corn quality, probably due to climate changes and corn cultivars (Loar II & Corzo, 2011).
There was no effect of the month on the percentages soft, moldy, or fermented corn, and there was no effect of year on the same characteristics and on insect-infested corn percentage. Corn humidity is low year round in the regions supplying the corn. This probably affects these traits, inhibits mould growth, and makes it more difficult for insects to damage the corn grain (Yigezu et al., 2010).
The interactions of EE and ME with grain damage variables showed that a higher incidence of damaged and insect-damaged kernels reduced corn lipid and ME contents. The occurrence of insect-damaged grains is related to several factors and it is an indication of grain quality. Such factors include mulching level, insect attack, unbalanced fertilization, disease incidence, delayed harvest, and rainy season at the end of plant cycle (Fancelli & Dourado Neto, 2000), none of which are under the control of the feed mill, further reinforcing the need for grain screening on entering
the mill. According to Souza et al. (2000), insect
infestation initially results in a reduction in nitrogen free extract level, because insects preferably consume the endosperm that it is rich in starch. Subsequently, insects attack the plant in embryo stage, reducing grain crude protein and oil levels.
These results indicate that the feed mills should be careful when selecting suppliers and feeds should be formulated taking into account the chemical and physical differences that occur between months and years.
Both positive and negative correlations among physical characteristics were generally low (<0.2), but significant (p<0.001). Correlations between physical and chemical characteristics were low (<0.2) in general. According Benati (1989), in order to assess feedstuff quality, their physical, chemical, and biological parameters should be determined, and not merely their chemical composition. These authors state that experience and continuous analysis show that the physical evaluation of feestuffs may be used as a predictor of quality, and in some cases, it is better than a chemical analysis.
The correlations of ME were low both with physical and with chemical variables, except for NFE, with an average correlation (0.58). The correlation between density and ME was low (-0.14). Dale (1994) observed that broken grains, which density is low, presented 376 kJ/kg less ME relative to intact grains.
Correlations among chemical characteristics were also generally low (<0.4). The highest correlation was obtained between ME and humidity (-0.85). NFE, density, crude fiber, and ether extract presented low correlations (0.10-0.35). The other evaluated correlations were low and not significant, including that between grain damage and moisture content.
The results of the principal factor analysis differs from those obtained by Barbarino Junior (2001), who found that the drier the grain at the time of harvesting, the greater the possibility of the occurrence of cracks or breaks as grain impacts against the structure of the harvester. The quality of corn depends on several factors, including temperature, moisture, hygroscopic capacity of the grains, the presence of oxygen, changes in the integrity of grain, degree of fungal contamination, presence of insects and rodents, dirt, foreign matter, and hygiene conditions of the storage location. The results showed that changes in the physical properties of corn had little effect on its chemical properties.
CONCLUSIONS
chemical properties among corn suppliers, months, and years. The selection of raw materials suppliers which products are less variable allows more accurate feed formulation.
ACKNOWLEDGEMENTS
The authors thank ASA Alimentos Ltda for supplying the data and FAPDF and INCT Pecuária for their financial support.
REFERENCES
Agostini PD, Gomes PC, Albino LFT, Rostango H.S, Sá LM.Valores de composição química e energética de alguns alimentos para aves. Revista Brasileira de Zootecnia 2004;33:128-34.
Barbarino Junior P. Avaliação da qualidade nutricional do milho pela utilização de técnicas de análise uni e multivariadas [tese]. Viçosa: Universidade Federal de Viçosa; 2001.
Barbour GW, Farran MT, Usayran N, Daghir NJ. Review of poultry production and the physical and chemical characteristics of imported corn and soybean meal in major feed operations in Lebanon. World’s Poultry Science Journal 2008;64:177-86.
Benati M. Critérios para avaliação da qualidade de ingredientes para ração. Anais da Conferência Apinco Ciência e Tecnologia Avícolas; 1989; Campinas, São Paulo. Brasil. Campinas: FCATA; 1989. p.117-37.
Berger L, Singh V. Changes and evolution of corn coproducts for beef cattle. Journal of Animal Science 2010;88:143-50.
Brasil. Ministério da Agricultura. Portaria nº 845, de 8 de novembro de 1976. Brasília, DF; 1976.
Colnago GL, Costa PMA, Fonseca JB, Silva DJ, Rostagno HS. Composição química e energia metabolizável de alguns alimentos para poedeiras. Revista Brasileira Zootecnia 1979;8:654-64.
Dalhke F, Ribeiro AML, Kessler AM, Tamanho da partícula do milho e forma física da ração e seus efeitos sobre o desempenho e rendimento de carcaça de frangos de corte. Revista Brasileira Ciência Avícola 2001;3:241-8.
Dale N. Efeitos da qualidade no valor nutritivo do milho. Anais da Conferência APINCO Ciência e Tecnologia Avícolas; 1984; Santos, São Paulo. Brasil. Campinas: FACTA; 1994a. p.67-72.
Dale N. Matching corn quality and nutritional value. Feed Mix 1994b;2:26-9.
Donohue M, Cunningham DL. Effects of grain and oilseed meals on the cost of US poultry production. Journal of Applied Poultry Research 2009;18:325–37
Fancelli AL, Dourado Neto D. Produção de milho para silagem. In: Fancelli AL, Dourado Neto D. Produção de milho: Guaíba: Agropecuária; 2000. p.299-338.
Freitas ER, Sakomura NK, Neme R, Santos AL. Valor energético do óleo ácido de soja para aves. Pesquisa Agropecuária Brasileira 2005; 40:241-6.
Gutiérrez-Alamo AP, Ayala PPde, Verstegen MWA, Hartog LAD, Villamide MJ. Variability in wheat: Factors affecting its nutritional value. Journal of World’s Poultry Science 2008;64:20–39.
Janssen WMMA. European table of energy values for poultry feedstuffs. 3rded. Beekbergen: Spelderholt Center for Poultry Research and Information Services; 1989. 104p.
Jost HC, Dari RI, Lemos MCI, Kessler AM, Penz Jr, AM. Energia metabolizável de grãos de milho submetidos a diferentes tratamentos com ácidos orgânicos. Anais da Conferência
Apinco Ciência e Tecnologia Avícolas; 1996; Curitiba, Paraná. Brasil. Campinas: FACTA; 1996. p. 24.
Krabbe EL, Juchiem S, Maciel JES, Penz Jr AM, Kessler AM, Efeito das condições de armazenagem de grãos de milho na energia metabolizável aparente para frangos de corte criados com dietas de diferentes qualidades. Anais da Conferência Apinco Ciência e Tecnologia Avícolas; 1995; Campinas, São Paulo. Brasil. Campinas: FACTA; 1995. p.9-10.
Lima GJMM, Singerm J M, Guinoni AL, Andrade AL, Bellaver C. Classificação do milho, quanto a composição em alguns nutrientes através do emprego de análises e conglomerados. Anais do Congresso Nacional de Milho e Sorgo; 2000; Uberlândia, Minas Gerais. Brasil. p.318.
Loar II RE, Corzo A. Effects of feed formulation on feed manufacturing and pellet quality characteristics of poultry diets. World’s Poultry Science Journal 2011;67:19-28.
Lopes DC, Fontes RA, Donzele JL, Alvarenga JC. Perda de peso e mudanças na composição química do milho (Zea mays L.) devido ao carunchamento. Revista Brasileira de Zootecnia 1988;17:367-71.
McNab JM, Factors affecting the energy value of wheat for poultry. Journal of World’s Poultry Science 1996; 52:69-73.
Mittelstaedt C, Teeter, RG. An evaluation of soft and hard red winter wheat for nitrogen-corrected true metabolizable energy, crude protein, and amino acid content. Poultry Science 1993;72:1379-82.
Rodrigues PB, Rostagno HS, Albino LFT, Gomes PC, Barboza WA, Santana RT. Valores energéticos do milheto, do milho e sub-produtos do milho, determinados com frangos de corte e galos adultos. Revista Brasileira Zootecnia 2001; 30:1767-79.
Rostagno HS, Disponibilidade de nutrientes em grãos de má qualidade. Anais da Conferência Apinco Ciência e Tecnologia Avícolas; 1993; Santos, São Paulo. Brasil. Campinas: FACTA; 1993. p.129-39.
Rostagno HS. Tabelas brasileiras para aves e suínos. Composição de alimentos e exigências nutricionais.Viçosa: UFV; 2005. 186p.
Rostagno HS. Tabelas brasileiras para aves e suínos. Composição de alimentos e exigências nutricionais. Viçosa: UFV; 2011. 252p.
Scott ML, Nesheim MC, Young RJ. Nutrition of the chicken. 3rd ed. Ithaca: Amazon; 1982. 562p.
Setiawan S, Widjaja H, Rakphongphairoj V, Jane JI. Effects of Drying Conditions of Corn Kernels and Storage at an Elevated Humidity on Starch Structures and Properties. Journal of Agricultural and Food Chemistry 2010;58:122260-7.
Silva DJ, Queiroz AC. Análises de alimentos: métodos químicos e biológicos. Viçosa: UFV; 2002. 165p.
Silva MAA, Furlan AC, Moreira I. Avaliação nutricional do milho com maior teor de óleo, nas formas de grãos secos e silagens, para suínos nas fases de crescimento e terminação. Revista Brasileira de Zootecnia 2006;35:830-9.
Souza JT, Martins LS, Machado JS, Reis PR, Coutinho WM. Uso do congelamento no controle de ácaros associados a sementes de arroz destinadas ao teste de sanidade. Ciência e Agrotecnologia 2000;24:957-60.
Stringhini JH, Mogyca NS, Andrade MA, Orsine GF, Café MM, Borges SA. Efeito da qualidade do milho no desempenho de frangos de corte. Revista Brasileira de Zootecnia 2000;29:191-8.
Tardin AC. Programa de controle de qualidade para rações produzidas na granja. Anais do Simpósio Técnico de Produção de Ovos; 1991; Campinas, São Paulo. Brasil. p.50-72.