Revista Brasileira de
Engenharia Agrícola e Ambiental
Campina Grande, PB, UAEA/UFCG – http://www.agriambi.com.br
v.20, n.1, p.29–35, 2016
Growth and yield of sugarcane as a function
of phosphorus doses and forms of application
Abel W. de Albuquerque
1, Leopoldo de A. Sá
1, William A. R. Rodrigues
1,
Adriano B. Moura
1& Manoel dos S. Oliveira Filho
1DOI: http://dx.doi.org/10.1590/1807-1929/agriambi.v20n1p29-35
A B S T R A C T
This study aimed to evaluate sugarcane growth and its agricultural and industrial yield influenced by phosphorus (P) sources and forms of application. The experiment was carried out at the Paisa Sugar Mill, in Penedo-AL, Brazil, from February 2012 to February 2013. The adopted experimental design was a randomized block in a factorial arrangement, with four replicates. The treatments consisted of five doses of triple superphosphate applied in the planting furrow (0, 50, 100, 150 and 200 kg ha-1 of P
2O5), and three doses of Bayóvar
reactive phosphate rock (0, 100 and 200 kg ha-1 of P
2O5) applied in the total area. Phosphorus
applied in the planting furrow improved sugarcane quality through the reduction of fiber and increases in purity, corrected pol, total recoverable sugar, ton of pol per hectare (TPH) and ton of sugarcane per hectare (TSH). The Bayóvar reactive phosphate rock promoted increases in stem diameter at 120 days after planting (DAP), TPH and TSH. For the interaction triple superphosphate applied in the planting furrow x Bayóvar reactive phosphate rock applied in the total area, there were significant differences in the number of tillers at 30 DAP, stem diameter at 120 DAP and TSH.
Crescimento e produtividade da cana-de-açúcar
em função de doses e formas de aplicação de fósforo
R E S U M O
Propôs-se, com este estudo, avaliar o crescimento e a produtividade agrícola e industrial da cana-de-açúcar influenciada por fontes, doses e formas de aplicação de fósforo. O experimento foi conduzido na Usina Paisa, Penedo - AL, no período de fevereiro de 2012 a fevereiro de 2013. O delineamento experimental utilizado foi o de blocos casualizados em arranjo fatorial, com quatro repetições. Os tratamentos consistiram de cinco doses de superfosfato triplo P2O5 (0, 50, 100, 150 e 200 kg ha-1 de P
2O5) aplicadas no sulco de plantio
e três doses de P2O5 (0, 100 e 200 kg ha-1) com a fonte fosfato natural reativo Bayóvar,
aplicado em área total. O fósforo aplicado no sulco de plantio promoveu melhorias na qualidade da cana-de-açúcar pela redução da fibra e do aumento da pureza, do pol da cana corrigido, do açúcar total recuperável e açúcar provável por hectare (TPH) além de ter aumentado a produtividade de colmos por hectare (TCH). O fosfato natural reativo proporcionou acréscimos no diâmetro do colmo aos 120 dias após o plantio (DAP), TPH e TCH. A interação superfosfato triplono sulco de plantio x fosfato natural reativo em área total exerceu efeitos significativos na população de perfilhos aos 30 DAP, diâmetro do colmo aos 120 DAP e TCH.
Key words:
phosphorus fertilizer soil management agroindustrial yield
Palavras-chave: fertilizante fosfatado manejo do solo
rendimento agroindustrial
1 Universidade Federal de Alagoas/Centro de Ciências Agrárias. Rio Largo, AL. E-mail: [email protected]; [email protected]
(Corresponding author); [email protected]; [email protected]; [email protected]
Introduction
The expansion of sugarcane fields in Brazil has been intensified because of the increasing demand for biofuels, especially from ethanol and sugar production, its main product (Ferreira Júnior et al., 2012; Moura Filho et al., 2014). Brazil is the global leader in sugarcane production, with about 634.8 million tons per season. The state of Alagoas is responsible for 22.4 million tons, occupying the sixth position among the producing states. Despite being the largest sugarcane producer in the Northeast region of Brazil, Alagoas has a sugarcane yield below the national average. In the 2014/2015 season, the state obtained mean yield of 58.2 t ha-1, against a national mean of 70.5 t ha-1 (CONAB, 2015).
The low yield of sugarcane fields in the state of Alagoas is mostly due to the low fertility of its soils, which reduces plant growth and development (Melo Filho et al., 2007). In this context, the use of soil management practices can contribute to increase the fertility of these soils, thus increasing agricultural yield.
Although phosphorus (P) is absorbed in lower amounts by the sugarcane crop, compared with other primary macronutrients (Espironelo et al., 1986; Reis Júnior & Monnerat, 2003), it plays an important role in photosynthesis, root development, tillering and in sugarcane yield and quality (Meyer & Wood, 2001).
Phosphate fertilizers can be classified as soluble or little soluble. The soluble ones have been commonly used for having high agronomic efficiency in the short term, but with a high cost. On the other hand, the less soluble sources, such as reactive natural phosphates, are characterized by low initial dissolution speed, with lower cost per ton of fertilizer (Santos et al., 2012). However, considering the cumulative production of many crops after P application, the performance of some natural phosphates can become equal to that of more soluble sources (Resende et al., 2006).
In this context, this study aimed to evaluate sugarcane growth and its agricultural and industrial yields, influenced by P sources, doses and forms of application.
Material and Methods
The study was conducted from February 23, 2012, to February 19, 2013, at the Paisa Sugar Mill, in the municipality of Penedo-AL, Brazil (10º 16’ 47’’ S; 36º 24’ 47’’ W). The experimental area is located on the Coastal Plains and the soil is classified as typical distrophic Yellow Latosol, with medium texture and moderate A horizon.
The statistical design was randomized blocks, in a 5 x 3 factorial scheme, with four replicates. Each plot consisted of eight 20-m long rows, combined with spacing of 1.4 x 0.9
m. The evaluation area consisted of the four central rows, considering a length of 10 m.
The treatments were five doses of P2O5 (0, 50, 100, 150 and 200 kg ha-1), using the source triple superphosphate applied in the planting furrow, and three doses of P2O5 (0, 100 and 200 kg ha-1), using the source Bayóvar reactive phosphate rock applied in the total area. Soil tillage consisted of one harrowing and one furrowing. Liming was not necessary, since the soil had base saturation (V%) higher than 60% (Table 1). The soil showed contents of phosphorus and potassium considered very low, according to the classification proposed by Raij et al. (1996).
Fertilization in the planting furrow was performed using 70 kg ha-1 of N, as ammonium sulfate, and 140 kg ha-1 of K
2O, as potassium chloride. The sugarcane variety RB92579 was used, for its production potential in the Northeast region of Brazil.
Climate data were obtained from the weather station of the Paisa Sugar Mill and the mean temperature in the region was 26.2 °C, with mean maximum of 30.5 °C and mean minimum of 21.9 °C. Relative air humidity ranged from 65 to 95% and the total rainfall was equal to 1,321 mm. Reference evapotranspiration was estimated through the Penman-Monteith-FAO-56 method (Allen et al., 1998) and the obtained value was 1,617 mm. Rainfalls were concentrated in the beginning of the experiment, in February, and from May to August 2012. In the other months, the crop suffered water stress, which limited its growth and yield.
For crop growth evaluation, the parameters stem diameter, plant height and leaf area index (LAI) were used. Thirty plants were randomly sampled in the evaluation area of each plot at 120, 240 and 360 days after planting (DAP). In addition, the number of tillers per linear meter was evaluated, considering the total number in the evaluation area at 30, 90, 120, 150, 270 and 360 DAP.
Leaf area (LA) was calculated according to Eq. 1 (Hermann & Câmara, 1999):
OM - Organic matter; CEC - Cation exchange capacity; V - Base saturation
Table 1. Soil chemical analyses in the layers of 0-20 and 20-40 cm, before experiment installation, Paisa Sugar Mill, Penedo-AL, Brazil
(
) (
)
LA= L W 0.75× × × N+2
where:
LA - leaf area, m2;
L - length of the +3 leaf, m; W - width of the +3 leaf, m;
0.75 - correction factor for crop leaf area; and
N - number of open leaves with at least 20% of green area.
The leaf area index (LAI) was calculated through Eq. 2:
LA NT LAI
S × =
(1)
where:
LA - leaf area, m2;
NT - number of tillers per meter; and S - spacing between rows, m.
For stem diameter determination, a caliper was used at the height corresponding to the middle section of the plant, from its base; plant height was measured with a tape measure from the soil surface to the last visible auricle region of the +1 leaf.
At the end of the cycle (360 days), sugarcane was harvested and weighed for the estimation of the tons of sugarcane per hectare (TSH) in the evaluation area. For the determination of agro-industrial characteristics, 10 stalks were randomly sampled in each plot and analysed in the Laboratory of Technological Analysis of the Paisa Sugar Mill, for the contents of soluble solids (Brix, %), fiber (%), purity (%), corrected pol (CP, %) and total recoverable sugar (TRS). The probable ton of pol per hectare (TPH) was obtained by multiplying TSH by CP/100.
The data were subjected to analysis of variance and F test, using the statistical program SAEG 5.0. The significant interactions between factors were evaluated using regression analysis; the coefficients of the components of each model were tested and the significant models with the highest coefficients of determination (R2 adjusted) were selected using the program Fcalc (Moura Filho & Cruz, 1996).
Results and Discussion
According to the summary of the analysis of variance (Table 2), there was significant effect of P doses in the planting furrow on the variables purity, fiber, CP, TRS, TPH and TSH; for the P doses applied in the total area, the effect was significant for stem diameter at 120 DAP, TPH and TSH. As to the interaction Localized x Total Area, there was significant effect for the number of tillers at 30 DAP, stem diameter at 120 DAP and TSH. There were no significant effects for plant height, LAI and Brix.
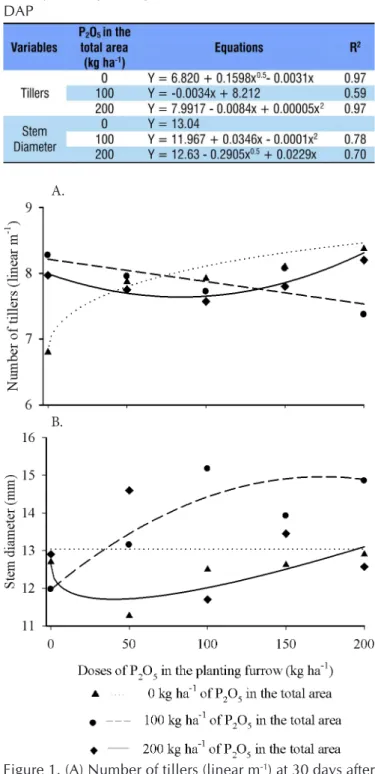
For the number of tillers, there was significant effect (p < 0.01) for the interaction L x TA at 30 DAP. For the treatment without P application in the total area, there was exponential effect, according to the equation shown in Table 3.
For the dose of 100 kg ha-1 of P
2O5 applied in the total area, there was a decreasing linear effect on the number of tillers, while the dose of 200 kg ha-1 of P
2O5, also applied in the total area, caused a quadratic response (Figure 1A). From 90 DAP
*Significant at 0.01 probability level; **Significant at 0.05 probability level and nsNot significant; L - Localized P fertilization in the planting furrow (triple superphosphate); TA - P fertilization
in the total area (Bayóvar reactive phosphate rock)
Table2.Analysis of variance for number of tillers at 30 days after planting (DAP), stem diameter at 120 DAP, purity,
fiber, corrected pol (CP), total recoverable sugar (TRS), ton of pol per hectare (TPH) and ton of sugarcane per hectare (TSH), as a function of phosphorus doses and forms of application
Table 3. Regression equations for the number of tillers at
30 days after planting (DAP) and stem diameter at 120 DAP
Figure 1. (A) Number of tillers (linear m-1) at 30 days after
planting (DAP) and (B) Stem diameter (mm) at 120 DAP, as a function of phosphorus doses and forms of application
A.
on, there was no significant effect with respect to P doses and forms of application for this growth variable.
Santos et al. (2009), evaluating P sources on sugarcane growth in the municipality of Coruripe-AL, did not observe significant effect of different P sources on the number of tillers of the plant cane, although P is considered essential for tillering and root system growth in grasses, increasing their yields (Santos et al., 2002).
As to stem diameter, there was significant effect (p < 0.05) for the P application in the total area and the interaction L x TA (p < 0.05) at 120 DAP. From 240 DAP on, there was no significant effect of P doses and forms of application.
For the treatment without P application in the total area, the response of stem diameter was best represented by the mean, with value of 13 mm (Figure 1B). For the dose of 100 kg ha-1 of P
2O5 applied in the total area, combined with the application of 173 kg ha-1 of P
2O5 in the planting furrow, a maximum diameter of 15 mm was observed. The dose of 200 kg ha-1 of P
2O5 applied in the total area caused a lower response, compared with the other treatments. Caione et al. (2011), studying P doses and forms of application on the sugarcane crop, observed no significant effect for stem diameter.
Juice purity was influenced (p < 0.01) only by the application of P doses in the planting furrow. According to Figure 2A, the effect of the doses promoted a quadratic response, reaching a purity value of 90.35%, with the maximum dose of 130 kg ha-1 of P
2O5. All the treatments showed values above 85% of purity, with mean of 89.5%, which is essential to obtain good juice quality, increasing the quality of the produced sugar and, consequently, its economic value.
In São Paulo, a minimum juice purity of 80% is recommended for sugarcane industrialization at the beginning of the season and 85% at the end of the season (Franco, 2003).
For fiber content, the effect was significant (p < 0.01) for the P doses applied in the planting furrow. The lowest fiber content (Figure 2B) (12.9 %) was obtained at the dose of 97.5 kg ha-1 of P
2O5. This is different from the result reported by Simões Neto et al. (2012), who analysed agro-industrial sugarcane characteristics as a function of phosphate fertilization and did not observe significant values for fiber contents. Currently, fiber contents between low and medium are desired in electricity generation and production of cellulosic ethanol.
CP values also showed significant effect (p < 0.05) with respect to P fertilization in the planting furrow, and the dose of 69 kg ha-1 promoted the highest sucrose content (16.8%), thus contributing to a higher sugarcane price (Figure 2C). This result is similar to that obtained by Elamin et al. (2007), in a study conducted in Sudan, who concluded that P deficiency results in significant decrease in sucrose accumulation in the sugarcane, because P fertilization directly affects the amount of sugar and juice purity.
As to TRS, there was a significant effect (p < 0.05) in relation to the localized P doses. The effect of the doses promoted a quadratic response and, based on the regression equation (Figure 2D), the highest TRS content (161.6 kg t-1)
Figure 2. (A) Purity (%), (B) Fiber (%), (C) corrected pol
(CP, %) and (D) total recoverable sugar (TRS, kg t-1), as
a function of phosphorus doses applied in the planting furrow
A.
Doses of P2O5 in the planting furrow (kg ha-1)
B.
C.
was obtained with 114 kg ha-1 of P
2O5. On the other hand, Korndörfer & Melo (2009), evaluating the effect of solid and liquid P sources locally applied, did not observe significant differences in the agro-industrial characteristics of the sugarcane variety SP71-1406.
Currently, sugarcane has been paid for its high qualitative indices, i.e., the better the quality of the raw material, the higher is the price paid per ton of stalk (Farias et al., 2009). In general, the results of this study show that the quality of the raw material can be improved with phosphate fertilization applied in the planting furrow.
TSH data showed significance for P fertilization applied locally (p < 0.01), in the total area (p < 0.05) and for the interaction Localized x Total Area (p < 0.05). According to the regression equation, for the application of P in the planting furrow, in the absence of P in the total area, the dose of 78 kg ha-1 of P
2O5 promoted a maximum sugarcane yield of 56.7 t ha-1. The dose of 100 kg ha-1 of P
2O5 applied in the total area, combined with 98 kg ha-1 of P
2O5 in the planting furrow, resulted in the production of 59.4 t ha-1 of marketable stalks. The dose of 200 kg ha-1 of P
2O5 applied in the total area, combined with 100 kg ha-1 of P
2O5 in the planting furrow, promoted a maximum sugarcane production of 67.3 t ha-1 (Figure 3).
These results corroborate with those observed by Morelli et al. (1991), who worked with magnesium thermal phosphate in the cycles of plant cane and ratoon cane and observed better results with the combination of 200 kg ha-1 of P
2O5 in the total area and 100 kg ha-1 of P
2O5 in the planting furrow. However, Caione et al. (2011), analysing P doses and forms of application on sugarcane, concluded that the forms of application promoted similar yields and the application in the planting furrow is more viable, because it is less expensive.
Korndörfer & Melo (2009) observed a positive response in stalk production for localized phosphate fertilization, in which the dose of 100 kg ha-1 of P
2O5 promoted yields from 131.9 to 146.1 t ha-1, varying according to the source used. The yield obtained in the present study is lower than that observed by many authors in experiments with plant cane (Santos et al., 2009; Calheiros et al., 2012). This probably occurred because the crop has undergone periods of low water availability in the months of March and April 2012 and from September 2012 until the harvest, in February 2013.
The reduction in water availability may also have decreased crop response to phosphate fertilization, since the diffusion is the most expressive mechanism of P transport in the soil, and it depends on many factors, among which the volumetric water content in the soil (Costa et al., 2006).
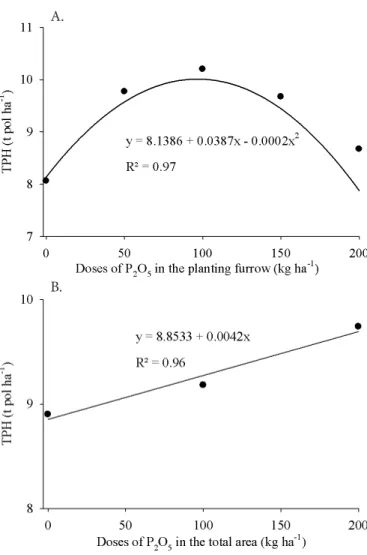
TPH was influenced (p < 0.01) by the P doses applied in the planting furrow. According to the quadratic regression equation, which best represented the data, the dose of 97 kg ha-1 of P
2O5 resulted in the maximum production of 10.01 t pol ha-1 (Figure 4A).
As to the significance (p < 0.05) of TPH values for the doses applied in the total area, the equation was linear; therefore, the maximum dose of 200 kg ha-1 of P
2O5 promoted the maximum value of 9.96 t pol ha-1 (Figure 4B). Simões Neto et al. (2012), studying agro-industrial sugarcane characteristics, as a
Figure 3. Ton of sugarcane per hectare (TSH) as a function
of phosphorus doses and forms of application
Figure 4. Ton of pol per hectare (TPH) as a function of
phosphorus doses applied in the planting furrow (A) and in the total area (B)
function of phosphate fertilization, observed that the highest increments in TSH and TPH occurred for the same P doses, which indicates a limitation of the soils related to P deficiency or low availability, regardless of their chemical, physical or mineralogical characteristics.
Conclusions
1. The application of phosphorus in the planting furrow influenced purity, fiber, corrected pol, total recoverable sugar, ton of pol per hectare (TPH) and ton of sugarcane per hectare (TSH).
2. Phosphate application in the total area promoted increases in stem diameter at 120 days after planting (DAP), TPH and TSH.
3. There was significant effect for the interaction Localized x Total Area for the number of tillers at 30 DAP, stem diameter at 120 DAP and TSH.
4. The maximum yield was obtained with the combination of 200 kg ha-1 of P
2O5 in the total area and 100 kg ha -1 of P
2O5 applied in the planting furrow.
Acknowledgments
To the Coordination for the Improvement of Higher Education Personnel (CAPES), for the scholarship, and to the Paisa Sugar Mill, for providing support and the experimental area.
Literature Cited
Allen, R. G.; Pereira, L. S.; Raes, D.; Smuth, M. Crop Evapotranspiration: Guidelines for computing crop water requirements. Rome: FAO, 1998, 301p. Irrigation and Drainage Paper 56.
Caione, G.; Teixeira, M. T. R.; Lange, A.; Silva, A. F.; Fernandes, F. M. Modos de aplicação e doses de fósforo em cana-de-açúcar forrageira cultivada em Latossolo Vermelho-Amarelo. Revista de Ciências Agro-Ambientais, v.9, p.1- 11, 2011.
Calheiros, A. S.; Oliveira, M. W.; Ferreira, V. M.; Barbosa, G. V. S.; Santiago, A. D.; Aristides, E. V. S. Produção de biomassa, de açúcar e de proteína em função de variedades de cana e de adubação fosfatada. Semina: Ciências Agrárias, v.33, p.809-818, 2012. http:// dx.doi.org/10.5433/1679-0359.2012v33n2p809
CONAB - Companhia Nacional de Abastecimento. Acompanhamento de safra brasileira: cana-de-açúcar, quarto levantamento, 2015. Brasília: CONAB, 2015. 29p.
Costa, J. P. V.; Barros, N. F.; Albuquerque, A. W.; Moura Filho, G.; Santos, J. R. Fluxo difusivo de fósforo em função de doses e da umidade do solo. Revista Brasileira de Engenharia Agrícola e Ambiental, v.10, p.828-835, 2006. http://dx.doi.org/10.1590/ S1415-43662006000400007
Elamin, E. A.; Eltilib, M. A.; Elnasikh, M. H.; Ibrahim, S. H.; Elsheikh, M. A.; Babiker, E. E. The influence of phosphorus and potassium fertilization on the quality of sugar of two sugarcane varieties grown on three soil series of Sudan. Journal of Applied Sciences, v.7, p.2345-2350, 2007. http://dx.doi.org/10.3923/ jas.2007.2345.2350
Espironelo, A.; Gallo, J. R.; Lavorenti, A.; Igue, T.; Hiroce, R. Efeitos da adubação NPK nos teores de macronutrientes das folhas de cana-de-açúcar (cana-soca). Bragantia, v.45, p.377-382, 1986. http://dx.doi.org/10.1590/S0006-87051986000200016
Farias, C. H. A.; Fernandes, P. D.; Gheyi, H. R.; Dantas Neto, J. Qualidade industrial de cana-de-açúcar sob irrigação e adubação com zinco, em Tabuleiro Costeiro paraibano. Revista Brasileira de Engenharia Agrícola e Ambiental, v.13, p.419-428, 2009. http:// dx.doi.org/10.1590/S1415-43662009000400008
Ferreira Júnior, R. A.; Souza, J. L.; Lyra, G. B.; Teodoro, I.; Santos, M. A.; Porfirio, A. C. S. Crescimento e fotossíntese de cana-de-açúcar em função de variáveis biométricas e meteorológicas. Revista Brasileira de Engenharia. Agrícola e Ambiental, v.16, p.1229-1236, 2012. http://dx.doi.org/10.1590/S1415-43662012001100012 Franco, A. Cana-de-açúcar cultivada em solo adubado com lodo de
esgoto e vinhaça: nitrogênio no sistema solo-planta, produtividade e características tecnológicas. Jaboticabal: UNESP, 2003. 90p. Dissertação Mestrado
Hermann, E. R.; Câmara, G. M. S. Um método simples para estimar a área foliar de cana-de-açúcar. STAB: Açúcar, Álcool e Subprodutos, v.17, p.32-34, 1999.
Korndörfer, G. H.; Melo, S. P. Fontes de fósforo (fluida ou sólida) na produtividade agrícola e industrial da cana-de-açúcar. Ciência e Agrotecnologia, v.33, p.92-97, 2009. http://dx.doi.org/10.1590/ S1413-70542009000100013
Melo Filho, J. F. de; Souza, A. L. V.; Souza, L. S. Determinação do índice de qualidade subsuperficial em um Latossolo Amarelo Coeso dos Tabuleiros Costeiros sob floresta natural. Revista Brasileira de Ciência do Solo, v.31, p.1599-1608, 2007. http:// dx.doi.org/10.1590/S0100-06832007000600036
Meyer, J. H.; Wood, R. A. The effects of soil fertility and nutrition on sugarcane quality: A review. South African Sugar Technologists Association, v.75, p.242-245, 2001.
Morelli, J. L.; Nelli, E. J.; Baptistella, J. R.; Demattê, J. L. I. Termofosfato na produtividade da cana-de-açúcar e nas propriedades químicas de um solo arenoso de baixa fertilidade. Revista Brasileira de Ciência do Solo, v.15, p.57-61, 1991.
Moura Filho, G.; Albuquerque, A. W.; Moura, A. B.; Santos, A. C. I.; Oliveira Filho, M. S.; Silva, L. C. Diagnose nutricional de variedades de cana-de-açúcar em argissolos. Revista Brasileira de Engenharia Agrícola e Ambiental, v.18, p.1102-1109, 2014. http:// dx.doi.org/10.1590/1807-1929/agriambi.v18n11p1102-1109 Moura Filho, G.; Cruz, C. D. Fcalc for Windows v.1.1: Programa
para cálculo do F corrigido em análises de regressão: Teste dos coeficientes. Viçosa: UFV, 1996. Software.
Raij, B. van.; Silva, N. M.; Bataglia, O. C.; Quaggio, J. A.; Hiroce, R.; Catarella, H.; Bellinazzi Junior, R.; Dechen, A. R.; Trani, P. E. Recomendação de adubação e calagem para o Estado de São Paulo. Campinas: Instituto Agronômico, 1996. 285p. Boletim Técnico, 100
Reis Junior, R. A.; Monnerat, P. H. DRIS norms validation for sugarcane crop. Pesquisa Agropecuária do Brasil, v.38, p.379-385, 2003. http://dx.doi.org/10.1590/S0100-204X2003000300007 Resende, A. V.; Furtini Neto, A. E.; Alves, V. M. C.; Muniz, J. A.;
Santos, F. C.; Albuquerque Filho, M. R.; Novais, R. F.; Ferreira, G. B.; Carvalho, M. C. S.; Silva Filho, J. L.Fontes, doses e formas de aplicação de fósforo para o algodoeiro no Cerrado da Bahia. Revista Ceres, v.59, p.537-543, 2012. http://dx.doi.org/10.1590/ S0034-737X2012000400015
Santos, H. Q.; Fonseca, D. M.; Cantarutti, R. B.; Alvarez V. V. H.; Nascimento Júnior, D. Níveis críticos de fósforo no solo e na planta para gramíneas forrageiras tropicais em diferentes idades. Revista Brasileira de Ciência do Solo, v.26, p.173-182, 2002. http://dx.doi. org/10.1590/S0100-06832002000100018
Santos, V. R.; Moura Filho, G.; Albuquerque, A. W.; Costa, J. P. V.; Santos, C. G.; Santos, A. C. I. Crescimento e produtividade agrícola de cana-de-açúcar em diferentes fontes de fósforo. Revista Brasileira de Engenharia Agrícola e Ambiental, v.13, p.389-396, 2009. http://dx.doi.org/10.1590/S1415-43662009000400004 Simões Neto, D. E.; Oliveira, A. C.; Rocha, A. T.; Freire, F. J.; Freire, M. B.