The use of different clustering methods in the evaluation of genetic
diversity in upland cotton
1Utilização de diferentes métodos de agrupamentos na avaliação da divergência
genética em algodoeiro herbáceo
Laíse Ferreira de Araújo2*, Wener Santos de Almeida3, Cândida Hermínia Campos de Magalhães Bertini4,
Francisco das Chagas Vidal Neto5 e Ervino Bleicher4
ABSTRACT - The continuous development and evaluation of new genotypes through crop breeding is essential in order to obtain new cultivars. The objective of this work was to evaluate the genetic divergences between cultivars of upland cotton (Gossypium hirsutum L.) using the agronomic and technological characteristics of the fibre, in order to select superior parent plants. The experiment was set up during 2010 at the Federal University of Ceará in Fortaleza, Ceará, Brazil. Eleven cultivars of upland cotton were used in an experimental design of randomised blocks with three replications. In order to evaluate the genetic diversity among cultivars, the generalised Mahalanobis distance matrix was calculated, with cluster analysis then being applied, employing various methods: single linkage, Ward, complete linkage, median, average linkage within a cluster and average linkage between clusters. Genetic variability exists among the evaluated genotypes. The most consistant clustering method was that employing average linkage between clusters. Among the characteristics assessed, mean boll weight presented the highest contribution to genetic diversity, followed by elongation at rupture. Employing the method of mean linkage between clusters, the cultivars with greater genetic divergence were BRS Acacia and LD Frego; those of greater similarity were BRS Itaúba and BRS Araripe.
Key words:Gossypium hirsutum L.. Fibre quality. Agronomic characteristics.
RESUMO - A geração e avaliação contínua de novos genótipos, por meio do melhoramento genético, é fundamental para a obtenção de novas cultivares. Foi o objetivo deste trabalho avaliar a divergência genética entre cultivares de algodoeiro herbáceo (Gossypium hirsutumL.), por meio de características agronômicas e tecnológicas da fibra, visando à seleção de parentais superiores. O experimento foi implantado na Universidade Federal do Ceará, Fortaleza/CE, em 2010. Foram usadas 11 cultivares de algodão herbáceo, utilizando o delineamento experimental em blocos casualizados, com três repetições. Para avaliação da divergência genética entre as cultivares foi obtida a matriz de distâncias generalizada de Mahalanobis, e em seguida, realizado agrupamento por diferentes métodos, sendo eles o método da ligação simples, de Ward, da ligação completa, da mediana, da ligação média dentro de grupo e da ligação média entre grupo. Há variabilidade genética entre os genótipos avaliados. O método de agrupamento que apresentou maior consistência foi a ligação média entre grupo. O peso médio do capulho apresentou a maior contribuição para a diversidade genética, seguida do alongamento à ruptura dentre os caracteres avaliados. As cultivares de maior divergência genética, usando o método de ligação média entre grupo, foram a BRS Acácia e LD Frego; as de maior similaridade foram a BRS Itaúba e BRS Araripe.
Palavras-chave:Gossypium hirsutumL.. Qualidade da fibra. Características agronômicas.
*Autor para correspondência
1Recebido para publicação em 02/06/2012; aprovado em 03/12/2013
Parte da Monografia do primeiro autor, apresentada ao Curso de Agronomia da Universidade Federal do Ceará
2Programa de Pós-Graduação em Engenharia Agrícola, Centro de Ciências Agrárias, Universidade Federal do Ceará, Campus do Pici, Caixa
Postal 12.168, Fortaleza-CE, Brasil, 60.450-760, laiseferreiradearaujo@gmail.com
3Programa de Pós-Graduação em Fitotecnia, Universidade Federal do Ceará, Fortaleza-CE, Brasil, 60.356-001, weneralmeida@hotmail.com 4Departamento de Fitotecnia, Universidade Federal do Ceará, Fortaleza-CE, Brasil, candida@ufc.br; ervino@ufc.br
INTRODUCTION
Upland cotton (Gossypium hirsutum L. var.
latifolium Hutch.) produces the most important textile fibre on the planet, accounting for 40% of all fibres produced (OZYIGIT, 2009). The cotton crop had a record harvest of 5.059 million tons of cotton (as seed) in 2011, 72.6% greater than in 2010. In the northeast of Brazil, which accounts for 34.53% of the area of the country, there was a decline in cotton acreage in all states, with the exception of Ceará, which registered an increase of 4.4% (CONAB, 2010).
Knowledge of the genetic diversity among a group of parent plants of any species is of great importance, especially in the identification of those hybrid combinations having a greater heterotic effect. When such combinations are taken as a basis, the probability of recovering superior genotypes in segregating generations is greater (ROTILIet al., 2012). The use of parent plants with low genetic diversity in the formation of populations for selection, reduces genetic variability, making the selection of superior genotypes difficult (CRUZ; CARNEIRO, 2003).
Predictive methods of genetic diversity have been widely used. Among them are those that quantify diversity by means of measurements of dissimilarity, one such being the generalised Mahalanobis distance
(CARVALHO et al., 2003). The choice of the most
appropriate method has been determined by the accuracy required by the researcher, the ease of analysis and the way in which the data were obtained. Several studies have been carried out in order to compare the methods used to measure dissimilarity and methods of clustering in various crops:
wheat (BERTANet al., 2006), beans (CARGNELUTTI
FILHO et al., 2010) and maize (CARGNELUTTI
FILHO; GUADAGNIN, 2011).
Silva Filho et al. (2005) were able to verify
genetic variability among evaluated cultivars of upland cotton, it being possible to identify divergent genotypes having good technological characteristics for their fibre, which, in turn, then receive greater attention by breeders for use in artificial crossings. This study therefore, aimed to evaluate the genetic diversity of cultivars of upland cotton based on several clustering methods, under the conditions found in Fortaleza, Ceará, Brazil.
MATERIAL AND METHODS
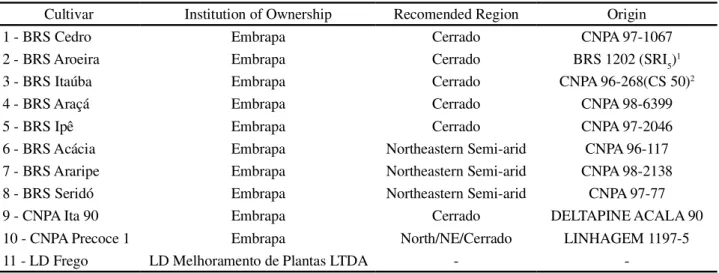
The experiment was carried out in the field, in the city of Fortaleza in the northern region of the Brazilian state of Ceará; on the Pici Campus of the Federal University of Ceará. Treatments consisted of 11 cultivars of upland cotton, all developed by the Breeding Program of Embrapa Cotton, with the exception of LD Frego (Table 1).
The climate in the region is Aw (tropical wet), according to the Köppen classification, with an average annual temperature of 26 ºC, a maximum of 34 ºC and a minimum of 21 °C. The mean annual rainfall is 1,600 mm with, the driest period in winter and maximum rainfall in the autumn (INMET, 2008). The soil of the experimental area is sandy, having the following chemical properties, according to the soil analysis shown below (Table 2).
Fertilization was carried out according to the soil analysis. The experiment was conducted in 2010, from April
Table 1 - List of cotton cultivars with their respective institution of ownership, region and origin
1SRI
5: Intra-populational recurrent selection - fifth cycle of reselection;
2Crossing CS x BRS FACUAL
Cultivar Institution of Ownership Recomended Region Origin
1 - BRS Cedro Embrapa Cerrado CNPA 97-1067
2 - BRS Aroeira Embrapa Cerrado BRS 1202 (SRI5)1
3 - BRS Itaúba Embrapa Cerrado CNPA 96-268(CS 50)2
4 - BRS Araçá Embrapa Cerrado CNPA 98-6399
5 - BRS Ipê Embrapa Cerrado CNPA 97-2046
6 - BRS Acácia Embrapa Northeastern Semi-arid CNPA 96-117
7 - BRS Araripe Embrapa Northeastern Semi-arid CNPA 98-2138
8 - BRS Seridó Embrapa Northeastern Semi-arid CNPA 97-77
9 - CNPA Ita 90 Embrapa Cerrado DELTAPINE ACALA 90
10 - CNPA Precoce 1 Embrapa North/NE/Cerrado LINHAGEM 1197-5
-Table 2 - Chemical properties from the soil analysis of Fortaleza, Ceará, 2010
Textural Classification pH (water) Sorption complex (cmolc.kg
-1)
MO (g kg-1)
Ca++ Mg++ Na+ K+ H+ + Al3+ Al3+
Sand 6.1 0.70 0.50 0.03 0.04 0.33 0.10 4.03
to August, giving a cycle of 120 days. The experimental design used was of randomised blocks with three replications.
Each experimental lot consisted of two rows 2.5 m long, with 10 plants in each row, spaced 0.25 m x 0.70 m apart, with the 10 central plants from each lot being considered usable, eliminating those at the edges. A conventional tillage system was adopted, with the soil being prepared by ploughing followed by harrowing. Irrigation was carried out by sprinkler according to the water requirements of the crop. Harvesting was done manually.
The agronomic and technological characteristics of fibre used in this study of the genetic diversity of the 11 upland cotton cultivars were: number of bolls per plant (NB), average boll weight (MBW), fibre yield (PRODF), percentage of fibre (PERCF), 100 seed weight (W100SDS), fibre length (LENF), fibre uniformity (UNF), short fibre index (SFI), strength (STR), elongation at rupture (ELG), micronaire index (MIC), fibre maturity (MAT), reflectance (Rd), degree of yellowness (+b) and reliability index (REL).
Firstly, univariate variance analysis was performed, with the aim of verifying the variability among cultivars. Subsequently, for analysis of genetic divergence, the genetic distance between the different pairs of genotypes was calculated, employing the generalised Mahalanobis distance (Dij²) as a measure of genetic dissimilarity among the cultivars. To estimate this distance, the averages were computed for each of the variables for each cultivar, and then the residual covariance matrix was established, the data transformation matrix, the variance of transformed variables, the averages of uncorrelated variables, and finally the pivotal condensation technique for resolving the dispersion matrix.
From the dissimilarity matrix a cluster analysis was performed using the hierarchical methods of single linkage (nearest neighbour), of Ward, of complete linkage (furthest neighbour), of the median, the average linkage within a cluster and the average linkage between clusters, allowing dendrograms to be produced. To validate clusters, that is, to verify the ability of the dendrogram to reproduce the dissimilarity matrix, the cophenetic correlation coefficient (CCC) was calculated. The CCC is the Pearson correlation coefficient between the distance matrix (Dij2) and the cophenetic matrix (C). All the statistical analyses were carried out using the GENES software (CRUZ, 2006).
RESULTS AND DISCUSSION
The reliability index is the characteristic that most contributed to the characteristic-diversity analysis at 23.33%, followed by fibre yield at 12.69% and average boll weight at 11.36%. This reliability index includes several technological characteristics of the fibre (Table 3).
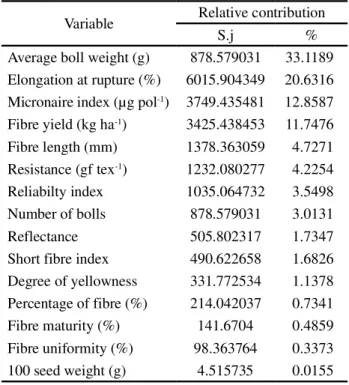
The relative contribution of each characteristic to divergence is of great importance in identifying those characteristics having the highest contribution, and also in excluding those with the least (MISSIOet al., 2007). The variables, number of bolls, 100 seed weight, fibre length, short fibre index, reflectance and degree of yellowness, contributed the least, with values close to zero. These same variables were suggested for exclusion by the evaluation of divergence between the cultivars. This exclusion, according
Table 3 - Relative contribution of characteristics to genetic diversity according to Singh (1981) based on the Generalized Mahalanobis Distance, between 11 upland cotton cultivars, in ascending order of importance. Fortaleza, Ceará, 2010
Variable Relative contribution
S.j %
Average boll weight (g) 878.579031 33.1189
Elongation at rupture (%) 6015.904349 20.6316
Micronaire index (µg pol-1) 3749.435481 12.8587
Fibre yield (kg ha-1) 3425.438453 11.7476
Fibre length (mm) 1378.363059 4.7271
Resistance (gf tex-1) 1232.080277 4.2254
Reliabilty index 1035.064732 3.5498
Number of bolls 878.579031 3.0131
Reflectance 505.802317 1.7347
Short fibre index 490.622658 1.6826
Degree of yellowness 331.772534 1.1378
Percentage of fibre (%) 214.042037 0.7341
Fibre maturity (%) 141.6704 0.4859
Fibre uniformity (%) 98.363764 0.3373
to Alveset al. (2003), should reduce the work, time and cost spent on experimentation. According to Rotiliet al. (2012), a higher relative contribution by the characteristic of productivity is important in the study of populations when selecting those which are most divergent.
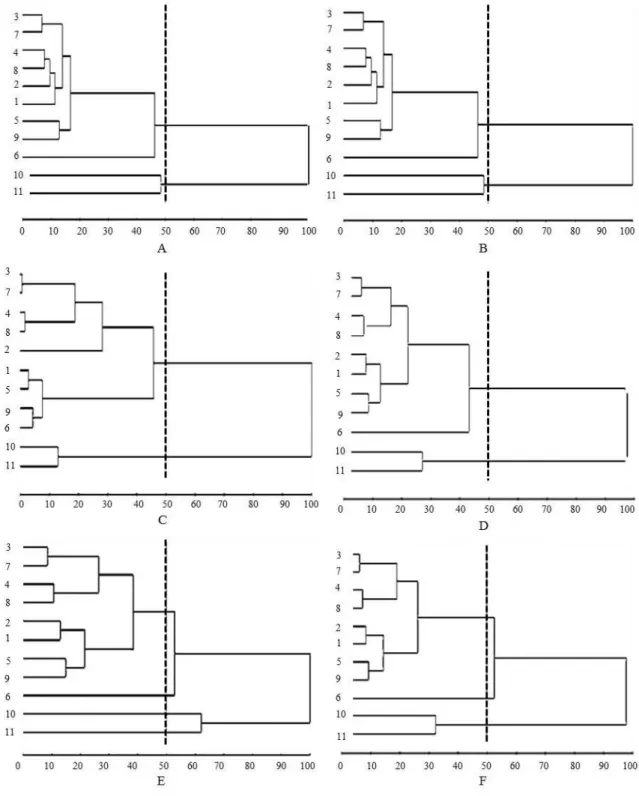
Figure 1 - Hierarchical dendrograms obtained from the generalised Mahalanobis distance using the clustering methods of single linkage (A), complete linkage (B), Ward (C), median (D), average linkage within a group (E) and average linkage between groups (F) for 11 genotypes of upland cotton. Fortaleza, Ceará, 2010
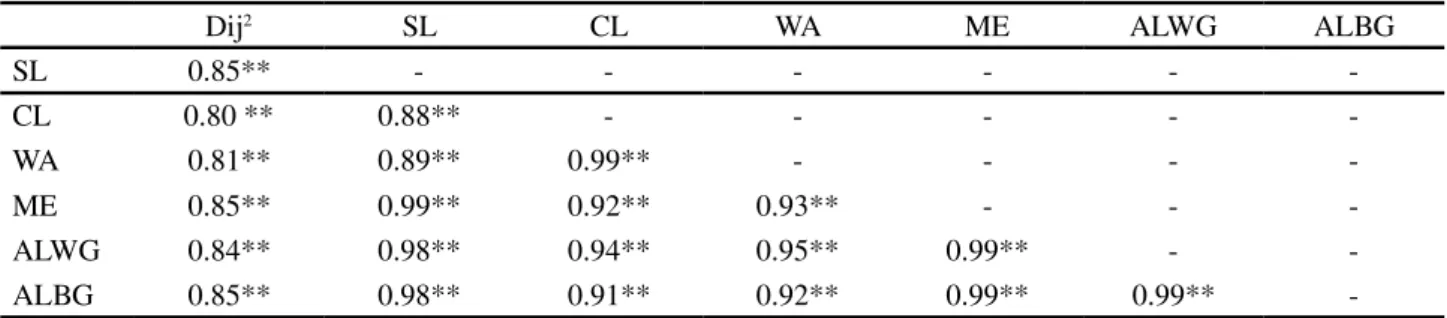
Table 4 - Cophenetic correlation coefficient between the generalised Mahalanobis distance matrix and hierarchical clustering methods, and between the individual hierarchical clustering methods. The lower diagonal shows the coefficients obtained from the generalised Mahalanobis distance Dij2, itself calculated for 11 genotypes of upland cotton. Fortaleza, Ceará, 2010
SL: single linkage; CL: complete linkage; WA: Ward’s method; ME: median; AWLG: average linkage within group and ALBG: average linkage between groups
Dij2 SL CL WA ME ALWG ALBG
SL 0.85** - - -
-CL 0.80 ** 0.88** - - - -
-WA 0.81** 0.89** 0.99** - - -
-ME 0.85** 0.99** 0.92** 0.93** - -
-ALWG 0.84** 0.98** 0.94** 0.95** 0.99** -
-ALBG 0.85** 0.98** 0.91** 0.92** 0.99** 0.99**
-(6); BRS Araripe (7); BRS Seridó (8); CNPA Ita 90 (9); CNPA Precoce 1 (10) and LD Frego (11).
There were 2, 2, 2, 2, 4 and 3 clusters of genotypes formed respectively by the hierarchical methods of single linkage, complete linkage, Ward, median, average linkage within a group and average linkage between groups. The cultivars, CNPA Precoce 1 and LD Frego (Figure 1) formed an isolated group in almost all the clustering methods, except that of average linkage within a group where each of these genotypes made up a single cluster.
Costa (2001) reports that the quantification of genetic diversity using the generalised Mahalanobis distance was effective to highlight at least one fairly divergent group formed by two accessions of upland cotton cotton, Del Cerro and Acala SJ-2.
In Table 4 are shown the cophenetic correlation coefficients between the generalised Mahalanobis distance matrix (D2) and the hierarchical clustering methods.
The cophenetic correlation coefficient (CCC) between the generalised Mahalanobis distance matrix (Dij2) and the cophenetic distance matrix (C), given by the dendrogram for each method, were of high magnitude and significant, ranging from 0.80 (CL) to 0.85 (SL, ME and ALBG), demonstrating consistency in clustering (Table 4). Cruz and Carneiro (2003) report that cophenetic correlation is a good criterion to evaluate the consistency of a graphical representation, with values close to one indicating better performance.
The drawback found in these methods, according Cargnelutti Filho and Guadagnin (2011), is that in general, the cophenetic correlation coefficients, given by combining the measurements of dissimilarity with the clustering methods SL, CL, ALBG and WARD, decrease with the increase in the number of cultivars and variables, affecting the consistency of the clustering and thereby
presenting a degree of limitation. Thus, based on the generalised Mahalanobis distance (Dij2), the methods that graphically represented the original matrix with greater consistency (with the greatest cophenetic coefficients) were ME, ALBG and ALWG. On the other hand, the CL method gave the worst representation, with the lowest coefficient. These results are similar to those found by Cargnelutti Filhoet al. (2008), where the most consistent
methods were ALBG, ME and SL.
The correlation coefficient between the clustering methods ranged from 0.88 (SL/CL) and 0.99 (ME/SL, WA/ CL, AWLG/ME, ALBG/ME and ALBG/ALWG). Among the methods evaluated, ALBG showed a higher correlation with the remaining methods (values ranging from 0.85 to 0.99), greater consistency in clustering (CCC = 0.85) and easier visualisation of the groups formed (Figure 1- F). Considering the dendrogram given by the average linkage between groups - UPGMA (ALBG), it was possible to form three clusters. The first was formed by the cultivars BRS Cedro, BRS Ipê, CNPA ITA 90, BRS Aroeira, BRS Araçá, BRS Seridó, BRS Itaúba and BRS Araripe, the second by BRS Acácia and the third by CNPA Precoce 1 and LD Frego (Figure 1-F). These results are similar to those found by Silva Filho et al. (2005), who
when studying the genetic diversity among commercial cotton cultivars (Gossypium hirsuntum L.), grouped BRS Cedro, BRS Aroeira and BRS Jatobá in the same group. The same authors showed that there was a tendency for cultivars to group together according to the companies to which they belong, thus demonstrating that each company has its own germplasm for breeding.
with other work already done on strains of upland cotton
(BERTINIet al., 2006; MENEZESet al., 2008; RAHMAN
et al., 2002; ULLAH, I.et al. 2012; ZHANGet al., 2005). According to McCartyet al., (2007), breeding programs for cotton present a narrowing of the genetic base, which requires detailed genealogical studies into the parent plants used in these programs in order to avoid related crossings.
With respect to the genetic dissimilarity observed among the 55 pairs of cultivars, the highest value was found between the cultivars LD Frego and BRS Acácia (1172.28), followed by BRS Itaúba and LD Frego (929.58) and BRS Acácia and CNPA Precoce 1 (860.64). Those of greatest similarity were BRS Itaúba and BRS Araripe (23.01), followed by BRS Araça and BRS Seridó (26.08). The greater dissimilarity between cultivars indicates more divergence and the higher segregation of progenies originating from crossings between these genotypes.
Based on the dendrogram given by the average linkage between groups (ALBG) (Figure 1-F) and those given by the dissimilarity matrix, the cultivars, BRS Acácia and LD Frego, (1172.28) appear to be the most distant genetically. These cultivars showed the greatest genetic distance, being in very distinct groups on the dendrogram.
Based on the results obtained by divergence analysis, the pairs of cultivars most suitable for cross-breeding and obtaining segregating populations are:
1) BRS Acácia and LD Frego, the most divergent cultivars by the analysis of genetic divergence. BRS Acácia presented good technological characteristics for its fibre, such as high uniformity (88.03%) and fibre length (32.13 mm), both significant variables for the consumer market in cotton. On the other hand, the variety LD Frego has good agronomic characteristics, such as a high percentage of fibre (42.36%). The crossing of these cultivars may therefore result in populations with high levels of segregation, making it possible to obtain through selection new cultivars having good agronomic and technological characteristics for their fibre, in addition to not being a preference of the boll weevil, a characteristic afforded by its frego bracts.
2) BRS Itaúba and CNPA Precoce 1. BRS Itaúba presented good fibre quality, with the second best reliability index (3092.33). CNPA Precoce 1 had the highest reflectance (78.30), this characteristic being of great importance to the cotton market, which prefers whiter fibres.
CONCLUSIONS
1. The characteristics that contributed most to genetic divergence were the average boll weight, elongation at rupture and micronaire index;
2. The LMEG clustering method, based on the generalised Mahalanobis distance, was the most consistent in the assessment of the genetic diversity of genotypes;
3. The cultivars, BRS Acácia and LD Frego, showed the most genetic divergence. Those having the greatest similarity were BRS Itaúba and BRS Araripe;
4. The recommended crossings for obtaining genotypes with greater diversity are BRS Acacia with LD Frego and BRS Itaúba with CNPA Precoce 1.
REFERENCES
ALVES, R. M.et al. Seleção de descritores botânico-agronômicos
para caracterização de germoplasma de cupuaçuzeiro.Pesquisa Agropecuária Brasileira, v. 38, n. 7, p. 807-818, 2003. BERTAN, I.et al. Comparação de métodos de agrupamento na representação da distância morfológica entre genótipos de trigo.Revista Brasileira de Agrociência, v. 12, n. 3, p. 279-286, 2006.
BERTINI, C. H. C. de M. et al. Characterization and genetic diversity analysis of cotton cultivars using microsatellites.
Genetics and Molecular Biology, v. 29, n. 2, p. 321-329, 2006. CARGNELUTTI FILHO, A.et al. Comparação de métodos de agrupamento para o estudo da divergência genética em cultivares de feijão.Ciência Rural, v. 38, n. 8, p. 2138-2145, 2008. CARGNELUTTI FILHO, A.; GUADAGNIN, J. P. Consistência do padrão de agrupamento de cultivares de milho. Ciência Rural, v. 41, n. 9, p. 1503-1508, 2011.
CARGNELUTTI FILHO, A.; RIBEIRO, N. D.; BURIN, C. Consistência do padrão de agrupamento de cultivares de feijão conforme medidas de dissimilaridade e métodos de agrupamento.Pesquisa Agropecuária Brasileira, v. 45, n. 3, p. 236-243, 2010.
CARVALHO, L. P. et al. Análise da diversidade genética entre acessos de banco ativo de germoplasma de algodão.
Pesquisa Agropecuária Brasileira, v. 38, n. 10, p. 1149-1155, 2003.
CONAB, 2010. Disponível em:< http://www.conab.gov.br/ OlalaCMS/uploads/arquivos/fd72eb40e00a80951993a03948 e3fdf9.pdf>. Acesso em: 03 de mar. 2012.
COSTA, J. N. et al. Divergência genética entre acessos do banco ativo de germoplasma de algodoeiro: Gossypium hirsutum L. var. latifolium. In: III SIGERALC, 2001, Londrina,Anais... Londrina: Embrapa/CENARGEM, 2001. CRUZ, C. D.Programa Genes: Biometria. Viçosa, 2006. 382 p. CRUZ, C. D.; CARNEIRO, P. C. S.Modelos biométricos aplicados ao melhoramento genético. Viçosa: UFV, 2003. 585 p.
MCCARTY, J. C.; WU, J.; JENKINS, J. N. Use of primitive derived cotton accessions for agronomic and fiber traits improvement.Crop Science, v. 47, n. 1, p. 100-110, 2007. MENEZES, I. P. P. de et al. Distância Genética entre linhagens Avançadas de Germoplasma de Algodão usando Marcadores de RAPD e Microssatélite. Pesquisa Agropecuária Brasileira, v. 43, n. 10, p. 1339-1347, 2008.
MISSIO, R. F.; MORAES, M. L. T.; DIAS, L. A. S. Efeito do desbaste seletivo sobre a divergência genética em progênies de
Pinus caribaea Morelet var.bahamensis.Scientia Forestalis, v. 73, n. 1, p. 27-36, 2007.
OZYIGIT, I. I. In vitro shoot development from three different nodes of cotton (Gossypium hirsutum L.).Notulae Botanicae Horti Agrobotanici Cluj-Napoca, v. 37, n. 1, p. 74-78, 2009.
RAHMAN, M.; HUSSAIN, D.; ZAFAR, Y. Estimation of genetic divergence among elite cotton cultivars: genotypes by DNA fingerprinting technology.Crop Science, v. 42, n. 6, p. 2137-2144, 2002.
ROTILI, E. A. et al. Divergência genética em genótipos de milho, no Estado do Tocantins.Revista Ciência Agronômica, v. 43, n. 3, p. 516-521, 2012.
SILVA FILHO, J. L. et al. Diversidade Genética entre cultivares comerciais de algodão (Gossypium hirsuntum L.).
In: CONBRESSO BRASILEIRO DE ALGODÃO, 2005, Salvador, Anais... Salvador: V CONGRESSO BRASILEIRO DE ALGODÃO: algodão, uma fibra natural.
SINGH, D. The relative importance of characters affecting genetic divergence.The Indian Journal of Genetic and Plant Breeding, v. 41, n. 1, p. 237-245, 1981.
ULLAH, I. et al. Genetic diversity analysis of Bt cotton genotypes in Pakistan using simple sequence repeat markers.
Genetics and Molecular Research, v. 11, n. 1, p. 597-605, 2012.