All that glitters is not gold: Diversification Strategies in Reserve
Portfolio Management
Liliana Brandão Jerónimo
Master Degree in Finance
Supervisor:
Professor Luis Oliveira, PhD, ISCTE Business School, Finance Department
Diversification Strategies in Reserve Portfolio Management
I
Abstract
Considering an investment set restricted to bond indices, this paper analyses whether adding commodities will expand the investment frontier.
The case study is based on a hypothetical reserve management portfolio fully invested in the fixed income market and tries to assess whether commodities act as a natural diversifier. The approach differs from standard analysis by focusing exclusively on a EUR based investor with a preference for avoiding foreign exchange exposure. The analysis uses a database from 2000 to 2011 and applies a mean variance optimization process to the historical data.
The results obtained confirmed that, under the assumptions and the database considered, the diversification results in an expansion of the efficient frontier, leading to a better risk/return profile.The outcomes stood even after some stress tests to the potential weak spots: i) seeing if it works outside the crisis period; ii) imposing a maximum tracking error vs. the original bond only portfolio and iii) varying the correlation among bonds and commodities (from original negative values to zero/positive).
Keywords: Risk Diversification, Asset Allocation, Commodities, Reserve Management JEL: G11, G15
Resumo
Partindo de uma carteira constituída apenas por índices obrigacionistas, o presente estudo procura analisar o impacto da inclusão de um índice de commodities na referida carteira. O objectivo é verificar se o alargamento do conjunto de investimentos inicial provoca uma expansão da fronteira de eficiência.
A análise é baseada numa hipotética carteira de gestão de reservas investida totalmente no mercado obrigacionista procurando, numa fase subsequente, verificar se as commodities funcionam como um elemento de diversificação. O processo distingue-se das análises tradicionais através do seu enfoque numa carteira denominada exclusivamente em euros, considerando que o investidor tem preferência por evitar exposição cambial directa. A base de dados cobre o período entre 2000 e 2011, sendo sujeita a uma optimização no espaço média-variância.
Os resultados obtidos confirmam que, considerando as hipóteses e a base de dados utilizada, a diversificação levou a uma expansão da fronteira de eficiência, com os correspondentes ganhos no binómio rentabilidade/risco. Os resultados mantiveram-se válidos quando sujeitos a alguns testes: i) análise excluindo o período da crise financeira; ii) imposição de tracking error máximo vs. carteira original (obrigações) e iii) variação da correlação entre obrigações e commodities (dos valores negativos originais para zero/positiva).
Acknowledgments
Attaining a master degree was a goal left behind when leaving college and starting both a family and a working life. Fifteen years after finishing my degree in Economics, I decided to pursue my studies further. However, it wouldn’t have been possible without help.
First and foremost I would like to thank my family for all the support and patience throughout the last year, especially to my three children, my husband, my parents and my grandmother.
I would also like to thank my thesis adviser, Professor Luis Oliveira for the guidance and research material provided and, particularly, for always being available for my questions and doubts.
Finally I would like to thank my colleagues and senior management at Banco de Portugal for the encouragement given.
Index
1. Introduction ... 1
2. Review of the Literature ... 2
3. Empirical methodology and choice of the dataset ... 5
3.1. Dataset ... 5
3.2. Methodology ... 6
4. Investment Management and Asset Selection Process ... 9
4.1. The investment decision in a central bank perspective ... 9
4.2. Traditional assets: bonds and their evolution during the last decade ... 9
4.3. Alternative Assets: commodities and their evolution during the last decade .. 11
4.4. Commodities as a suitable diversifier for fixed income reserve portfolio ... 14
5. Empirical Results ... 16
5.1. Brief review of the methodology ... 16
5.2. Investment set 1: Optimal portfolio with bonds only ... 16
5.3. Investment set 2: Optimal portfolio when commodities are added ... 17
5.4. Investment set 3: Optimal portfolio with precious metals ... 18
5.5. Comparative Results ... 19
6. Robustness Checks ... 21
6.1. Stability over subsample - Considering two periods (before/crisis) ... 21
6.1.1. Before the crisis: from January 2000 to July 2007 ... 21
6.1.2. During the crisis: from August 2007 to December 2011... 22
6.2. Imposing a maximum tracking error vs. original bond portfolio... 24
6.3. Sensitivity analysis of the optimal portfolio to change in correlation between bonds and commodities ... 25
7. Conclusion ... 27
Sumário Executivo
Os mercados financeiros sofrem constantes metamorfoses e a sua evolução, nem sempre feita em continuidade, é por vezes acompanhada pelo surgimento de novos paradigmas. Considerando de forma particular a gestão de reservas, cujos montantes sob gestão têm crescido de forma significativa na última década, justifica-se a análise dos padrões habitualmente seguidos à luz do actual contexto de mercado.
Com base numa carteira constituída unicamente por quatro índices de obrigações soberanas (de diferentes maturidades) da zona euro, procura-se avaliar os potenciais ganhos associados à inclusão de um índice de commodities, ou de um subcomponente desse índice: metais preciosos (ambos denominados em euros).
A análise é feita com recurso a uma optimização conduzida no espaço média-variância, tendo por base os dados históricos referentes ao período decorrente entre 2000 e 2011. Ao conjunto de investimento original – índices obrigacionistas – é adicionado um activo alternativo, commodities ou metais preciosos, por forma a analisar quais os impactos na carteira, em termos de composição, rentabilidade e rácio de Sharpe.
Os resultados obtidos permitem concluir que, dentro dos parâmetros de análise considerados, o alargamento do conjunto de oportunidades de investimento possibilita a obtenção de resultados claramente superiores. A existência de correlações negativas ou positivas baixas justifica a inclusão dos referidos investimentos alternativos.
As conclusões retiradas da análise estão dependentes da evolução histórica dos dados seleccionados. Como forma de avaliar a robustez do processo, foram considerados alguns tópicos de análise adicionais para verificar qual o seu efeito sobre as variáveis utilizadas. Em primeiro lugar, efectuou-se uma subdivisão da amostra em dois períodos distintos: antes da crise dos mercados financeiros e durante o decorrer da mesma. Apesar da alteração do peso das componentes, manteve-se o efeito de diversificação positivo em ambos os períodos. Em segundo lugar, restringiu-se a alteração da composição da carteira a um desvio máximo de 15% em relação à carteira óptima original, composta apenas por obrigações. Os resultados obtidos demonstram que, nos casos em que a restrição é activa, embora se verifique uma diminuição dos ganhos, consequência da redução da alocação às commodities/metais preciosos, continua a ser vantajoso a sua inclusão no conjunto de possibilidades de investimento. Finalmente, é
feita uma análise com base numa alteração ad-hoc da correlação entre índices obrigacionistas e índice de commodities, como forma de testar de uma forma simplificadora a existência de alterações às correlações históricas – uma hipótese coerente no contexto actual dos mercados financeiros. As correlações originais – negativas – são alteradas de forma arbitrária para zero e para valores positivos (0,25 e 0,5). A diminuição do efeito de diversificação leva num primeiro momento à redução da percentagem afecta ao investimento em commodities, causando mesmo nos casos extremos a sua exclusão.
A análise efectuada permite algumas conclusões interessantes, existindo porém diversas áreas para futuros desenvolvimentos. Por um lado, as optimizações efectuadas poderão ser feitas numa perspectiva de análise de cenários, nomeadamente através do recurso ao método de Monte-Carlo. Por outro lado, poderá ser realizada uma modelização de volatilidades históricas ou das volatilidades implícitas no mercado de derivados. Numa outra vertente, a análise poderá ser realizada considerando diferentes formas de exposição aos referidos activos, através de futuros ou de investimento directo, para verificar qual o impacto nas conclusões obtidas.
1. Introduction
The capital invested in reserve management has been on a growing path worldwide. In fact, some countries have even setup Sovereign Wealth Funds (SWFs) to pursue a more aggressive management on part of their reserves as seen by Aizenman and Glick (2010). Regarding asset selection, investments have mainly been concentrated in those with a perceived lower downside risk, thereby favoring the choice of fixed income market over the last decades.
Besides reserve growth, the current crisis environment, in particular the uncertainty affecting the sovereign bond issuers, a usual pillar of fixed income portfolios, has highlighted the need to search for alternatives. Therefore, institutional investors, among others, have been considering alternative investments that can improve the risk/return profile of the portfolios under management, without compromising the intrinsic goals and characteristics .On a central bank perspective, the main issue is considering which assets would be suitable to pursue some risk diversification without jeopardizing the achievement of the objectives set in reserve management. Commodities seem like a natural candidate when considering the historical relationship with bonds and equities.
The first approach is a look into the characteristics of both asset classes and their behavior during the past decade. Commodities are first considered as a whole, and on a second phase the analysis is conducted on the components (agriculture, energy, industrial metals, precious metals and live cattle) on a stand-alone basis.
The remaining of the thesis is organized as follows: considering an index bond portfolio, an extension into commodities is tested in order to evaluate whether adding commodities to a fixed income portfolio would provide some degree of risk diversification, defining risk as measured by the standard deviation of returns. However, the crisis that emerged in the second half of 2007 has substantially changed the usual patterns. In order to better understand the effects, an analysis of each period is performed as well.
The main results are analyzed and the potential problems that could arise are highlighted, as well as the next steps that could be taken in this particular field.
2. Review of the Literature
The main benefits of asset diversification, established by Markowitz (1952) in his Modern Portfolio Theory, are thoroughly discussed in the financial markets. While it can be considered in a multitude of ways, the particular case of diversifying a portfolio which primarily includes fixed income only (or eventually some cash as well) by adding a second asset, in this case commodities, is an interesting application of the theoretical background. If we go one step further and apply the theory to a reserve management portfolio, their unique characteristics and goals pose an even more challenging question.
Most of the analysis that has been done on portfolio diversification considers the USD as denomination, due to its role as the world’s reserve and trade currency; therefore the USD is the pricing reference for the majority of assets, commodities included. The analysis usually includes all three major asset classes: bonds, stocks and commodities. Less frequently, Real Estate Investment Trusts (REIT) are also considered. Therefore the literature reviewed comprises a mix of asset diversification in general and the more restricted area of diversification from fixed income into commodities on the perspective of reserve management.
Considering the broader picture, the first concern is the better approach to evaluating a new diversifier. A simple framework has been designed by Kat (2006) who defines the questions that need to be answered. On an asset stand-alone approach, the risk premium, volatility of returns and their skews, referred to as the “statistical properties of future returns”, must be considered as a starting point. But the focus has to be given as well to other subjects that need to be priced, such as the higher uncertainty (due to shorter time span of data) of alternative investments and liquidity, a mandatory item for reserve portfolios. The transaction costs associated, usually fees if you’re considering investing in a fund, have to be acknowledged and incorporated in the analysis as well. Some additional questions need to be addressed when adding an alternative asset to our portfolio, i.e. what is the correlation with the existing portfolio.
Stocks and government bonds are regarded in most portfolios as the traditional asset classes. A comprehensive analysis of a variety of alternative investments (private equity, commodities and REIT) was done by Cumming, Haβ and Schweizer (2011). Some of the drivers of demand for alternative investments are identified and the
advantages of using indices when trying to incorporate several diversifiers into a traditional portfolio are considered. Their analysis moves away from traditional mean-variance space by acknowledging the effects of higher moments in the distribution, not considered in the present analysis. A subsample was used to control for the financial crisis, an approach also followed in here. The sub-division will follow Oliveira et al (2011) whereby two periods are considered: before the crisis – January 2000 to July 2007 – and crisis period – August 2007 to December 2011.
Reserve management portfolio differ from other institutional funds, therefore the decision to diversify away from fixed income has several intrinsic factors that have to be taken into consideration. An analysis was conducted by Ramaswamy (2008), with equities used as the alternative asset (also performed was a simpler approach of increasing the bond portfolio duration without any diversification away from fixed income). The characteristics of central bank goals and the presence of institutional constraints in the decision making process were thoroughly considered. An interesting point is made on the impact of the choice of reporting currency, by previously calculating the results on local currency on a purely asset risk/return approach and comparing the results with those obtained after converting to the reporting currency.
Fernandes and Ornelas (2010) performed an analysis on the benefits of diversifying a fixed income portfolio in USD and EUR bonds by including other classes like equities and commodities. The choice of the numeraire (reporting currency) is considered decisive when evaluating the potential benefits of diversification, as mentioned previously.
Focusing on the diversification to one specific asset class, commodities, the strategic allocation to be given in a portfolio has been the subject of several papers. Su and Keung (2010) compute the weight of commodities relative to traditional assets, after deriving a closed-form solution to assess the demand for the various asset classes. They conclude investors are better off by including commodities. Their paper tries to calculate the demand for commodities and other asset classes in the portfolio, and compares the utility benefits of including commodities. While both objectives are beyond the scope of this analysis, the characterization of the asset classes, the insight into the different ways of achieving exposure to commodities (physical investment,
indices and commodities futures) and the explanations offered to the demand for that particular asset class proved to be useful.
A different result was obtained by Daskalaki and Skiadopoulos (2011) who concluded that, with the exception of the commodity boom period – from 2005 to 2008 - the benefits of diversifying into commodities, not considering the particular case of gold on a stand-alone basis, could be challenged. Notwithstanding the conclusions, the analysis provides a very comprehensive approach by analyzing the results both in and out of a mean-variance setting and also by calculating the impact of the choice of the instrument when considering exposure to commodities.
Within the analysis of diversification brought by commodities, but focusing only on the exposure obtained through the futures market, Cheung and Miu (2011) tried to analyze whether the benefits are exclusive to the USD portfolios only and also if they are statistically significant. Some considerations were made on the type of investors that should hold commodities: conservative investors with high risk aversion.
Looking into the defining features of commodities as an asset class is essential to judge their adequacy to reserve management portfolios purposes. Among others this subject has been studied by Roache (2008). The fundamental reasons to hold commodities are considered by analyzing the underlying risk factors they provide exposure to, namely the macro risk exposure.
Baffes and Haniotis (2010) analyzed the commodity price boom period in a World Bank paper, which provides useful insight into the long term trends and characteristics of commodity prices.
The above mentioned literature proved to be very useful in defining and improving the framework for the current project. Even though the methodology and focus of the reviewed working papers diverged somewhat from the approach taken here, some of the steps are similar, and so are some of the obstacles found.
3. Empirical methodology and choice of the dataset
The choice of the dataset is a main driver of the results in any analysis. The emphasis here was on obtaining a coherent set of data in order to minimize prospective discrepancies. The methodology used was considered suitable to achieve the goals set: creating an efficient bond portfolio and assessing whether adding commodities could expand the opportunity set.
3.1. Dataset
The dataset used in this analysis was retrieved from Bloomberg. The Bloomberg ticker code for each variable is given between brackets. In order to analyze the behavior of both traditional and alternative asset classes, information was gathered on bonds, equities and commodities. The return on the six-month German bubill (GETB2 Index) was used as a proxy for the risk free rate.
The choice of indices to represent the exposure to the selected asset classes is very common, mainly for obtaining uniform transaction costs, assuring a minimum liquidity and providing similar platform for different asset classes. Such considerations are present over the literature such as in Cumming, Haβ and Schweizer (2011).
Bloomberg/EFFAS indices, calculated by the European Federation of Financial Analyst Societies, were chosen as the proxy for fixed income market investment. As the focus is set on the investment possibilities in the euro market, the Global Euro Index was selected as it provides exposure to a broad number of governments: Italy, Ireland, Austria, Netherlands, Spain, Portugal, France, Belgium, Germany and Greece. The investment opportunity set includes four different maturity buckets, comprising index portfolios ranging from 1 year to 10 years, a reasonable maturity scope for a central bank. Data was retrieved for the Total Return Index (EUGiTR Index – with i= 1, 2, 3 and 4).
Following Su and Keung (2010), exposure to commodities could be proxied by any of these three alternatives: through physical investment, using commodities futures or using indices. As indices were used for bond market exposure, the same approach was followed for commodities. The UBS Bloomberg Constant Maturity Commodity Index- CMCI - a diversified commodity index family made up of 27 components was chosen,
due to their unique investment approach, through forwards, and to an interesting feature, essential to the goal of the current analysis: providing a hedged index denominated in euros (XMCETR Index). Commodities are a very heterogeneous class, as it will be seen in more detail in the asset characterization; therefore data on all the subcomponents was gathered as well: energy (XMEETR Index), agriculture (XMAETR Index), industrial metals (XMIETR Index), precious metals (XMPMTR Index) and livestock (XMLETR Index). It’s worth to mention that, as comparison, data on the original USD index (CMCITR Index) and the respective subcomponents was retrieved as well.
As a word of caution, it must be noted that the choice of indices implies that both self-selection and survivorship bias must be acknowledged.
3.2. Methodology
The timeframe considered was from January 2000 to December 2011 and the analysis was based on a monthly frequency. First the logarithmic returns were calculated and the descriptive statistics were obtained for each asset class, with mean and variance/covariance matrices calculated for the whole set.
As a starting point it was considered that the central bank was investing reserves exclusively in the fixed income market, more precisely in the four bond indices mentioned in the dataset. An efficient frontier was constructed, based on the historical returns for the period ranging from 2000 to 2011. A hypothetical optimal portfolio was obtained by maximizing the Sharpe ratio (SR) for a given variance.
The mean variance optimization was done on a very straightforward approach, through the Excel solver function, also used, among others, by Bekkers and Lan (2009). As on the mentioned literature, cash was not included in the investment set. No duration restrictions were imposed. The only constraints present in the main scenario were that no negative weights were allowed, in line with the specific investor profile chosen. The optimization problem can be defined as follows:
Max (1)
∑ =1 and to prevent short-selling Target”
Where, SR is the Sharpe Ratio and is the risk free rate, both calculated from historical data, ( ) ∑ is the expected return of the entire portfolio that depends from the weights, w, and the expected return, E(R) of each i-asset included in the portfolio. ∑ ∑ ∑ is the portfolio variance, with i = 1, 2, 3, 4 considering the four bond indexes in the investment set available.
Subsequently, an alternative asset class – commodities – was added increasing the investment set (i=1, 2, 3, 4, 5) and the same optimization processes run again to assess whether any allocation would be given to commodities.
On a second stage, the expansion of the opportunity set, i.e. the alternative investment available, was restricted to a particular subset of commodities, precious metals, which are already part of several central banks reserve portfolios. The objective was to assess whether the referred subcomponent of the index would be enough to maximize the diversification benefits, thereby reducing the need to consider the other commodities available.
To provide a robustness check several additional analyses were subsequently performed. The time frame was divided in sub-periods, to illustrate the effects of the current financial crisis. The whole process was then applied to each of the periods: optimization with bond indices only and afterwards considering adding either commodities or just precious metals.
The only restrictions on the main analysis were no short-selling allowed. Following Bekkers and Lan (2009) the impact of imposing a maximum tracking error was considered, which is reasonable in order to minimize the transaction costs occurred. A maximum tracking error of 15% vs the original index weight in the “Bond only” portfolio was defined, i.e.:
Max (2)
∑ =1 and to prevent short-selling Target”
| | with being the weight attributed to index i in the original bond only optimization.
As a way to understand the importance of correlation and acknowledge in a simple approach the time varying effect, another optimization was done, considering a “what-if-analysis” whereby different ad-hoc correlations (zero and positive values) among the commodities index and the bond indices were tested, instead of the negative historical correlation that occurred on the time frame under analysis. Cumming, Haβ and Schweizer (2011), among others, have also tested the impact of changes in the correlation structure.
4. Investment Management and Asset Selection Process
The allocation among the different assets available is the most important decision when constructing a portfolio. To create an adequate portfolio a mandatory task is defining beforehand the goals to be achieved and the existing constraints. Only then should the focus be set in the available assets to decide which ones should be included.
4.1. The investment decision in a central bank perspective
From a central bank perspective, when building a reserve management portfolio, two apparently opposite objectives subsist. On one hand, the horizon to be considered is a long term one, with a goal to preserve the wealth of the country and to obtain adequate return on the investment; on the other hand, the capital has to be ready upon call, in the event of FX market intervention. Therefore liquidity, on at least a part of the portfolio, is of the essence.
On a more subjective tone, the reputational component cannot be overlooked: the investment policy has to be guided by rigorous ethical standards as the signals sent by the asset selection cannot be dissociated from the country policy and positioning in the world. Profit distribution also plays an important role, as it was seen by Ramaswamy (2008), creating further incentive to the conservative investment approach: the desire for low volatility of returns is linked with the usual pattern of profit distribution to the state. Moreover, in case of losses, the symmetrical effect, i.e. capital increase, would not necessarily apply.
The numeraire currency is usually the local currency therefore all foreign investments have to be converted for reporting purposes.
4.2. Traditional assets: bonds and their evolution during the last decade
Bonds and equities have long been considered as the traditional asset classes, along with cash holdings. However, as far as reserve management is concerned, equities lack some of the most important features: despite the attractive performance on a long term perspective, the volatility of the returns is undesirable for a central bank. Therefore, the investment on the fixed income market has been the main choice of central banks so far.
Even though the expected returns are usually low, bonds are regarded as a very safe investment. The average return will be lower than other traditional asset classes, such as stocks, but that loss of return is seen as the price to be paid for lower uncertainty associated with the smaller variance of returns.
When considering the particular case of the Euro area fixed income market, since the beginning of the decade, the safe haven status along with stable growth perspectives and tight control on inflation were, apparently, the perfect environment for bond portfolio management. The size of the debt market, combining the previously local currency denominated issuance of the member countries provided enough liquidity for the investors, in particular large institutional ones, such as the central banks. However, on the last couple of years, growing concerns on debt sustainability dramatically increased the yields of those countries perceived to be in risk. The spiraling effect has expanded the effects to other jurisdictions outside the originally affected ones, raising concerns on the Eurozone debt market as a whole.
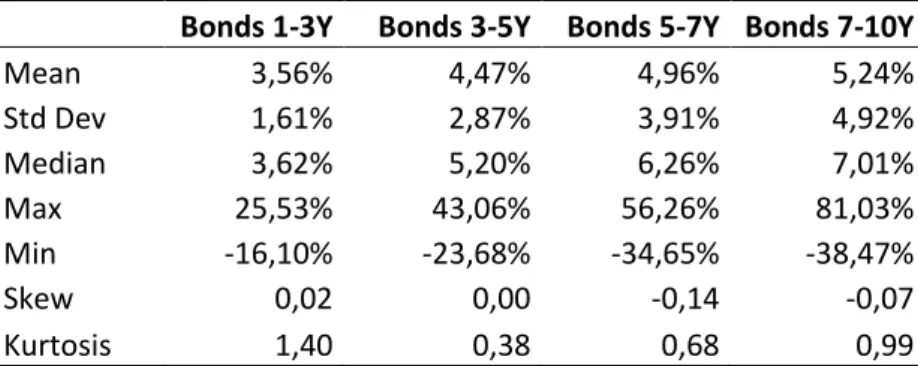
The descriptive statistics for the bond indices behavior, on Table 1, show that even though returns are positive on average, a substantial dispersion remains.
Table 1: Main descriptive statistics for the monthly returns on the bond indices for the 2000-2011 period (monthly data).
Bonds 1-3Y Bonds 3-5Y Bonds 5-7Y Bonds 7-10Y
Mean 3,56% 4,47% 4,96% 5,24% Std Dev 1,61% 2,87% 3,91% 4,92% Median 3,62% 5,20% 6,26% 7,01% Max 25,53% 43,06% 56,26% 81,03% Min -16,10% -23,68% -34,65% -38,47% Skew 0,02 0,00 -0,14 -0,07 Kurtosis 1,40 0,38 0,68 0,99
The increase in the volatility of returns put into question the benefits of holding bonds and opened the door for further consideration in diversification. As we can see below, on Figure 1, the volatility has been increasing substantially on the last couple of years:
Figure 1: Evolution of the volatility of returns on the bond indices considered from 2000 to 2011. The annual standard deviation of returns was calculated from the monthly
returns and annualized.
Bonds are now being perceived as “the new risk asset” and therefore the status quo earned on the last twenty years is being challenged. Therefore it is sensible to rethink the global allocation of investment portfolios, in particular the risk adverse ones.
4.3. Alternative Assets: commodities and their evolution during the last decade
Commodities were traditionally not regarded as part of the investment universe. When considering the volatility of returns, it’s similar to equities and it can be argued that therefore it’s an equally undesirable asset for a reserve management portfolio. However, there is a very important difference to be considered. In the recent past, several crises in the financial markets emphasized the degree of correlation among stocks and bonds. Cumming, Haβ and Schweizer (2011) considered that the losses experienced in stocks and bonds during the Asian crisis in 1997, Russia crisis in 1998, “dotcom” bubble in 2000 and terrorist attack to WTC in 2001, were an important driver for the search for diversification. As the return drivers for commodities are different, added value is undeniable during volatile market phases.
The analysis of main risk drivers of commodities is essential to understand the diversification benefits. First it is essential to be aware that commodities are a very heterogeneous asset class. Therefore, the return drivers diverge, and so does the volatility, as it can be seen on Table 2:
Table 2: Main descriptive statistics for the monthly returns on the commodities indices from 2000 to 2011 (monthly data) based on the data for the UBS-CMCI index – hedged in EUR. Index Total Energy Agriculture Industrial M. Precious M. Live Stock Mean 12,48% 14,63% 8,42% 11,49% 13,84% 3,56% Std Dev 16,92% 26,49% 19,06% 22,65% 18,81% 13,14% StdDev/Mean 1,36 1,81 2,26 1,97 1,36 3,69 Median 23,63% 24,08% 13,34% 7,73% 21,97% 3,90% Max 293,37% 742,41% 439,58% 790,53% 351,79% 214,24% Min -95,05% -97,42% -88,81% -97,51% -92,31% -72,82% Same calculations were done in the original currency, USD, with very similar results, due to the currency hedging, as the UBS CMCI index provides a currency-hedged version in EUR, among others, to protect the non USD based investors from variations in currency exchange rates.
It should be noticed however that, among others, Baffes and Haniotis (2010) showed commodity prices follow a non-stationary behavior: “variability is such that the average price does not exist in the statistical sense”. That pattern is clear when looking at Figure 2:
Figure 2: Evolution of the UBS CMCI total return index from 2000 to 2011.
Commodities work in clusters: each one of them has different risk drivers and therefore they are very similar inside the same group and very disconnected to commodities from other subgroups. Precious metals have long been considered as an alternative currency and as a hedge against inflation. On the other hand, industrial metals and energy are connected to economic growth and, finally, agriculture and livestock are linked to population growth. Therefore, by investing in those indices, exposure to different risk drivers ensures a better diversification.
One of the most recent concerns is that the recent drive to invest in the commodities market is causing a price bubble. In fact, as pointed by Baffes and Haniotis (2010), the money invested in commodities indices is small when considering the total value of pension and wealth funds but considerable for the commodity markets total market value. Studies haven’t demonstrated so far whether it can be considered as an important factor. However it identifies the need to follow the so-called “financialization” of commodities that will probably imply an increase in the degree of correlation in the future.
One of the explanations frequently mentioned in literature for the high return/high Sharpe ratio of commodities is that they work as a compensation for the so called “Peso Events”: extremely rare but very negative outcomes. So far it hasn’t been established as empirically valid argument but it remains a possibility.
4.4. Commodities as a suitable diversifier for fixed income reserve portfolio
To sum up, the concentration in a single asset class is inefficient as the benefits of diversification are not taken into consideration. Furthermore, in the actual context, fixed income portfolios, which have been the preferred investment vehicle for central banks, no longer provide the stable return and low volatility that was the main reason for their choice.
Commodities provide a suitable natural diversifier as they are driven by different risk factors and a low or even negative correlation with bonds prevails. The usual assumption is that correlation structures between assets remain constant over time. Nonetheless, during crisis periods, the different assets tend to behave more similarly therefore correlations tend to increase, as seen by Fernandes and Ornelas (2010): “During financial crisis assets correlations tend to increase reducing the benefits of diversification juts when it would be most needed”. The exception applies to gold: regarded as safe haven doesn’t show the same pattern of behavior – see Daskalaki and Skiadopoulos (2011).
However, when taking into consideration the database used on the current analysis, the correlation followed a different pattern, as it can be seen in Table 3:
Table 3: Evolution of the correlation between the four bond indices, commodities and gold (precious metals) before the crisis (Panel A) and during the crisis (Panel B).
Column 1 shows that the correlation between commodities (CMCI index) and the four bond indices (from 1 year to 10 years) – negative through the whole period - decreased further during the crisis period (Panel B) when comparing with the period before the crisis (Panel A). It must be pointed however that the effects of working with indices and not directly with the asset plays a major role in the results obtained.
It’s also interesting to see that in the case of gold (column 2 on the matrix), due to the safe haven status, correlation changed from slightly positive to negative as the investors followed the usual pattern of taking refuge on the precious metals.
Panel A: Correlation before the crisis (Jan00 to July07)
CMCI Gold 1y_3Y 3Y_5Y 5Y_7Y 7Y_10Y
CMCI 1,000000 Gold 0,431683 1,000000 1y_3Y -0,164288 0,053239 1,000000 3Y_5Y -0,088454 0,062113 0,960408 1,000000 5Y_7Y -0,066448 0,039983 0,908761 0,986401 1,000000 7Y_10Y -0,045088 0,004385 0,829217 0,941144 0,981705 1,000000 Panel B: Correlation during the crisis (Aug07 to Dec11)
CMCI Gold 1y_3Y 3Y_5Y 5Y_7Y 7Y_10Y
CMCI 1,000000 Gold 0,510494 1,000000 1y_3Y -0,305601 -0,115270 1,000000 3Y_5Y -0,347660 -0,097094 0,937040 1,000000 5Y_7Y -0,306585 -0,065951 0,859240 0,969687 1,000000 7Y_10Y -0,243127 -0,034170 0,755706 0,895501 0,966846 1,000000
5. Empirical Results
The results obtained after running the optimization for the different investment sets are detailed in the current section. The robustness checks considered, and the respective outcome are also presented here.
5.1. Brief review of the methodology
As explained previously, based on the monthly logarithmic returns an optimal portfolio was obtained by maximizing the Sharpe ratio (SR), subject to two constraints: only long positions were allowed, i.e. wi≥0, and maximum monthly variance of 0.00005 -
corresponding to an annualized standard deviation of 1.32%. The risk free rate considered was the return obtained on the 6 month bubill (German Treasury bill). The same calculations were done for different risk aversion targets as measured by the allowed maximum variance (more precisely: maximum monthly variance of 0.00004 and 0.00006), in order to derive an efficient frontier for each investment set. The results presented here were annualized, for a better intuition, even though all the calculations were based on monthly data. Table 4 summarizes the returns and standard deviation from our sample in the considered period.
Table 4: This table shows the returns and standard deviations, considering the 2000-2011 period and the sub-periods.
5.2. Investment set 1: Optimal portfolio with bonds only
As a starting point, the investment set included four EFFA Eurozone bond indices, with maturities between 1 and 10 years, which constitutes an appropriate investment, set for a central bank, both in terms of instruments and maturity spectrum.
(Anualized)
Index E(r) Stdev E(r) Stdev E(r) Stdev
1y_3Y 3,56% 1,61% 3,75% 1,24% 3,23% 2,11% 3Y_5Y 4,47% 2,87% 4,52% 2,46% 4,40% 3,49% 5Y_7Y 4,96% 3,91% 5,16% 3,33% 4,60% 4,79% 7Y_10Y 5,24% 4,92% 5,73% 4,11% 4,40% 6,11% CMCI 12,48% 16,92% 19,53% 11,57% 1,33% 23,27% CMCI_Gold 13,84% 18,81% 10,95% 14,42% 18,98% 24,70%
For reasons of simplicity, only the final outcomes of the optimization process will be referred to in the main text1.
After running the optimization, the outcome was a portfolio with 31% on the 1 to 3 years bond index and 69% on the 3 to 5 year index. The SR was 1.27 and the expected return was 4.19%, as seen in Figure 3:
5.3. Investment set 2: Optimal portfolio when commodities are added
An alternative investment, commodities, through the use of the UBS CMCI index, in euro denomination, was added to the previous investment set. The same optimization process was run and a new portfolio was obtained, as shown in Figure 4.
The new portfolio had a 34% allocation in the 1 to 3 year bond index, 55% in the 3 to 5 year bond index and an 11% allocation to the commodities index. The inclusion of commodities clearly expanded the efficient frontier, resulting in a 5.02% expected return and a 1.91 SR.
1 The detailed information and calculation will be available upon request.
Figure 3: This pie chart shows the allocation after optimizing the data when restricting the investment set to bond indices.
EFFA 1-3Y 31% EFFA 3-5Y
69%
Figure 4: This pie chart shows the allocation when expanding the original investment set - bond indices – to include commodities.
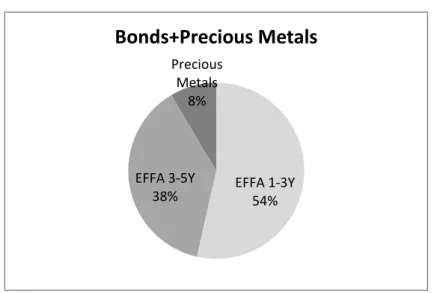
5.4. Investment set 3: Optimal portfolio with precious metals
When considering central bank reserves, besides fixed income, the investment in gold is sometimes considered, for historical reasons, as it is already part of the holdings of several central banks worldwide. Currently, the sale of gold within Eurozone central banks is restricted by an agreement among the euro system members. Furthermore, gold is seen as a protection against inflation. Therefore it makes sense to consider a different alternative: expanding the original investment efficient set by adding gold only, i.e. investing on the precious metals sub-index only.
The portfolio obtained after the optimization had 54% in the 1 to 3 year bond index, and 38% in the 3 to 5 year index. The allocation to precious metals was 8%. The expected return was 4.75%, with a 1.7 SR.
EFFA 1-3Y; 34% EFFA 3-5Y; 55% Commodities 11%
Bonds+Commodities
Figure 5: This pie chart shows the allocation when expanding the original investment set - bond indices – to include precious
metals.
5.5. Comparative Results
As it can be seen, even though the results from adding precious metals are also superior to the bond only portfolio, investing in all the commodities is the best solution considering the dataset and methodology. The comparative results are summarized in on Table 5.
Table 5: This table shows the portfolio composition for the three different investment sets, considering the 2000-2011 period.
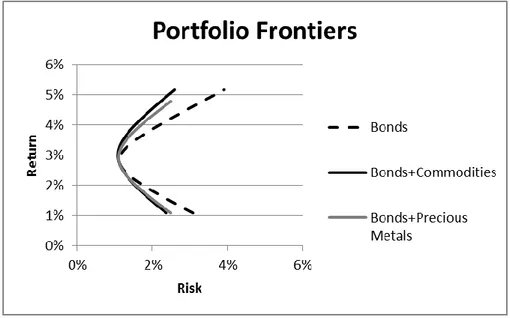
Considering the original investment set and the alternative assets added, there was an expansion of the efficient frontier, on both alternatives, as it can be seen graphically on Figure 6: EFFA 1-3Y 54% EFFA 3-5Y 38% Precious Metals 8%
Bonds+Precious Metals
Return/Sharpe (Anual)Annualized results Return SR EFFA 1-3Y EFFA 3-5Y EFFA 5-7Y EFFA 7-10Y Commodities Precious Metals
Bonds Only 4,19% 1,27 31% 69% 0% 0% -
-Bonds+Commodities 5,02% 1,91 34% 55% 0% 0% 11%
-Bonds+Precious Metals 4,75% 1,70 54% 38% 0% 0% - 8%
Figure 6: This graph shows the different portfolio frontiers calculated for the three investment sets considered.
The results are in line with what should be expected: the existing negative correlation of bonds with commodities and the close to zero correlation with precious metals generated superior results when diversifying from a fixed income portfolio to commodities in general or to precious metals only in particular. Therefore an increase in the Sharpe ratio is achieved, as seen in Figure 7:
Figure 7: This graph shows the expected return and the Sharpe Ratio for the three investment sets considered.
6. Robustness Checks
In an attempt to check the strength of the results, several robustness tests were made, as described in the following section.
6.1. Stability over subsample - Considering two periods (before/crisis)
The empirical results obtained, described in the previous chapter, could be a reflection of the financial crisis, i.e. the allocation to commodities/precious metals could be due only to the search of a safe haven away from the fixed income turbulence on that particular scenario. Therefore, it’s important to test that hypothesis by repeating the same process for the two subsamples: before and during the crisis.
6.1.1. Before the crisis: from January 2000 to July 2007
The bond only portfolio for the first period, obtained through a similar optimization process, consisted of 55% of the 1 to 3 year bond index and 45% of the 7 to 10 year bond index. The expected return was 4.65% and SR was 1.20.
When commodities were added, the allocations were 70% to the 1 to 3 year bond index and 10% to the 7 to 10 year bond index, with a 20% allocation to commodities. The expected return increased to 6.89% and the SR to 2.91.
Considering only the precious metals sub-index, the optimization defined a 58% allocation to the 1 to 3 year bond index, 32% to the 7 to 10 year bond index and 10% to precious metals. The expected return was 5.08% and the SR was 1.53.
The results showed a similar pattern to the ones obtained when the total period was considered: superior results by adding either commodities or precious metals to the original bond only hypothesis. The bonds and commodities portfolio obtained the better SR. Therefore, the conclusions stand when we exclude the crisis period, as it can be seen on Table 6:
Table 6: This table shows the portfolio composition for the three different investment sets, considering only the sub-period before the crisis.
Once again, considering the investment set done and the alternative assets added, there was an expansion of the efficient frontier, on both alternatives, as it can be seen on Figure 8:
Figure 8: This graph shows the different portfolio frontiers calculated for the three investment sets considering only the period before the crisis.
6.1.2. During the crisis: from August 2007 to December 2011
Taking into consideration the time frame after the onset of the so-called financial markets crisis, the bond only portfolio allocated 72% to the 1 to 3 year period bond index and 28% to the adjacent index, covering 3 to 5 year bonds. The expected return was 3.56% and the SR 1.50.
With commodities included in the investment set, there was a 52% allocation to the 1 to 3 year bond index, 44% to the 3 to 5 year bond index and 4% allocation to commodities. The expected return was 3.68% and the SR 1.60.
Return/Sharpe (Anual)
Annualized results Return SR EFFA 1-3Y EFFA 3-5Y EFFA 5-7Y EFFA 7-10Y Commodities Precious Metals
Bonds Only 4,65% 1,20 55% 0% 0% 45% -
-Bonds+Commodities 6,89% 2,91 70% 0% 0% 10% 20%
-Bonds+Precious Metals 5,08% 1,53 58% 0% 0% 32% - 10%
Restricting the alternative investment to precious metals only, the allocation was the following: 86% to the 1 to 3 year bond index, 8% to the 3 to 5 year bond index and 6% to precious metals. The expected return was 4.26% with a 2.03 SR. It should be noted that, contrary both the total period and the before crisis period, the performance when including only precious metals was superior to considering the whole basket of commodities, as summarized on the following table:
Table 7: This table shows the portfolio composition for the three different investment sets, considering only the sub-period during the crisis.
The image on the efficient frontier graph shows clearly that adding commodities was only slightly superior to investing on fixed income only. The main reason can be seen when looking into the average return on commodities for the crisis period2: considerably lower than any of the bond indices despite the significant risk, which translates into a low Sharpe ratio. Only the presence of negative correlation explains the inclusion on the optimal portfolio.
On a different note, including precious metals was clearly the wiser choice during the crisis period, a result that confirms the idea of gold as safe haven during crisis.
2 See Table 4
Return/Sharpe (Anual)
Annualized results Return SR EFFA 1-3Y EFFA 3-5Y EFFA 5-7Y EFFA 7-10Y Commodities Precious Metals
Bonds Only 3,56% 1,50 72% 28% 0% 0% -
-Bonds+Commodities 3,68% 1,60 52% 44% 0% 0% 4%
-Bonds+Precious Metals 4,26% 2,03 86% 8% 0% 0% - 6%
Figure 9 : This graph shows the different efficient frontiers calculated for the three investment sets considering only the crisis period.
6.2. Imposing a maximum tracking error vs. original bond portfolio There is a very important point to be acknowledged when adding restrictions to the optimization process: fewer constraints produce bigger Sharpe ratios. Therefore, by considering a maximum tracking error - in this case 15% deviation in each instrument/index from the original “Bond only” portfolio – we will obtain a “suboptimal” solution, in exchange for a minimization of the transaction costs and, more important from a central bank perspective: avoid being perceived as a volatile investor by performing significant changes in the portfolio.
The results obtained, as seen in Table 8 below, show that due to the tracking error constraint, the results are inferior to the original version, with the exception of the situations where it doesn’t change the original distribution, i.e. the restriction is not active (as in the bond and commodities for all the period). The explanation lies in the original optimization returns being similar to the original bond only portfolio and therefore the restriction is almost “not active”.
Table 8: This table shows the change in the portfolio composition due to the maximum tracking error of 15% for each component vs. original bond only portfolio.
6.3. Sensitivity analysis of the optimal portfolio to change in correlation between bonds and commodities
The search for the optimal portfolio relies not only in mean variance analysis, thereby assuming a normal distribution of returns, but also on the hypothesis that correlations are not time-varying. A practical way to test is considering whether different correlations would jeopardize the results obtained. Considering the analysis done, it has been stated already that the crisis situation can increase the correlation among the different assets, even those with an historically negative correlation. Therefore the ad-hoc hypothetical increase of the correlation between bonds and commodities provides a very straightforward robustness check.
As it can be seen in Table 9 below, even though the allocation to commodities decreases, resulting as expected in a lower return and smaller SR, it still remains in the portfolios thereby confirming that some diversification benefits still prevail. The only exception is the crisis period, where they are removed from any significant allocation.
Return/SR (Annualized)
All period Return SR EFFA 1-3Y EFFA 3-5Y EFFA 5-7Y EFFA 7-10Y Commodities Precious Metals
Bonds+Commodities 0,00% 0,00 0,00% 0,00% 0,00% 0,00% 0,00% NA Bonds+Precious Metals -0,04% -0,03 -14,05% 15,89% 0,00% 0,00% NA -1,84% Before Crisis Bonds+Commodities -0,23% -0,18 -16,11% 0,00% 0,00% 20,36% -4,25% NA Bonds+Precious Metals 0,00% 0,00 0,00% 0,00% 0,00% 0,00% NA 0,00% During Crisis Bonds+Commodities -0,02% -0,01 5,12% -3,77% 0,00% 0,00% -1,36% NA Bonds+Precious Metals 0,00% 0,00 -4,27% 4,67% 0,00% 0,00% NA -0,40%
Portfolio Change due to Tracking Error restrictions (max 15%) Portfolio Composition
Table 9: This table shows the change in the portfolio composition when considering an
ad-hoc increase in correlation among bonds and commodities: from the original negative values
to three hypothetical values ranging from 0 to 0,5.
The same sensibility analysis can be applied to the correlation between bonds and precious metals.
Bonds +Commodities
Annualized results Return SR EFFA 1-3Y EFFA 3-5Y EFFA 5-7Y EFFA 7-10Y Commodities
Period 2000-2011 Original Correlation 5,02% 1,91 34% 55% 0% 0% 11% Correlation (0) 4,69% 1,65 52% 39% 0% 0% 9% Correlation (0,25) 4,45% 1,47 62% 31% 0% 0% 7% Correlation (0,5) 4,29% 1,35 62% 33% 0% 0% 5% Before Crisis Original Correlation 6,89% 2,91 70% 0% 0% 10% 20% Correlation (0) 6,66% 2,73 72% 0% 0% 9% 18% Correlation (0,25) 6,30% 2,45 83% 0% 0% 0% 17% Correlation (0,5) 5,99% 2,22 85% 0% 0% 0% 15% During Crisis Original Correlation 3,68% 1,60 52% 44% 0% 0% 4% Correlation (0) 3,56% 1,50 72% 28% 0% 0% 0% Correlation (0,25) 3,56% 1,50 72% 28% 0% 0% 0% Correlation (0,5) 3,56% 1,50 72% 28% 0% 0% 0%
7. Conclusion
It’s indisputable that concentration in a single asset class increases the risks and a proper diversification process cannot be replaced by the broadening of the bond market investment within itself, such as investment in emerging markets (expansion of geographical exposure) or in inflation-linked bonds (focus on instrument selection).
The results obtained show that, under a mean variance optimization process, and using a database comprising monthly indices returns in the Eurozone from 2000 to 2011, there was an efficiency gain when expanding the investment set from fixed income into commodities. The existence of negative correlations of returns – bonds and commodities - or even slightly positive correlation of returns – bonds and precious metals – have theoretically a potential to contribute for a decrease in the risk profile of a given portfolio through a diversification process. The portfolios obtained after including commodities/precious metals indices had a bigger Sharpe ratio than the original bond index portfolios. Therefore the diversification obtained by adding either commodities or only a subset of the class – precious metals – clearly offers an improvement of the performance of the portfolio, which originally only included fixed income.
The analysis was based on the first two moments of the distribution: mean and variance which constitute the pillars of mean variance models. The analytical simplicity added to the use of an historical database has some shortcomings, namely in terms of uncertainty regarding what can be expected in terms of future developments3. However it sets the ground for considering the same question using other analytical tools, such as considering scenario analysis instead of historical data, or a mix of both.
Even though the current analysis is restricted to the first two moments of the distribution of the returns, i.e. mean and standard deviation, it’s interesting to observe that the reviewed literature shows that in terms of the higher moments, commodities’ returns exhibit a positive skew on the long run (considering the last 35/50 years), indicating a lower downward risk that can be appealing to investors. When shorter time spans are considered, i.e. the last 10 to 20 years, the asymmetry can be negative,
3 A feasible alternative would be to model the historical volatilities and structure of covariances (ARCH,
GARCH) or calculate the implicit volatilities incorporated on derivatives (options) that have those assets as underlying.
implying totally different effects. Therefore, the investment horizon being considered has to incorporate that notion, suggesting more research can be done in that field. However, the reporting period for a central bank will coincide with the legal year, therefore, even if ideally the investment horizon for a part of the portfolio is long-term oriented, most of the asset allocation optimization will be conducted with a yearly prospect.
As a final note, it is important to remember that asset allocation explains most of the return in a portfolio; therefore it deserves not only careful consideration but also an emphasis on diversification, especially in the current times of additional uncertainty.
8. References
Aizenman, J., & Glick, R. (2010). Asset Class Diversification and Delegation of Responsabilities
between Central Banks and Sovereign Wealth Funds. Working Paper Series, Federal
Reserve Bank of San Francisco, Economic Research Department.
Baffes, J., & Haniotis, T. (2010). Placing the 2006/2008 Commodity Price Boom into Perspective. Policy Research Working Paper, The World Bank, Development Prospects Group. Bekkers, N., Doeswijk, R. Q., & Lam, T. W. (2009, October). Strategic Asset Allocation:
Determining the Optimal Portfolio with Ten Asset Classes. Retrieved from SSRN:
http://ssrn.com/abstract=1368689
Bernstein; Damodaran. (s.d.). Investment Management. Wiley Finance.
Bloomberg/EFFAS Bond Indices. (s.d.). (Index Description Page, Characteristics and
Constituents).
Buckle, D. (2011). Commodities in a multi-asset portfolio. Reserve Management Seminar for
Sovereign Institutions (UBS).
Campbell, J. Y., & Viceira, L. M. (2001). Strategical Asset Allocation: Portfolio Choice for Long-Term Investors.
Cheung, C. S., & Miu, P. (2010). Diversification benefits of commodity futures. Journal of
International Financial Markets, Institutions & Money.
Cumming, D., Haβ, L. H., & Schweizer, D. (2011). Strategic Asset Allocation and the Role of
Alternative Investments. Retrieved from SSRN: http://ssrn.com/abstract=1091093
Daskalaki, C., & Skiadopoulos, G. (2011). Should investors include commodities in their
portfolios after all?New evidence. University of Piraeus, Department of Banking and
Financial Management.
Dias Curto, J. (s.d.). Métodos Quantitativos Aplicados (apontamentos da aula).
Fabozzi, F. J., & Markowitz, H. M. (s.d.). The theory and practice of investment management. Wiley Finance.
Fernandes, J. L., & Ornelas, J. R. (2010). The Benefits of International Portfolio Diversification. Obtido de SSRN: http://ssrn.com/abstract=1605425
Israelsen, C. (2011). Obtido de www.7TwelvePortfolio.com
Kat., H. M. (2006). How to Evaluate a New Diversifier with 10 Simple Questions. Cass Business School, Alternative Investment Research Centre.
Oliveira, L., Curto, J., & Nunes, J. (2011). The determinants of sovereign credit spread changes in the Euro-zone. Journal of International Financial Markets, Institutions & Money. Ramaswamy, S. (2008). Managing international reserves: how does diversification affect
financial costs? BIS Quarterly Review, pp. 45-55.
Roache, S. K. (2008). Commodities and the Market Price of Risk. IMF Working Paper (WP/08/221), International Monetary Fund.
Schneeweis, T., Karavas, V. N., & Georgiev, G. (2002). Alternative Investments in the
Institutional Portfolio. Alternative Investment Management Association (AIMA).
Shwayder, A., & James, A. (2011). Returns to the Commodity Carry Trade. Northwestern University.
Societe Generale Index. (2010). Multi Asset Portfolio.
Su, Y., & Keung, M. L. (2010). Strategic Asset Allocation and Intertemporal Hedging Demands:
with Commodities as an Asset Class. Retrieved from SSRN:
http://ssrn.com/abstract=1700726
Terhaar, K., Staub, R., & Singer, B. (2003). Appropriate Policy Allocation for Alternative Investments. The Journal of Portfolio Management, 101-110.
UBS. (n.d.). UBS Bloomberg CMCI - Technical Document. Retrieved 2011, from CMCI: htpp://www.ubs.com/cmci