APPLICATIONS OF SOLAR MAPPING IN THE URBAN ENVIRONMENT T. Santos a*, N. Gomes b, S. Freire a, M.C. Brito c, L. Santos b, J.A. Tenedório a
a e-GEO - Research Centre for Geography and Regional Planning, Faculdade de
Ciências Sociais e Humanas (FCSH), Universidade Nova de Lisboa, Avenida de Berna, 26 C, 1069-061 Lisboa, Portugal (teresasantos, sfreire, ja.tenedorio) @fcsh.unl.pt
b IN+, Center for Innovation, Technology and Policy Research, Instituto Superior
Técnico, Oeiras, Portugal, (nuno.gomes, luis.f.santos)@dem.ist.utl.pt
c IDL, Faculdade de Ciências da Universidade de Lisboa, Campo Grande, 1749-016
Lisboa, Portugal, mcbrito@fc.ul.pt Abstract
Solar mapping in the urban environment using Geographic Information Systems (GIS) provides powerful tools for urban planning, policy analysis and promotion of clean and renewable technologies.
Detailed qualitative and quantitative information about the built environment can be obtained from many sources, namely from Light Detection and Ranging (LiDAR) data. The aim of this paper is to assess photovoltaic (PV) potential of residential buildings, using GIS-based models and LiDAR data. This method enables the analysis of roofs according to their slope, azimuth, and shaded areas. In order to achieve that goal, a two-folded methodology is proposed and tested in Lisbon, Portugal. Firstly, the income of solar energy at the roof tops is modeled. Then, population at the building level is assessed allowing for the estimation of the local electricity demand. Based on this model, different research questions can be addressed: where are the most interesting roofs for solar applications? who owns them? how much energy is consumed locally? We calculate that the total PV potential of the 693 residential buildings identified in the study area is 3202 MWh/year. That value is about 25% of the local electricity demand. It is shown that a large fraction of the most interesting roof areas for solar application is available at buildings with multiple-ownership. This suggests that incentives policies should facilitate the use of these communal areas.
Key Words: Photovoltaic potential; LiDAR; GIS; Solar radiation; Urban
1. Introduction
Local governments are responsible for applying in their cities, strategic guidelines to improve energy efficiency based on renewable sources. In this context, remote sensing technologies can be an effective source of updated geo-information about the urban environment. Through the generation of energy demand and supply scenarios for the city, urban planners and city officials can obtain accurate assessments and decide upon realistic sustainable goals.
Solar energy is one of the best renewable energy sources, having the least negative impacts on the environment (Solangi et al., 2011). Assessing the city’s solar energy potential through solar mapping, constitutes a valuable analytical tool that permits quantifying local capabilities for energy production and use those findings for designing and implementing urban planning energy strategies, in line with sustainable
development goals and aims.
Furthermore, solar maps can be updated on a regular-basis and thus used for monitoring effects of policy application. Energy production and replacement of fossil fuels by renewable sources, along with energy savings on the demanding side (Lund, 2007),
constitute the basis for sustainable energy policies that are concerned with reducing dependence on fuel fossils, thus gaining in environmental benefits. Such policies can include new legislation and incentives to investment. Knowing the solar energy
generation installed capabilities, the geographical distribution and characteristics of the best places for implementing solar systems, can lead to effective expansion of
distributed generation of renewable energy in the city.
The residential sector plays an important role in cities’ electricity consumption. In Lisbon, capital city of Portugal, about a third of the electric intake is absorbed by the residential sector (Ferreira e Pinheiro, 2011). Its main uses are lighting and powering home appliances. Solar technology in Portugal is already being valued via the
implementation of European Union Directives (Directive 2002/91/EC). This new awareness, associated with the fact that Portugal is one of the European countries with the highest levels of annual solar irradiation (Šúri et al., 2007), contributes to a growing interest in the quantification of energy-based indicators at the city and building’s scale, in order to assess photovoltaic (PV) conversion and thermal solar potential. In fact, 50% of the electricity consumed in the country is already generated through renewable sources, mainly hydropower (DGEG, 2011), but solar systems can be implemented locally and used alternatively. In order to propose technical and financial solutions, data on the solar power generating potential of the city is required.
Planning for energy investments on solar systems requires information on 1) the electric power demand, and 2) on the generation capabilities of those systems. Methodologies for energy planning have been addressed in the literature (Mourmouris and Potolias, 2013; Cellura et al., 2012; Ordónez et al., 2010; Wiginton et al., 2010; Izquierdo et al., 2008; Gadsden et al., 2003). These studies deal with energy consumption models and the contribution of solar systems for fulfilling that demand. However, either the built structure was not modeled in detail (e.g., Mourmouris and Potolias, 2013; Wiginton et al., 2010; Izquierdo et al., 2008), or it was made through the use of statistical data, or 2D maps obtained from imagery analysis (e.g., Ordónez et al., 2010; Cellura et al., 2012). Consequently, the incoming solar irradiation at the rooftop was not too accurately estimated.
As far as the generation capabilities of the solar systems, it is important to highlight that to adopt solar technologies, detailed solar suitability information on every building in a community should be available for urban planners (Santos et al., 2011a). Identifying buildings that are suitable for solar panel installation requires modeling 1) the built environment, 2) the solar irradiation and, 3) the available area at the rooftops for panels’ installation. In the following paragraphs each of these issues is discussed in detail. Modeling urban environments can be a difficult task. According to the scale of analysis, it can be a more or less detailed process. Several methods for data acquisition are commonly used in this context. Bergamasco and Asinari (2011) segmented aerial images to obtain estimations of the available roof area. Wiginton et al. (2010) explored the relationship between population and roof area for estimating PV potential, while Izquierdo et al. (2008) computed roofs’ PV potential using indirect data (e.g., land use, population and building densities) and statistically representative stratified-sampling of vector maps of urban areas. More precise 3D information focused on buildings can be compiled, through the use of topographic information (e.g., from the land registry), in combination with laser measurement data (e.g., as obtained from a LiDAR flight), and aerial or satellite images. Nowadays, airborne LiDAR has become an accurate,
cost-effective alternative to conventional technologies for the creation of altimetric data at vertical accuracies that range from 0.15 to 1 m (Hill et al., 2000; Gamba and
Houshmand, 2002; Kaartinen et al., 2006). A LiDAR product consists on a point cloud with elevation information for each location. Two initial raster products can be obtained from that data set: the Digital Terrain Model (DTM) and the Digital Surface Model (DSM). DTM is a bare earth model with all raised objects above the terrain removed, while the DSM has the ground values included and raised objects above the ground (e.g. trees, buildings, cars, etc.). There are several approaches to interpolate and construct a 3D urban surface model (incorporating the relief), based on LiDAR and GIS buildings data (e.g., Kodysh et al., 2013; Tack et al., 2012; Santos et al., 2011a; Carneiro et al., 2008). Other authors identify buildings in the DSM using features such as local height differences, curvature, height differences, local homogeneity of surface normals, etc. (e.g., Brédif et al., 2013, Vögtle et al., 2005; Rottensteiner et al., 2003).
The incident solar radiation can be measured by ground-based meteorological stations or meteorological satellites and/or be estimated through models. There are several solar models available in the literature. They vary in the detail of the input parameters and, consequently, in the output map. Solar Analyst (Fu and Rich, 1999) and Photovoltaic Geographical Information System (PVGIS) (Šúri et al., 2005) are two examples of solar radiation models. Solar Analyst is suitable for local-scale applications. Taking into account a user specified model (a DTM or, more desirable, a DSM), and further parameters such as transmissivity and diffuse radiation fraction, among others, the model accounts for atmospheric effects, as well as site latitude and elevation, steepness (slope) and compass direction (aspect), daily and seasonal shifts of the Sun angle, and effects of shadows cast by surrounding topography. On the other hand, PVGIS operates on a lower scale, and accounts for sky obstruction (shadowing) by local terrain features (hills or mountains), based on a digital elevation model (USGS Shuttle Radar
Topography Mission).
Manipulating the solar resources at the building level within a GIS is a straightforward way of identifying appropriate roof areas for panel installation. Applying algorithms to automatically classify and segment data, enables analyzing buildings’ roofs according to their slope, azimuth, and shaded areas (Santos, 2011b). Knowing the amount of incident solar radiance and the optimal roof areas for capturing that energy, the solar potential of any roof plane can be easily calculated (e.g., Kodysh et al., 2013; Brito et al., 2012; Jochem et al., 2009; Hofierka and Kaňuk, 2009; Kassner et al., 2008; Rottensteiner et al., 2005). This analysis has also been extended to include solar potential of facades and other vertical surfaces (Redweik et al., 2013).
Solar energy incentive schemes constitute a planning tool for promoting and reinforcing the dissemination of PV projects in the residential sector. The most common financial incentives are based on Feed-in Tariffs (FIT). In this framework, the energy generated by renewable energy technologies benefits from a rate, generally higher than the
electricity market prices. So far, this incentive has had low impact on the deployment of photovoltaics in Portugal, due to a number of reasons including procedural barriers, capping limit for installed power, perceived legislative instability, etc.
Besides injection to the grid via a FIT, rooftop owners can explore their roofs in two ways: by installing solar panels for self-consumption (under net metering incentive schemes), or by leasing the space to a developer.
In the present study, the contribution of PV systems is tested using a 3D model of the buildings based on LiDAR data. This approach allows for a detailed estimation of the energy generation through PV since the shadows cast by surrounding buildings and topography, are calculated for each building in the area. The results are presented in two rooftop exploration scenarios - considering the investment in PV panels for fulfilling electricity demand at the building level and, alternatively, by renting the roof space to third parties and receiving benefits from it.
The methodology is exposed in section 2 and results of its implementation in a study area located in Lisbon, Portugal are presented and discussed in section 3.
2. Methodology
The methodology is a two-step process. Firstly, PV generation potential of the rooftops is calculated based on the solar incidence on each roof and the available area. Then, the resident population in each building is estimated. Based on the combination of these outputs, two models of rooftop PV exploitation, for energy planning purposes, are analyzed in a study area.
2.1 Study area and data set
The methodology is implemented in Alvalade, a parish located in the city of Lisbon, the capital of Portugal (Figure 1). The parish includes part of the Alvalade neighborhood, a urban planned zone from 1940s-50s, characterized by a modern morphology, with residential areas, avenues, squares and school facilities, designed to promote pedestrian movement. The area includes mainly residential five-storey buildings with commercial services in the lower floors, green areas and public buildings. According to the 2001 Census (INE, 2001), 9620 people live in this parish.
Within the area, a total of 811 buildings were identified in the municipal cartography; Their average footprint is 221,6 m2.
Figure 1. Study area for solar potential analysis in Lisbon
For solar mapping, a spatial database including planimetric and altimetric data was used (Figure 2). The planimetric information comprises three sets: the building footprints, the census block groups, and the land use map. The building footprints were obtained from the Lisbon’s Municipal Cartography from 1998, at 1:1 000 scale, and updated for the year of the LiDAR flight. The census block groups in Portugal are supported by
cartography and are available in vector format for every decade. The block group is the finest spatial unit for which the decadal Census reports population and housing data. Land use information was provided by the Urban Atlas, which maps land use for selected European cities, including Lisbon, using 19 thematic classes and has a minimum mapping unit of 0.25 ha (for ‘Artificial surfaces’) (EEA, 2013).
The altimetric data is derived from two sources: a LiDAR point cloud, and digital cartography. From a flight with a LiDAR camera performed in 2006, a surface image was produced based on the 2nd return. This raster has a spatial resolution of 1 m, and represents the Digital Surface Model (DSM) of the area. A Digital Terrain Model (DTM) for the city of Lisbon was produced from a set of elevation mass points and contours available in municipal cartography. Then, the normalized Digital Surface Model (nDSM) was obtained by subtracting the DTM from the DSM image. This raster file stores the height of all elements above the terrain.
Figure 2. Spatial layers from the planimetric (A, B) and altimetric (C) dataset 2.2 Evaluating PV generation capacity
In this work, the goal is to evaluate the rooftop area suitable for installation of solar energy systems and select the optimal location for solar photovoltaic systems.
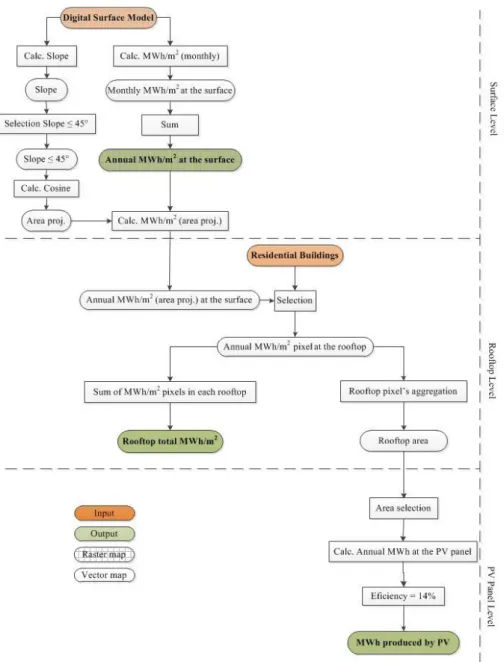
Therefore, when assessing the electrical supply of PV installed in residential rooftops, the following variables must be considered: the available solar radiation, the technical characteristics of the solar panels, and the best places for installation (Figure 3). Identifying buildings that are suitable for solar panel installation requires modeling the solar radiation incident in each location. Two inputs are required: a DSM and the buildings’ footprints. In order to include the solar modeling the atmospheric effects, as well as site latitude and elevation, steepness (slope or inclination) and compass direction (aspect or orientation), daily and seasonal shifts of the Sun angle, and effects of shadows cast by surrounding topography, the Solar Radiation analysis tools in ArcGIS (ESRI) is used. The model requires as input, among others, the local annual average of beam and diffuse irradiation. For better describing the solar conditions in the study area, the diffusion and transmissivity parameters were estimated on a monthly basis using the PVGIS database (Santos, 2011b).The output is a map with the incoming global solar radiation (direct + diffuse) in each location, for each month. Then, all 12 maps are summed up and the annual solar radiation at the surface, in Wh/m2, is calculated.
The specifications of the equipment used to convert the solar resource into photovoltaic energy are variables that contribute for the technical potential of these systems. Two variables are considered: PV modules’ area and efficiency. The roof area for PV installation must be estimated. Due to the minimum requirements for economically viable solar system sizing, only areas above 24 m2 per rooftop are investigated. The conversion efficiency of the PV systems, including PV module efficiency and system losses is estimated at 14% (Šúri et al., 2007). Furthermore, buildings with roofs with low solar radiation will not be considered for analysis (less than 0.8 MWh/m2/year). Applying these constraints in the layer with the annual solar radiation available at each rooftop, the map with the energy produced by PV panel is estimated.
Using a layer with the residential buildings footprints, and the roof’s solar characteristics calculated in the previous step, the solar potential of each roof is calculated.
2.3 Estimating the residential population by building
The population distribution at the building level is used to estimate two features. On one hand, the electricity demand of the residential sector will be assessed using the local average electricity demand per capita. On the other hand, the estimated number of residents will be used to characterize the type of building ownership, based on the average family size.
To model the electricity demand at the building level, several methodologies can be used. Swan and Ugursal (2009), when reviewing modeling techniques for describing residential sector energy demand, distinguished two approaches: top-down and bottom-up. The top-down approach models the residential sector as an energy sink, and no concern is given to the individual end-uses. The bottom-up approach, on the other hand, extrapolates energy consumptions of representative individual houses to regional or national levels.
The methodology proposed in this work is a function of data availability: 1) census population at the block group level, 2) building footprints in vector format, and 3) land use information.
The population estimation approach is based on dasymetric mapping with areal interpolation. Dasymetric mapping is a cartographic technique that allows limiting the distribution of a variable to the zones where it is present by using related ancillary information in the process of areal interpolation (Eicher and Brewer 2001).
Here the goal is to disaggregate the total resident population from each census block group (source zones) to respective buildings with residential use (target zones), using ‘residential volume’ as the proxy variable. First, the Urban Atlas is used to characterize the use of each building in the Municipal map as ‘Residential’ or ‘Non-residential’. Then, the nDSM is used to impose an additional restrictive criterion: only buildings with at least one floor above ground (i.e., mean height ≥ 2.6 m) are deemed suitable for habitation and to receive resident population. Finally, this set of buildings receive a proportional (linear) share of the resident population of the respective block group based on the ratio of their volume to the total resident volume in the block group. Estimation of residents per building is rounded to integer values.
3. Results
3.1 Solar potential at the rooftops
Following the workflow (Figure 3), the solar income was calculated for all residential buildings in the study area (Figure 4).
Note that artifacts like roof overhangs, chimneys, dormers, antennas, are not taken into account by our methodology. To be integrated in this analysis, such identification requires more detailed 3D data or additional spectral information.
Figure 4. Electricity produced by PV panels at the residential rooftops. 3.2 Residential population by building
The adopted population modeling approach allowed estimating the residential population for each building.
Based on information from the Urban Atlas, 806 buildings were classified as
‘Residential’, while only 5 had other uses (‘Non-residential’). When the size criterion was imposed, only 787 buildings were deemed suitable for habitation and, thus, targets for residential population disaggregation. Of these, 760 received at least one resident, with the maximum value being 137 residents (in one building) (Figure 5). The mean estimated residential population by building was 12.2, for a total of 9628 residents. This figure differs from the census total of 9620 residents due to the effects of rounding.
Figure 5. Residential population by building
3.3 PV potential and electricity demand of residential buildings 3.3.1 Rooftops solar potential and electricity demand
Considering the local average electricity demand per capita, which for the Lisbon municipality is 1300 kWh/person/year (PORDATA, 2013), and the population distribution calculated in the previous section, the electricity demand of residential buildings can be estimated. By direct comparison with the PV potential (Figure 4), the
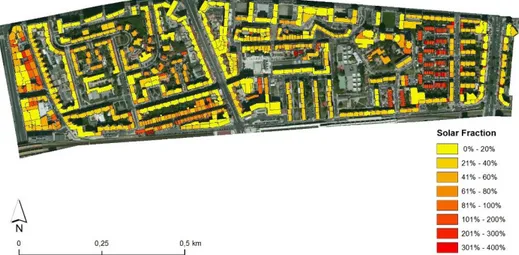
fraction of the electricity demand that can be satisfied by PV systems can be determined - the electricity solar fraction (PV potential/electricity consumption) (Figure 6). In the study area, the PV potential corresponds to about ¼ of the total electricity demand.
Figure 6. Solar fraction by residential building in the study area. 3.3.2 Rooftops solar potential and type of building
A more detailed analysis regarding the relationship between the solar fraction and the type of buildings highlights the distribution of high PV potential buildings in the area. For this purpose, and taking the building height as proxy for the type of building, Figure 7 plots the solar fraction as a function of the height of the buildings.
Figure 7. Scatter plot with exponential fit and plot with groupings
The data is grouped in three different sets of buildings, according to their height. Notice that buildings in the first quartile (Group 1, below 10m, typically less than three-storey buildings) feature solar fractions above 100%, hence potentially generating more solar electricity than they consume, while buildings in groups 2 and 3 are net electricity
consumers. This was to be expected as, for a given footprint, taller buildings will have larger volumes hence are assumed to have more residents and therefore higher
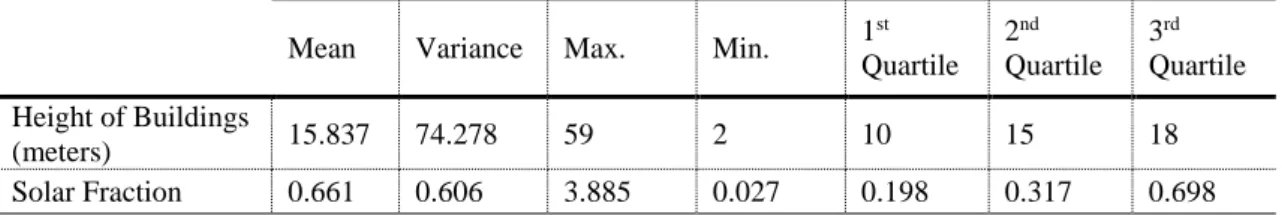
electricity demand. Table 1 summarizes the descriptive statistics for building height and for solar fraction, Table 2 the electricity demand and PV potential of the different groups.
Table 1 – Descriptive statistics of building height and solar fraction
Mean Variance Max. Min. 1
st Quartile 2nd Quartile 3rd Quartile Height of Buildings (meters) 15.837 74.278 59 2 10 15 18 Solar Fraction 0.661 0.606 3.885 0.027 0.198 0.317 0.698
Table 2 – Energy production and consumption in the different groupings Production (MWh/year) Consumption (MWh/year) Average solar fraction Number of Buildings Group 1 797 1064 0.749 179 Group 2 1644 5970 0.275 353 Group 3 761 5824 0.131 161
These results show that 25% of the buildings (Group 1) have about 25% of the solar potential but only 12% of the electricity demand. These buildings, with an average solar fraction of about 75%, are the best candidates for net-metering schemes, which are known to be more popular among households achieving solar fractions closer to unity (Wallenborn, 2013).
The following model is estimated, reflecting the groupings defined above:
0 4
1,
1 ln solar_fraci j build_highi j i, 1,..., ; 1,..., 4 j D v i N j
where
1, j is the grouping specific effect of the height of the buildings over the solarfraction.
Not surprisingly, the estimated results, described in Table 3, corroborate the idea of heterogeneity in our data. In other words, the estimated coefficients do not share the same sign across different clusters: positive for Group 1 (single family buildings) and negative for Group 2 and 3 (multifamily buildings). Also, in terms of intensity, the estimated coefficient for the multifamily building, with possible physical influences is the highest, in absolute value, compared to the remaining groupings, which reflects the associated inefficiencies.
Table 3 – OLS regression with robust standard errors, groupings build_height Group 1 build_height Group 2 build_height Group 3
ln(solar_frac) 0.046** -0.072*** -0.06*** -0.09 0.625 0.00 (0.02) (0.009) (0.005) (0.133)
Robust standard errors in parentheses *** p<0.01, ** p<0.05, * p<0.1
Regarding the results described above, three hypotheses that might clarify if these estimated effects are somewhat affected by the relative proximity of other type of buildings, are tested. We now summarize the hypothesis to test:
i) H1,20 :
1,1
1,2ii) H01,3:
1,1
1,3 iii) H02,3:
1,2
1,3 and test statistic is: * , ~ p n k SSR SSR n k F F SSR p
where SSR* is the sum squared residuals for the restricted model (under the null hypothesis), SSR is the sum squared residuals for the unrestricted model, k is the
number of regressors and p the number of restrictions (one, for these cases).
The test results, presented in Table 4, are straightforward: the estimated coefficients for each grouping are all pairwise statistically different.
Table 4 – F tests
Null Hypothesis Test Statistic P-Value 1,2 0 : 1,1 1,2 H
84.36 0.000 1,3 0 : 1,1 1,3 H
42.27 0.000 2,3 0 : 1,2 1,3 H
5.28 0.022Notwithstanding, the result for the test deserves some attention. At 99% confidence level, the estimated effect for the multifamily buildings is statistically equal, so it might be reasonable to take into consideration that the relative proximity of such buildings is not sufficiently relevant to determine bigger differences on the estimated effects. The same is not valid for the single family buildings, whose solar fraction is likely to be affected by their relative position to higher buildings.
3.3.3 Rooftops solar potential and building ownership
Another interesting result from the mapping of the rooftop solar potential arises when these data are crossed against the type of building ownership. According to INE (2011), the average family size is approximately 3 individuals. This number is used to
distinguish building with one owner, from buildings with several owners. The results are summarized in Table 3. It is clear that, for the study area, a very significant part (75%) of the total solar potential on residential buildings is located in apartment blocks’ condominiums (i.e. buildings with multiple owners). Notice that in Portuguese cities this type of building ownership is quite common (INE, 2011) and therefore one can expect that these results may be extrapolated for the city as a whole, and other urban areas.
These results lead to relevant implications regarding solar energy incentives policies. In fact and since its inception, the feed in tariff scheme in Portugal has been
overwhelmingly used by homeowners of single-family buildings, although the Law already allows for the incentive to be available for buildings with multiple owners (with different eligibility criteria including the completion of an energy audit to the common areas). The reasons that have been put forward to explain the low popularity of these incentives for condominiums are mainly administrative barriers (since condominiums cannot request bank loans and therefore individual owners would have to request individual loans for a common purpose, which is not particularly welcomed by lending institutions) and organizational issues (since all the owners need to agree with the investment). The results shown in Table 5 highlight that the large scale dissemination of photovoltaic energy in the urban landscape requires the outreach to multiple-ownership buildings’ rooftops. This could be achieved by streamlining the procedures for the application to feed in tariff incentives by condominiums (including facilitating borrowing conditions for this type of investments) or, facilitating the lease of the commonly owned roof space to third parties.
Table 5. Planning scenarios for PV implementations
Planning options Buildings Population PV generation MWh/year
PV coverage per building (%) All residential buildings 693 a 9420 3202 23
Buildings with multiple owners 514 8790 2405 17
Buildings with one owner 179 630 797 42
a 67 Residential buildings were excluded for not meeting the previously specified parameters
4. Conclusions
The work presented in this paper explores the use of remote sensing data as an
alternative source of geospatial information for solar mapping to assist urban planning and management. The motivation for this case study lies in the fact that incorporating solar systems into buildings offers a mean to locally generate electricity, based in a clean and renewable decentralized source of energy. In these circumstances, the use of LiDAR data can play an important role when analyzing the buildings capability for receiving the solar systems.
The model results have shown that, for the study area, about 25% of the local electricity demand in residential buildings can be met by installing PV systems on their rooftops.
Furthermore, the first quartile of buildings (according to their heights) feature relatively high solar fraction potential, making them particularly suitable for net-metering
schemes, which are known to be popular among citizens with net zero annual
consumption, hence with the potential of reaching solar fractions of the order of unity. This target group has about 25% of the total solar energy potential of the area under study, but only 12% of the electricity demand.
On the other hand, it was also shown that most of the solar potential in the urban landscape is located on the rooftops of multiple-owner buildings which leads to the conclusion that, for the large scale dissemination of solar power in the cities, it is important to broaden solar energy incentive policies, such as feed in tariffs, to these types of buildings, by either facilitating condominium investment in PV systems and/or promoting third party leases of roof space for grid integrated PV systems.
These results recommend a simple approach that produces an initial assessment of a city’s solar potential that can be used to support management decisions regarding investments in solar systems. The spatial resolution of the DSM obtained from the LiDAR data used in this study compromised further detailed analysis. If a higher point density LiDAR cloud is used, the derived DSM can depict elements in the roof area, and optimal locations for panel installation can be identified. Furthermore, the upcoming systems that perform simultaneous collection of LiDAR together with high resolution digital imagery in the same flight potentiate the development of higher-scale solar mapping applications.
Acknowledgements
The authors would like to thank Logica for the opportunity of using the LiDAR data set. This paper presents research results of the Strategic Project of e-GEO
(PEst-OE/SADG/UIo161/2011) Research Centre for Geography and Regional Planning funded by the Portuguese State Budget through the Fundação para a Ciência e Tecnologia.
The work presented in this communication was funded by the Fundação para a Ciência e Tecnologia (Grant SFRH/BPD/76893/2011).
References
Bergamasco, L., & Asinari, P. (2011). Scalable methodology for the photovoltaic solar energy potential assessment based on available roof surface area: Further improvements by ortho-image analysis and application to Turin (Italy). Solar Energy, 85(11), 2741– 2756. doi:10.1016/j.solener.2011.08.010
Brédif, M., Tournaire, O., Vallet, B., & Champion, N. (2013). Extracting polygonal building footprints from digital surface models: A fully-automatic global optimization framework. ISPRS Journal of Photogrammetry and Remote Sensing, 77, 57–65. doi:10.1016/j.isprsjprs.2012.11.007
Brito, M. C., Gomes, N., Santos, T., & Tenedório, J. A. (2012). Photovoltaic potential in a Lisbon suburb using LiDAR data. Solar Energy, 86(1), 283–288.
doi:10.1016/j.solener.2011.09.031
the Urban Fabric for the Production of Renewable Energy using LIDAR Data and Image Processing Techniques. In P. M. Sester, P. L. Bernard, & P. V. Paelke (Eds.),
Advances in GIScience (pp. 83–112). Springer Berlin Heidelberg. Retrieved from
http://link.springer.com/chapter/10.1007/978-3-642-00318-9_5
Cellura, M., Di Gangi, A., Longo, S., & Orioli, A. (2012). Photovoltaic electricity scenario analysis in urban contests: An Italian case study. Renewable and Sustainable
Energy Reviews, 16(4), 2041–2052. doi:10.1016/j.rser.2012.01.032
DGEG (Direcção-Geral de Energia e Geologia) (2011). Caracterização Energética
Nacional 2011. Retrieved from http://www.dgeg.pt/
EEA (European Environment Agency) (2013). Urban Atlas. Retrieved from http://www.eea.europa.eu/data-and-maps/data/urban-atlas
Eicher, C. L., & Brewer, C. A. (2001). Dasymetric Mapping and Areal Interpolation: Implementation and Evaluation. Cartography and Geographic Information Science,
28(2), 125–138. doi:10.1559/152304001782173727
Ferreira, J., & Pinheiro, M. (2011). In search of better energy performance in the Portuguese buildings—The case of the Portuguese regulation. Energy Policy, 39(12), 7666–7683. doi:10.1016/j.enpol.2011.08.062
Fu, P., & Rich, P. M. (1999). Design and Implementation of the Solar Analyst: an ArcView Extension for Modeling Solar Radiation at Landscape Scales. Presented at the IX Annual ESRI User Conference, San Diego, California. Retrieved from
http://proceedings.esri.com/library/userconf/proc99/proceed/papers/pap867/p867.htm Gadsden, S., Rylatt, M., Lomas, K., & Robinson, D. (2003). Predicting the urban solar fraction: a methodology for energy advisers and planners based on GIS. Energy and
Buildings, 35(1), 37–48. doi:10.1016/S0378-7788(02)00078-6
Gamba, P., & Houshmand, B. (2002). Joint analysis of SAR, LIDAR and aerial imagery for simultaneous extraction of land cover, DTM and 3D shape of buildings.
International Journal of Remote Sensing, 23(20), 4439–4450.
doi:10.1080/01431160110114952
Hill, J.M., Graham, L.A., Henry, R.J., Cotter, D.M., Ding, A., & Young, D. (2000). Wide area topographic mapping and applications using airborne light detection and ranging (LIDAR) technology. Photogrammetric Engineering & Remote Sensing, 66(8), 908-914.
Hofierka, J., & Kaňuk, J. (2009). Assessment of photovoltaic potential in urban areas using open-source solar radiation tools. Renewable Energy, 34(10), 2206–2214. doi:10.1016/j.renene.2009.02.021
INE (Instituto Nacional de Estatística) (2001). Recenseamento Geral da População e da
Habitação. Lisboa. Retrieved from http://www.ine.pt/
INE (Instituto Nacional de Estatística) (2011). Censos 2011 Resultados Definitivos –
Portugal. Retrieved from http://www.ine.pt/
Izquierdo, S., Rodrigues, M., & Fueyo, N. (2008). A method for estimating the
geographical distribution of the available roof surface area for large-scale photovoltaic energy-potential evaluations. Solar Energy, 82(10), 929–939.
doi:10.1016/j.solener.2008.03.007
Jochem, A., Hofle, B., Hollaus, M., & Rutzinger, M. (2009). Object Detection in Airborne LIDAR Data for Improved Solar Radiation Modeling in Urban Areas. In The
International Archives of the Photogrammetry, Remote Sensing and Spatial Information Science (Vol. XXXVIII, Part 3/W8), Paris, France.
Kaartinen, H, & Hyyppä, J. (2006). Evaluation of Building Extraction, In EuroSDR-European Spatial Data Research Official Publication, 50, 9-77. Retrieved from http://www.eurosdr.net/publications/50.pdf
Kassner, R., Koppe, W., Schüttenberg, T., & Bareth, G. (2008). Analysis of the Solar Potential of Roofs by Using Official Lidar Data. In The International Archives of the
Photogrammetry, Remote Sensing and Spatial Information Science (Vol. XXXVII, Part
B4). Beijing, China.
Kodysh, J. B., Omitaomu, O. A., Bhaduri, B. L., & Neish, B. S. (2013). Methodology for estimating solar potential on multiple building rooftops for photovoltaic systems.
Sustainable Cities and Society, 8, 31–41. doi:10.1016/j.scs.2013.01.002
Lund, H. (2007). Renewable energy strategies for sustainable development. Energy,
32(6), 912–919. doi:10.1016/j.energy.2006.10.017
Mourmouris, J. C., & Potolias, C. (2013). A multi-criteria methodology for energy planning and developing renewable energy sources at a regional level: A case study Thassos, Greece. Energy Policy, 52, 522–530. doi:10.1016/j.enpol.2012.09.074 Ordóñez, J., Jadraque, E., Alegre, J., & Martínez, G. (2010). Analysis of the photovoltaic solar energy capacity of residential rooftops in Andalusia (Spain).
Renewable and Sustainable Energy Reviews, 14(7), 2122–2130.
doi:10.1016/j.rser.2010.01.001
PORDATA (Base de Dados Portugal Contemporâneo) (2013). Consumo de energia
elétrica. Retrieved from http://www.pordata.pt/
Redweik, P., Catita, C., & Brito, M. (2013). Solar energy potential on roofs and facades in an urban landscape. Solar Energy, 97, 332–341. doi:10.1016/j.solener.2013.08.036 Rottensteiner, F., Trinder, J., Clode, S., & Kubik, K. (2003). Building Detection Using LIDAR Data and Multi-spectral Images. In Sun C., Talbot H., Ourselin S. & Adriaansen T. (Eds.), Seventh Digital Image Computing: Techniques and Applications, Sydney, Australia.
Rottensteiner, F., Trinder, J., Clode, S., & Kubik, K. K. T. (2005). Automated delineation of roof planes from LIDAR data. In Proceedings of the ISPRS Workshop
Laser scanning 2005 (Vol. XXXVI, Part3). Enschede, the Netherlands.
Santos, T., Freire, S., Rodrigues, A. M., Gomes, N., Brito, & Tenedório, J. A. (2011a). Creating Web-based Solar Maps: Mapping Applications based on LiDAR Data. In N. N. Pinto, J. A. Tenedório, M. Santos, & R. Deus (Eds), Proceedings of Seventh
International Conference on Virtual Cities and Territories, (pp 555-560), Lisbon,
Portugal.
Santos, T. (2011b). Producing Geographical Information for Land Planning using VHR
Data. Local Scale Applications. LAP LAMBERT Academic Publishing GmbH &
Co.KG. ISBN 978-3-8473-0460-9
Solangi, K. H., Islam, M. R., Saidur, R., Rahim, N. A., & Fayaz, H. (2011). A review on global solar energy policy. Renewable and Sustainable Energy Reviews, 15(4), 2149– 2163. doi:10.1016/j.rser.2011.01.007
Šúri, M., Huld, T. A., & Dunlop, E. D. (2005). PV-GIS: a web-based solar radiation database for the calculation of PV potential in Europe. International Journal of
Sustainable Energy, 24(2), 55–67. doi:10.1080/14786450512331329556
Šúri, M., Huld, T. A., Dunlop, E. D., & Ossenbrink, H. A. (2007). Potential of solar electricity generation in the European Union member states and candidate countries.
Solar Energy, 81(10), 1295–1305. doi:10.1016/j.solener.2006.12.007
Swan, L. G., & Ugursal, V. I. (2009). Modeling of end-use energy consumption in the residential sector: A review of modeling techniques. Renewable and Sustainable Energy
Reviews, 13(8), 1819–1835. doi:10.1016/j.rser.2008.09.033
Tack, F., Buyuksalih, G., & Goossens, R. (2012). 3D building reconstruction based on given ground plan information and surface models extracted from spaceborne imagery.
doi:10.1016/j.isprsjprs.2011.10.003
Vögtle, T., Steinle, E., & Tóvári, D. (2005). Airborne Laserscanning Data for determination of suitable areas for photovoltaics. In Proceedings of the ISPRS
Workshop Laser scanning 2005 (Vol. XXXVI, Part3). Enschede, the Netherlands.
Wallenborn, G. (2013). The enrolment of consumers in smart grids. Proceedings of
Conference STS Perspectives on Energy, Lisbon, Portugal.
Wiginton, L. K., Nguyen, H. T., & Pearce, J. M. (2010). Quantifying rooftop solar photovoltaic potential for regional renewable energy policy. Computers, Environment