i
Application of Data Mining for identifying and
predicting room bookings
Catarina Caldeira Maçaroco
Window of Opportunity
Project Work report presented as partial requirement for
obtaining the Master’s degree in Information Management
and Business Intelligence.
i
NOVA Information Management School
Instituto Superior de Estatística e Gestão de Informação
Universidade Nova de LisboaAPPLICATION OF DATA MINING FOR IDENTIFYING AND PREDICTING
WHICH EVENTS LEAD TO ROOM BOOKINGS –
WINDOW OF OPPORTUNITY
by
Catarina Maçaroco
Project Work presented as partial requirement for obtaining the Master’s degree in Information Management, with a specialization in Knowledge Management and Business Intelligence Advisor: Roberto Henriques, PhDFebruary 2019
ii
ABSTRACT
This study investigates the search patterns for predicting hotel bookings. Using Expedia’s search and purchase data, I identified the user’s booking window and which events have a higher effect on the booking likelihood. The tourism industry has seen exponential growth over the last two decades, much due to global socio-economic changes, globalization and internet massification. Portugal is finally reaping its share of profit and continues winning “best destination” prizes year after year. It is now part of a very competitive ecosystem where distribution plays a determinant role in whether the touristic product survives or not. Big players like Expedia and Booking.com have taken control of a big chunk of the market’s revenue because they understood that the large amounts of data they have enabled predicting demand hence offering highly competitive deals.Only by understanding the booking drivers one can negotiate better distribution deals and lower commissions through making better sales predictions and enhancing marketing and revenue strategies, hence the purpose of this study being to use data mining to find patterns in room bookings, enabling this industry to become an even more important source for the country’s GDP.
Through the analysis of consumer behavior and booking times and the use of time series analysis and machine learning, it is possible to find patterns that can be applied across not only Hospitality but other industries as well.
By looking for the connections and the relevance of each feature on the final predictions, a new window of opportunity will open for marketing and sales professionals.
KEYWORDS
Sales trends; Micro moments; Macro moments; Zero Moment of Truth; Booking Windowiii
INDEX
1. Introduction ... 1
1.1. Background and problem identification ... 1
1.2. Study Relevance ... 2
1.3. Study Objectives ... 3
2. Literature review ... 4
3. Methodology ... 7
3.1. Problem Definition ... 8
3.2. Data Collection ... 8
3.3. Data Sampling and Cleaning ... 8
3.4. Software ... 8
3.5. Selecting and fitting models ... 8
3.6.
Validating results ... 9
3.7. Feature engineering ... 9
3.8.
Models ... 10
4. Results and discussion ... 12
4.1. Descriptive Analysis ... 12
4.2. Predictive Analysis ... 12
4.3. Prescriptive Analysis ... 15
5. Conclusions ... 16
6. Limitations and recommendations for future works ... 17
7. Bibliography ... 18
8. Appendix ... 21
8.1. Appendix 1 – Descriptive Analysis ... 21
8.2. Appendix 2 – Predictive Analysis ... 24
8.3. Appendix 3 - Automation ... 26
iv
LIST OF FIGURES
Figure 1 - Workflow diagram ... 7
Figure 2 - Dataiku workflow ... 11
Figure 3 - Search window per week per continent ... 21
Figure 4 - Search window when booking with package or without package ... 21
Figure 5 - Search window if booking includes weekend or does not include weekend ... 22
Figure 6 - Search window when booking with children ... 22
Figure 7 - Number of bookings including children ... 23
Figure 8 - Number of bookings per continent ... 23
Figure 9 - Variables importance ... 25
Figure 10 - Booking likelihood ... 25
Figure 11 - Automation workflow ... 26
v
LIST OF TABLES
Table 1 - Hyperparameters ... 9
Table 2 - Cohorts’ results ... 13
Table 3 - Algorithm details ... 14
Table 4 - Quality metrics ... 14
Table 5 - Variables Explanation ... 24
Table 6 - Models' results ... 24
vi
LIST OF ABBREVIATIONS AND ACRONYMS
API Application Programming Interface ARIMA Autoregressive Integrated Moving Average AHRESP Associação da Hotelaria Restauração e Similares de Portugal CPC Cost per click CMS Content Management System GDP Gross Domestic Product LSTM Long short-term memory MCC Matthews Correlation Coefficient OTA Online travel agent ROC AUC Receiver Operating Characteristic Area Under the Curve ROI Return on investment SETAR Self-Exciting Threshold Autoregressive XGBOOST Extreme Gradient Boosting ZMOT Zero moment of truth1
1. INTRODUCTION
Competition for room bookings has never been this fierce. From Hotels to destination management companies to OTAs, every company is eager to take its cut from the selling price (Kevin May, 2017).
This study aims to use popular machine learning models to predict likelihood to book and act accordingly to that probability.
Through fixed commissions, cost per acquisition or fixed fees, lodging and accommodation businesses are completely dependent on third party booking agents. Refusing from being part of the system would lead to complete isolation in a market that has been growing at a rate of 2,5% per year (INE, 2017) in terms of number of Hotels and where investors are confident in continuously stronger revenues, where tourism now represents 10% of the Portuguese GDP (Ferreira, 2017), currently the highest source.
Analysing the customer behaviour and predicting the booking window is essential to gain a competitive advantage in a market where advertising spent is reaching monstrous levels, with companies like Booking.com spending $3,5 billion in Pay per click last year (Kevin May, 2017).
XBBoost proved to be the Model that performed best and provided the most accurate prediction power. The results suggest that by adding further relevant variables the model’s predictive power will increase. I was able of identifying the users that are most likely and least likely to book, creating different segments which can be very powerful to generate effective strategies, impacting the right users with the right nudges that lead to more bookings, hence more revenue. With the identification of the exact periods and variables that lead to a booking, the advertising spent can be better allocated and revenue strategies can become more effective (Trefis Team, 2016). 1.1. BACKGROUND AND PROBLEM IDENTIFICATION With the increasing importance of tourism both globally and especially for Portugal and its GDP, it is essential to take full advantage of the emerging opportunities. The tourism and hospitality markets are widely diverse and complex mainly because they deal with the human need for emotions and experiences (Wu, Mattila, & Hanks, 2015). When looking for accommodation for either business or leisure, the individual is moved by a sense of urgency, a need for relaxation, a sudden rush for something new, just to name a few drivers. These drivers are what marketers are thriving to grasp, because doing so means that one reaches the revenue source first, hence avoiding or gaining commissions. Events that lead to bookings range from mundane everyday events such as feeling tired after a long day and in need for an escape, or Sunday lunch with family leading to booking a trip. It can also be caused by extreme events, like the Eurocup’s final, Christmas or New Years’ Eve. Still, forecasting for extreme events is extremely difficult due to their lack of frequency, something that Uber is invested in solving (Laptev, Smyl, & Shanmugam, 2017). Companies are using online marketing to reach the audience and captivate the users’ interest before others (Torres, Singh, & Robertson-Ring, 2015), yet the market is fierce and competitive. Knowing
2 when customers book is a chance to use Guerrilla marketing effectively, but it it is extremely difficult and time consuming to place the right advert in front of the right consumer, at the right time (Hudson & Thal, 2013). Considering that Booking.com is spending $3,5 billion in Cost Per Click (CPC), and is currently one of Google Adwords’ biggest client (Kevin May, 2017), most certainly it has been conducting these studies for quite a while. Nevertheless, it is not in their interest to share this knowledge, hence the reason for the identification of this problem as one that can be tackled independently in this study. Multiple approaches have been explored by revenue managers, through the exploration of historical data and relating this with past and future events taking place in the locations of buyer and seller (Constantino, Fernandes, & Teixeira, 2016), yet it is not an exact science than rather it is a hunch. This study will try to go a step further and pull the data that delivers true insights and value, in this case, customer behaviour. Customer behaviour analytics is what drove traditional marketing to the second plan and brought digital marketing into play. Contrary to traditional marketing, digital marketing’s core value is that everything can be measured thus enabling a much comprehensive view of the client and efficient strategies to generate value (Julie Cave, 2016).
Google and Facebook, for example, store gigantic amounts of data about every single individual (Bangwayo-Skeete & Skeete, 2015), this is their leverage for delivering the right advertising, to the right customer, at the right time, leading to conversions and advertisers reliance on their effectiveness due to the high ROI results. It is now up to each company to detangle the information they possess (sales data) correlate it to city’s open data and find the patterns that can lead to competitive advantage (Patrick Whyte, 2017). The following variables will be considered in this study: - Sales data - Consumer behaviour - Economic situation (individual, local and global) - Socio-economic events Applying time series and machine learning to sales forecast enables finding the patterns that can be translated into booking windows (Bangwayo-Skeete & Skeete, 2015). The relevance of this study and its main objectives will be further described in the following chapters. 1.2. STUDY RELEVANCE The tourism industry will employ 10% of the population worldwide by the year 2027. In Portugal now, this industry represents almost 1 million jobs, numbers which are expected to grow to 1.034.000 jobs, representing 22,6% of the total employed population by 2027 (Joana Nunes Mateus, 2017). Representing 17% of the Portuguese GDP and an industry where almost a quarter of the Portuguese population rely on, one can easily calculate that the commonly charged 10-25% commission on every
3 sales transaction through intermediaries such as Booking.com and Expedia for distribution, is revenue in a sense “lost” and that could be partially reacquired if proper data exploration was done.
It is therefore of great importance that independent studies start being developed regarding this subject, only through complete awareness of the sales drivers can one stay afloat and minimise the advertising and commissions’ expenditure and own back its power and strategy definition, without being at the mercy of third-party vendors 1.3. STUDY OBJECTIVES The main question of this study is posed as: Is it possible to predict the booking windows using search and booking data? The analysis is made on sales historical data and search trends. These will aim to answer the following specific objectives: - Which trends can be found through the data provided by Expedia through Kaggle?
Data from the Kaggle competition concerning the time of booking and for which dates will be analysed to find patterns that will then be correlated with other variables. - When is the best time to release marketing campaigns? By crossing the booking times with specific variables/times of day/day of the week, it is possible to detect the booking specific drivers, that enable a good prediction of the right time to impact the user. - Which data improves de model’s predictability performance? Various data features will be analysed, the model’s accuracy will vary depending on which features are used and this will ultimately have an effect and lead to reaching the study’s objective. This will only be possible to test once various models are created, ran and analysed. - Which correlations can be found to augment data’s value? After collecting all the data necessary for this study, a correlation between the data features will be made to see if the event did influence the room bookings. - Which model better fits the data? Several models will be applied to the data to detect the model with the best predictive outcome.
4
2. LITERATURE REVIEW
There are several published research papers on the topic of forecasting tourism demand and trends, their techniques and approaches were studied and tested to enable this study. This study’s objective is to evaluate the forecasting performance of artificial neural networks relative to different time series models using Expedia’s search and booking data from Kaggle’s 2013 competition (Kaggle, 2015).The Tourism industry contributed US$7.6 trillion to the global economy, 10.2% of global GDP (Misrahi & Crotti, 2018). In Portugal the contribution of Tourism to the country’s GDP is of 7,1%, there is a clear opportunity for growth when compared with the global landscape (INE, 2017). Tourism is one of today’s fastest growing economic activities hence tourism demand forecasting becoming essential to monitor and predict tourism influx, revenue forecasting and budget allocation. The researchers Song and Lee found it crucial to improve the accuracy and performance of analysis methods by experimenting with new approaches (Chan, Witt, Lee, & Song, 2009). It is not possible to stock the unfilled airline seats, unoccupied hotel rooms, or unused concert hall seats. Due to the perishable nature of the tourism industry, the need for accurate forecasts is crucial (Law & Au, 1999). A relevant article for this study is Forecasting tourism demand to Catalonia: Neural networks vs. time series models (Claveria & Torra, 2014), in which time series and artificial neural network (NN) models are used to extract patterns and predictive results from Catalonia’s tourism demand. There has been an increased interest in more advanced predictive techniques for tourism demand. Which is tied with tourism becoming an increasingly stronger global industry. The use of Artificial Intelligence (AI) techniques for data analysis has been growing due to the need for more reliable and accurate forecasts of tourism demand that can deal with increasing complexity. This is mainly because AI models are better capable of dealing with nonlinear behavior, characteristic of travel data, in this case, bookings data. Still, when comparing the forecasting accuracy of the different models, Autoregressive Integrated Moving Average (ARIMA) outperformed Self-Exciting Threshold Autoregressive (SETAR) and ANN models, especially for shorter timespans. The original dataset pre-processing may be the reason for these results, where there was information loss when accounting for the presence of seasonality and eliminating outliers, which leads to a lower accuracy of neural network forecasts. Neural networks can be improved through structure optimization, adding layers and memory values, hence future research needs to consider whether the implementation of optimised neural networks and advances on dynamic networks do improve tourism demand forecasting.
In the past few years due to new and more advanced forecasting techniques, such as Neural networks and Gradient Boosting, and the need for more accurate metrics of tourism demand the interest in Artificial Intelligence (AI) and experimentation with those same techniques grew, mainly because of their capability of handling nonlinear behaviour (Pai, Hung, & Lin, 2014).
The increasing availability of technology at lower costs enables as well the ever-wider adoption and experimentation. Technology companies, e. g. Google, Facebook, Amazon and Uber are now providing open source software that enables developers and data scientists to further explore the capabilities of Artificial Intelligence (AI) and Machine Learning (ML), this leads to higher interest in creating better
5 predictive solutions (Mukherjee & Lakshmanan, 2017). With cloud computing, it is possible to have efficient energetic usage and ease in scaling and cost savings (Zhang, 2016). Upfront cost commitment is much lower now when compared to on-premises solutions.
When considering open data, one study analyzed Google’s Trends data and examined the usefulness of “hotels” “flights” and “destination country” search indicators and measured in what extent the search queries data improved the AR and the SARIMA methods predicting overnight tourist arrivals. The twelve month forecast results reveal that AR-MIDAS models gave superior predictions to AR and SARIMA time series models in terms of the Root Mean Squared Error (RMSE) and Mean Absolute Percent Error (MAPE) forecasting criteria. Google query search data can be used to accurately project future tourist arrivals over a year's horizon. This study contributed to the growing interest in forecasting using web traffic data making it relevant to other industries that can benefit from the analysis of web search volume histories to predict useful trends (Bangwayo-Skeete & Skeete, 2015). In 2014 a study looked into Google’s Search Data and examined the usefulness of search indicators such as “hotels” and “flights” and tested its impact on the simple Autoregreessive method (AR) and the Seasonal Autoregressive Integrated Moving Average (SARIMA) (Bangwayo-Skeete & Skeete, 2015). The Tourism forecast combination using the CUSUM technique article (Chan et al., 2009) demonstrated that there is no single method that outperformed others in forecasting accuracy, it was the combination of methods that produced better results.
This lead to the increased interest in NN which performed better that time series methods, especially due to its capacity to deal with nonlinear relationship between predictors and predicted variables. A 2014 study tested the accuracy of neural network ensemble prediction when compared with traditional machine learning methods and traditional mathematical statistics methods for studying China’s inbound tourism market in which neural network ensemble had clear better predictive capabilities (Bo & Shi-Ting, 2014). The NNs capacity to emulate the human brain to identify patterns in historical data and learn from experience to capture functional relationships among data when the underlying process is unknown (Claveria, Monte, & Torra, 2015) also leads to its shortcomings of being of poor comprehensibility due its “black box model”, helpful for predicting results but lacking in comprehending the nature of the study in question due to not allowing interpretability of the outcomes and coefficients. In 2015’s study “Common trends in international tourism demand: Are they useful to improve tourism predictions?” (Claveria et al., 2015) researchers modelled tourism demand incorporating the common trends in international tourist arrivals from all visitor markets to a specific destination and analyzed whether the approach allowed improving the forecasting performance of NN models. They used three NNs: the multi-layer perceptron network (MLP), the radial basis function network (RBF) and the Elman network. In the study “Univariate versus multivariate time series forecasting: an application to international tourism demand” (du Preez & Witt, 2003) it was found that univariate time series models were not surpassed by multivariate time series models for more accurate forecasting.
6 Experimental results demonstrated that the forecasting efficiency of a neural network is superior to that of multiple regression, naive, moving average and exponential smoothing. This indicates the feasibility of applying a neural network model to practical international tourism demand forecasting (Law & Au, 1999).
Uber, a global car-hailing and mobility technology company based in San Francisco, United States conducted a study to create a model for forecasting extreme events. They used thousands of time series based on Long Short-Term Memory (LSTM) to train a multi-module neural network. They chose LSTM due to its capacity of modelling complex nonlinear feature interactions through working with large amounts of data across numerous dimensions and use of external variables and automatic feature extraction (Laptev et al., 2017).
AI can identify patterns or irregularities that would otherwise stay hidden. ML has the capacity of spotting opportunities that can make the difference. Its value is exponentially increased when combined with human analysis, that is when insight and vision enable data to take form and translate into actionable strategies.
7
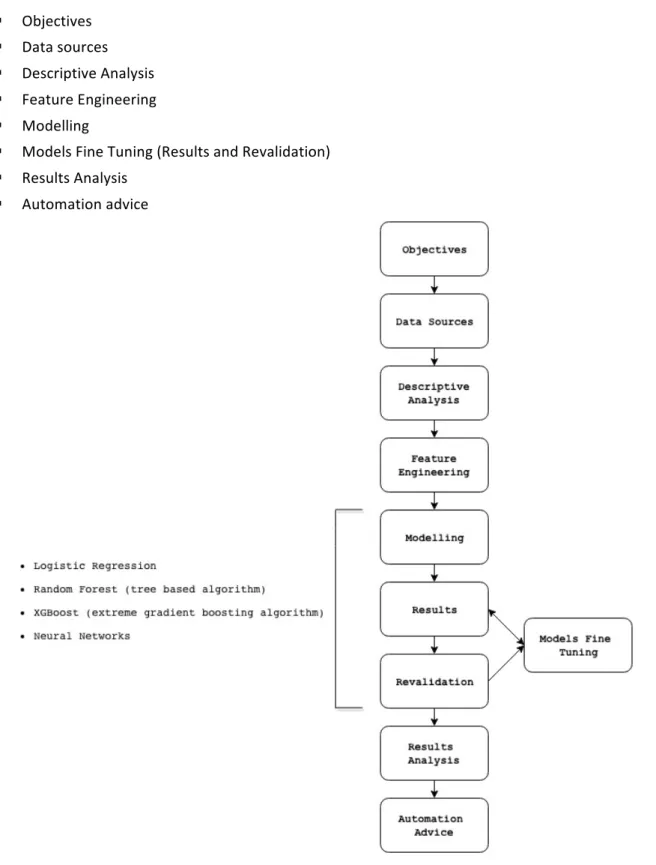
3. METHODOLOGY
For this study I developed the following methodology and diagram, illustrated in figure 1. It delivers a forecasting method that will enable accurate predictions based on past and future events affecting room bookings. The methodology is composed of the following eight stages: § Objectives § Data sources § Descriptive Analysis § Feature Engineering § Modelling § Models Fine Tuning (Results and Revalidation) § Results Analysis § Automation advice Figure 1 - Workflow diagram8 3.1. PROBLEM DEFINITION To conduct effective forecasting, one needs to ensure the problem definition has been fully explored and defined. The problem definition described in the previous section, 2.1, serves as a compass for the following steps and the successful evaluation of the methodology and the obtained results. 3.2. DATA SOURCES This section provides an overview of the data, the pre-processing and cleaning steps taken, as well as feature selection and engineering. Data was retrieved from Kaggle’s Expedia competition (Kaggle, 2015). The data covers users’ search and booking data from 2013 and 2014, 620440 records. This includes both click and booking events. The competition goal was to predict booking outcomes for a user event, based on their search patterns.
This data was selected due to the relevant features that enable the use of different models and proper prediction outcomes. The dataset contains features that provide general information about the user such as ID, users’ continent when booking and the destination of the booking. It also shows the users’ behaviour with check in and check out dates and time of booking. As well as if at the time of booking there was or not a promotion being displayed. The variables explanation can be found in Appendix 2, table 5.
3.3. DATA SAMPLING AND CLEANING
From the large set of data collected from Kaggle’s competition, only 8,4% were actual bookings, to overcome this issue I rebalanced the sample to increase the instances where there was a booking. I removed the rows with missing values in origin-destination distance, which amounted to 36,8% of the data. After cleaning the missing values, I was left with 409602 rows of data, enough for this project. Missing values can complicate the analysis of the study. I chose to drop the data rows rather than impute values because it accounted to 36,8% of the data, which is a high percentage of values to impute and could in the future formulate wrong predictions (Kang, 2013).
3.4. SOFTWARE
Dataiku version 4.1 was the software used in this study. It enables the use of Machine Learning in a clear manner. I was able to build and optimize the models in Python which allows for seamless future integrations through an API to external libraries.
Dataiku enables the creation, training and deployment of advanced custom Machine Learning Models through the use of Python or R. For this study I chose Python.
3.5. SELECTING AND FITTING MODELS
Different approaches were tested to be able to deal effectively with the different data types and dimensions. Flexibility and scalability are essential for this study and model development which is possible with the use of Dataiku.
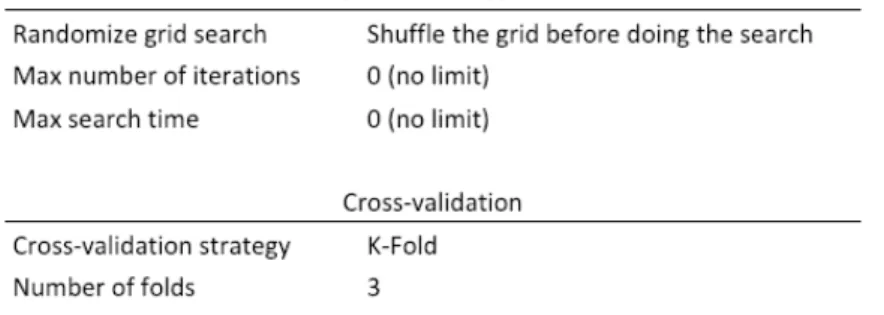
9 In this study I trained the data with Logistic Regression, Random Forest, XGBoost and Neural Networks. I chose these models due to their characteristics, as follows; Logistic Regression’s outcomes enable interpretation which was essential to determine which variables are most relevant for the purpose of this study. Random Forest is an easy to use model which is capable of dealing with multiple variables in an effective way. It is widely used due to its simplicity and the fact that it can be used for classification and regression tasks. Neural Networks are complex uninterpretable models that have gained traction in recent years due to their capacity with dealing with multiple variables and provide very accurate predictions with very large datasets. XGBoost is designed for speed and performance and outperforms various models in its predictive capabilities. It has been used in several Kaggle competitions producing great results and winning several competitions. XGBoost was engineered to have a more efficient computing time and use memory resources in an optimal way. In recent years, data scientists have used these models to successfully predict outcomes similar to those of this study (Sunil Ray, 2017). A more in-depth explanation of each model can be found in chapter 3.8. The dataset was divided into 3 cohorts, 1, 2 and a cohort with all the features, each cohort has a varying number of features, refer to Table 2 in Results and Discussion. I wanted to find if adding more features in the training would impact the models’ results. 3.6. VALIDATING RESULTS Once the models were tested and results retrieved, these will need to be revalidated to ensure that the developed models are accurate and can be tested with new sets of data, continuously producing quality results. Seeing if the results can be generalized. I used the separate subset of the data set to validate if the model would overfit with the data I trained it with. Refer to Table 1 for the models’ hyperparameters. Table 1 - Hyperparameters For this project the assessment metric was ROC AUC since I wanted to have predictions optimised for true positives versus false positives. It enables seeing how the model performs at categorising outcomes.
3.7. FEATURE ENGINEERING
Some features combined with others can provide insights into the data they aim to represent. Time of search and time of booking were parsed in order to provide a clearer understanding of search and booking times.
10 Date_time data was parsed and the date components were extracted into Year, Month, Day, Day of Week and Hour. In order to see if there is a trend in month or day of the week. The same process was done for srch_ci and srch_co, check-in and check-out dates. I computed the time difference between date_time and check-in and the difference between check-in and check-out dates. Binned the search Months into Quarters and conducted the same process for the check-in and check-out months. Also, binned the search hour in 4 bins with 6 hours each. Midnight to 6 am, 6 am to 12 pm, 12 pm to 6 pm and 6 pm to midnight.
The target search month was extracted from the search date and the from booking window. This feature can produce insights on how certain properties might be more desirable than others in certain months. This would enable confirming if a property in for example, Continent 3, would be more searched for in January for stays in September, enabling then better predictions. 3.8. MODELS The models used in Dataiku were; Random Forest, Logistic Regression, XGBoost and Artificial Neural Network. Starting with the Logistic Regression, it is a classification algorithm that uses a linear model which computes the target feature as a linear combination of input feature. It is prone to overfitting and sensitive to errors in the input dataset. Still, the use of a simple linear algorithm can be helpful in exploring the data and reaching insights regarding the data’s underlying structure. In addition to this linear model I selected 3 non-linear models to better capture the complexity of the data, which were: Random Forest, composed of many decision trees. Where each tree predicts an outcome, affecting the final answer of the forest. It is an ensemble learning method for classification, regression and other tasks. By using Random Forest I avoided the overfitting of decision trees, which is possible by having a random element that enables that all trees in the forest are not identical. It lacks explainability but generally provides good results. It can deal with the multivariate data and by averaging across the booking probabilities, should help prevent over-fitting by individual trees (Niklas Donges, 2018). XGBoost (eXtreme Gradient Boosting method), an advanced gradient tree boosting algorithm, which uses parallel processing, regularization (that helps prevent overfitting) and early stopping, makes it a fast, scalable and accurate algorithm. Being an ensemble learning method it combines the predictive power of multiple learners. The result is a single model which gives the aggregated output from several models. The models forming the ensemble can be either from the same or different learning algorithms. Still, they have been mostly used with decision trees. All the additive learners in boosting are modelled after the residual errors at each step. The boosting learners make use of the patterns in residual errors. At the stage where maximum accuracy is reached by boosting, the residuals are randomly distributed without any pattern (Ramya Bhaskar Sundaram, 2018).
It has been used in real-world production pipelines for ad click-through rate prediction and provided state-of-the-art results with various other problems such as store sales prediction; customer behaviour prediction and web text classification (Chen & Guestrin, n.d.).
11 Artificial Neural Networks are inspired by the functioning of neurons, consistent of several hidden layers of neurons which receive inputs and transmit these into the following layer. It can deal with non-linearity allowing for complex decision functions. It lacks interpretability of features importance for the model’s predictive outcome.
Estimating feature importance and model interpretability in general is an area where Haldar et al., took a step back with the move to NNs. Estimating feature importance is crucial in prioritizing engineering effort and guiding model iterations. The strength of NNs is in figuring out nonlinear interactions between the features. It is also the
weakness when it comes to understanding what role a
particular feature is playing as nonlinear interactions make it very difficult to study any feature in isolation (Haldar et al., n.d.).
The target variable was if users conducted a booking or not.
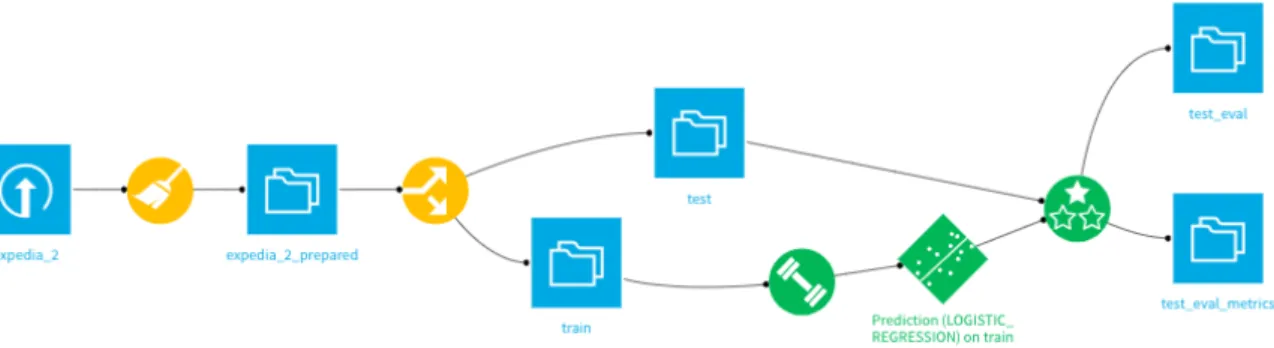
All features were inputted in the model except date_time, user_id, srch_ci and srch_co, since these have direct correlation with the engineered features created which ultimately provide higher prediction value and avoid overfitting. I optimized the models for ROC AUC, which shows me the performance of the models and the true positives against the false positives rate. The Dataiku flow shown in Figure 2 illustrates the steps taken in the data analysis and modelling steps of the study. The data was imported, cleaned and then divided into test and training. The training set was trained with the various variable cohorts and different models. Finally the results were divided in two to ensure that there was no overfitting in the data. Figure 2 - Dataiku workflow
12
4. RESULTS AND DISCUSSION
4.1. DESCRIPTIVE ANALYSIS
By considering the Booking windows between continents, there are clear differences between continents. Considering continents 4 and 1, the booking window has significant variance throughout the year, but a much softer variance for continents 0, 2 and 3.
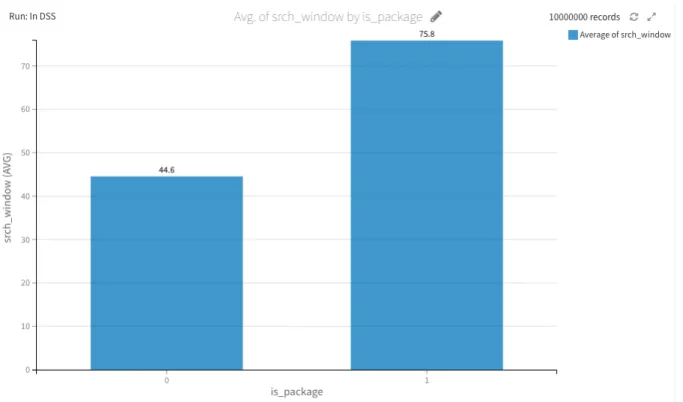
For continent 4, week 3 has the highest average booking window with 108 days. And the lowest booking window for week 26 with bookings being made 82 days in advance. Refer to appendix 1, figure 3. These results can provide highly valuable actionable insights to any company advertising for Hospitality or Hospitality related products and services. The average search window widely varies when considering the bookings that include a package or not. When including a package the average booking window is of 75,8 days against 44,6 days without a package. Refer to appendix 1, figure 4.
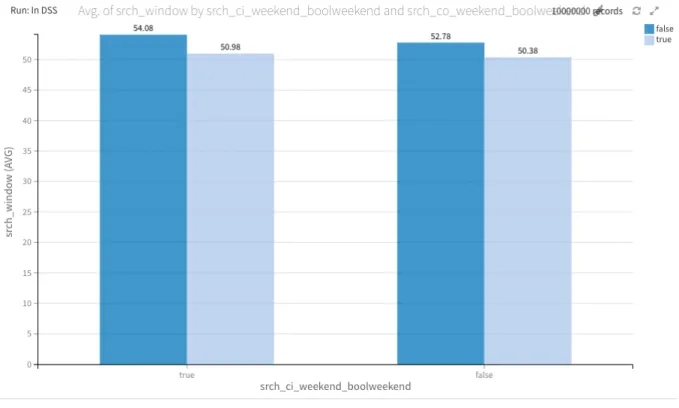
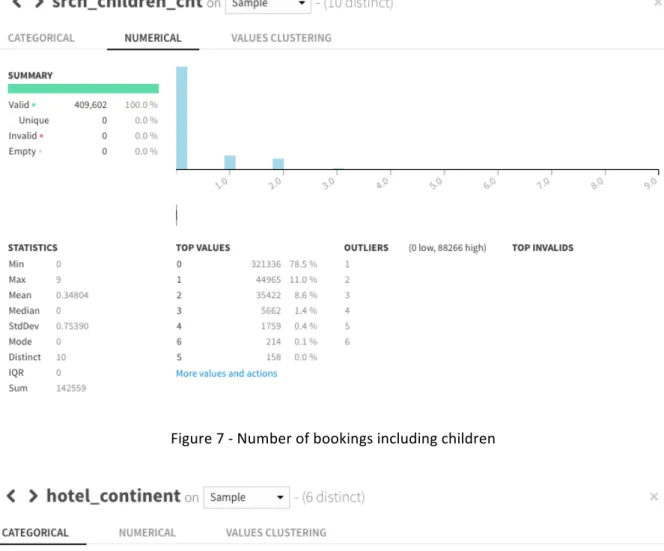
There is not much difference in the search window when the booking includes a weekend or not, ranging from 50 to 54 days in both scenarios. Appendix 1, figure 5. When booking with children the booking window drastically changes the more children you have, there is a clear pattern within the data. If booking without children the average booking window is of 50,66 days, while when the booking includes a child the average goes up to 54,87 and going up to 65,43 days when the booking includes 3 children. Still, these numbers may not have statistical evidence due to the scarce number of bookings with more children. 78,5% of bookings are made with 0 children, 11% with one child, 8,6% with 2 and I could see a steep decline in bookings with 3 children, representing only 1,4% of the total booking in the data set. Refer to appendix 1, figure 6 and 7. Most bookings are made for continent 2, with 63,9% of bookings. I assume therefore that continent 2 is likely to be North America, due to the population volume and high numbers of internal travel. Appendix 1, figure 8. These numbers also reflect the higher market penetration in for continent 2 rather than the remaining continents. 4.2. PREDICTIVE ANALYSIS I ran three different feature cohorts through the models, adding more features to every cohort, it proved to be that the cohort with all the features had the best performance.
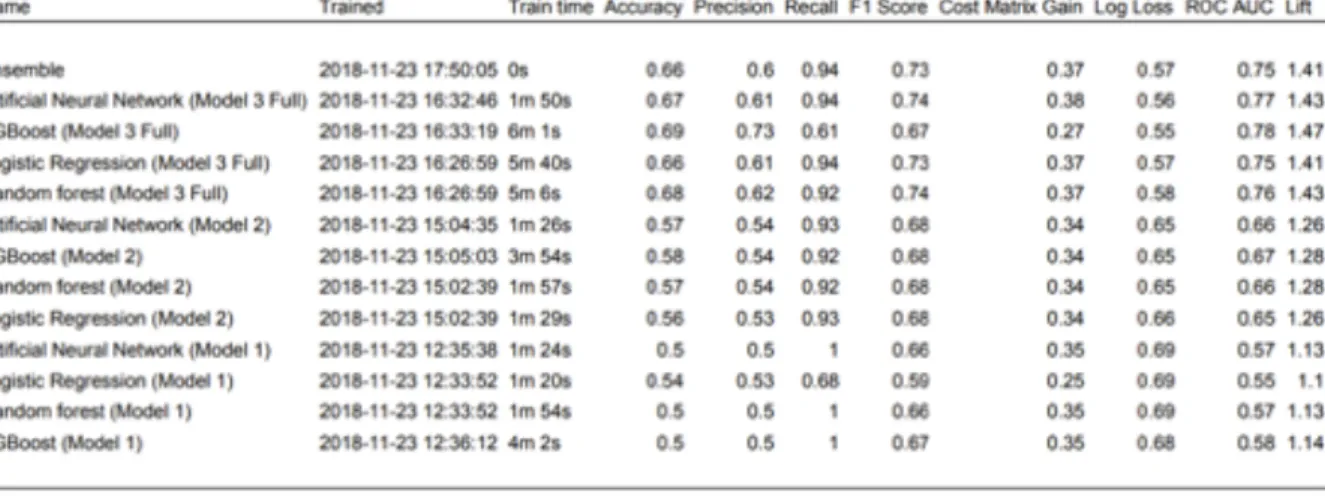
13 Table 2 - Cohorts’ results
What I found is that some models are consistently better than others in predicting likelihood to book. XGBoost continuously outperforms the other models. Also, the more variables I added the more accurate predictions the models would be able to achieve. All results can be found in appendix 2 table 6.
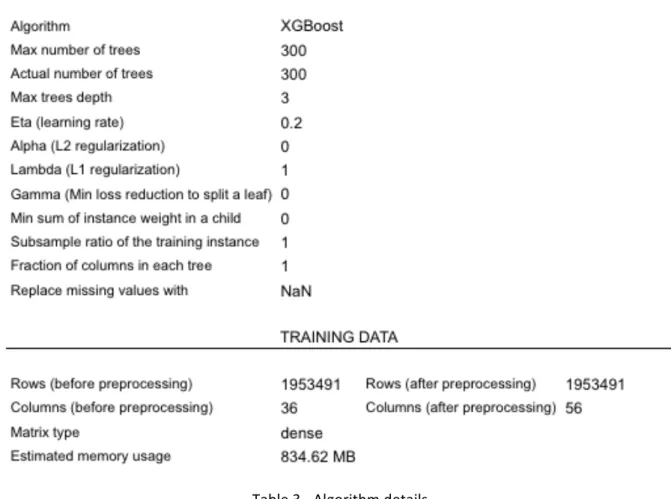
Please refer to Table 3 for the algorithm’s details.
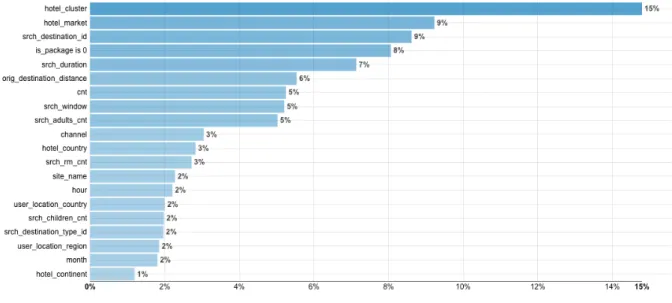
14 Table 3 - Algorithm details In terms of variables importance in predictive power, hotel cluster, hotel market, searched destination, if package or not, search duration and origin-destination distance proved to be the most relevant. Please refer to appendix 2, figure 9. It was possible to identify and bin which users are most likely to book, medium and least likely to book. Refer to appendix 2 figure 10. This allows segmentation of new customers which can lead to different strategies for each segment, enabling more precise targeting and better campaigns and/or promotions performance. As I show below the model was general enough to obtain good predictions, refer to Table 4. The ROC AUC was 0,7833. Table 4 - Quality metrics
15 4.3. PRESCRIPTIVE ANALYSIS A next step would be to implement an automation workflow using integrations between Dataiku, the existing database and the Content Management System (CMS) as illustrated in Appendix 3, figure 11. These integrations are possible through Zapier, a web-based service that enables seamless automation workflows between different applications, it can be described as a translator between web APIs. It is possible to apply the model developed with past data and feed it with new data to predict the likelihood of a customer booking. This ultimately leads to real-time website updates showing the targeted promotions or information that lead the consumer to buy. And ultimately better marketing strategies.
16
5. CONCLUSIONS
This project has outlined the process of building a model to predict hotel bookings. The analyzed data included search patterns and bookings from Expedia’s data set during the period 2013-2014. I found that we can predict when someone would book or not, based on search patterns and that variables such as the number of children, or the location where the booking is being made have an impact on the booking window.I was capable of identifying the users that are most likely and least likely to book, creating three different segments which are very powerful to generate effective strategies to impact the right users with the right nudges that will lead to more bookings, hence more revenue.
This ultimately allows marketers and hospitality professionals or of any activity related to hospitality to stir their marketing efforts in more effective ways, creating the right promotions or marketing ‘nudges’ at the most relevant time in the search and booking funnel.
Feature selecting proved to be extremely important for reaching good results, as including a full set of features can create too much noise and make it difficult to find underlying patterns that will make the model better. This was not the case for this project, where including the whole set of variables produced the best model outcomes.
XGBoost proved to be the most effective Predictive Model, with the highest ROC AUC. Hence the model most suited for this analysis and training of future feature cohorts for search and booking data. The objectives of this study were different from the objectives established within the Kaggle competition for this dataset. This study’s target was to predict the likelihood of booking, whilst the competition was created to determine the likelihood of a user staying at 1 of the 100 hotel groups. This dataset was selected due to having the relevant attributes for this study’s purpose. Kaggles’ winning models are very specific and tailored for the competition and when presented with other sets of data do not perform as well. Hotels and Hospitality professionals from multiple industries have complete access to this data, the computational power available today and the various free tooling and data sets available provide all the necessary instruments to conduct meaningful analysis that can push hospitality related companies to the forefront. It all comes down to proper time allocation and one’s willingness to test and play with the available resources.
17
6. LIMITATIONS AND RECOMMENDATIONS FOR FUTURE WORKS
Future works could consider combining external variables and extreme events and crossing these with the data at hand, finding correlations with these, that will lead to better predictive power. Automation of the model’s predictive outcomes should also be considered and further explained in a future project. Allowing for data-oriented marketing strategies that can surely outperform traditional marketing efforts. Because data was anonymised, I could not see the actual continents and countries where the bookings were taking place. The prices were also unavailable. Meaning that the data had predictive power but lacked interpretability that would enable acting upon the results. In future works, a more complete data set, with concrete values would enable much better predictions and actionable outcomes. Being able to see the effect of price in booking patterns and how small variations in price can influence the predictive power of the models. It is also reasonable to consider that weather conditions and a location’s economic/political and/or environmental stability play an important role in determining propensity to book a certain property on a certain location, leading to change in tourism demand. These are factors that dynamically change in a continuous way, hence a major challenge would be providing an acceptable measurement for these factors in order to include them in future predictive modelling. Future studies should also consider implementing psychographics traits and personas to provide better promotions to the consumers most likely to buy. Offering different products and different packages depending on the users’ level of extraversion or consciousness, two traits that proved to be accurate predictors of users propensity to buy certain products (Rauschnabel, Brem, & Ivens, 2015).Using recommender systems can also be highly valuable to accurately predict users’ purchasing behaviour, hence should be included in future prediction studies.
18
7. BIBLIOGRAPHY
Bangwayo-Skeete, P. F., & Skeete, R. W. (2015). Can Google data improve the forecasting performance of tourist arrivals? Mixed-data sampling approach. Tourism Management, 46, 454–464. https://doi.org/10.1016/J.TOURMAN.2014.07.014 Bo, X., & Shi-Ting, L. (2014). 2014 7th International Conference on Intelligent Computation Technology and Automation, Intelligent Computation Technology and Automation (ICICTA), 2014 7th International Conference on, Intelligent Computation Technology and Automation, International Conf. https://doi.org/10.1109/ICICTA.2014.91 Chan, C. K., Witt, S. F., Lee, Y. C. E., & Song, H. (2009). Tourism forecast combination using the CUSUM technique. Tourism Management, 31(6), 891–897. https://doi.org/10.1016/j.tourman.2009.10.004 Chen, T., & Guestrin, C. (n.d.). XGBoost: A Scalable Tree Boosting System. Retrieved from https://github.com/dmlc/xgboost Claveria, O., Monte, E., & Torra, S. (2015). Common trends in international tourism demand: Are they useful to improve tourism predictions? Tourism Management Perspectives, 16, 116–122. https://doi.org/10.1016/J.TMP.2015.07.013 Claveria, O., & Torra, S. (2014). Forecasting tourism demand to Catalonia: Neural networks vs. time series models. Economic Modelling, 36, 220–228. https://doi.org/10.1016/J.ECONMOD.2013.09.024 Constantino, H., Fernandes, P. O., & Teixeira, J. P. (2016). Modelação da Procura Turística para Moçambique IV Congresso Internacional de Turismo da ESG / IPCA Tourism for the 21st Century Modelação da Procura Turística para Moçambique João Paulo Teixeira, (July). du Preez, J., & Witt, S. F. (2003). Univariate versus multivariate time series forecasting: an application to international tourism demand. International Journal of Forecasting, 19(3), 435–451. https://doi.org/10.1016/S0169-2070(02)00057-2 Ferreira, A. (2017). Expresso | Turismo. Portugal é o 14.o mais competitivo do mundo. Retrieved June 13, 2017, from http://expresso.sapo.pt/economia/2017-04-06-Turismo.-Portugal-e-o-14.-mais-competitivo-do-mundo Haldar, M., Abdool, M., Ramanathan, P., Xu, T., Yang, S., Duan, H., … Legrand, D. (n.d.). Applying Deep Learning To Airbnb Search. Retrieved from https://arxiv.org/pdf/1810.09591.pdf Hudson, S., & Thal, K. (2013). The Impact of Social Media on the Consumer Decision Process: Implications for Tourism Marketing. Journal of Travel & Tourism Marketing. https://doi.org/10.1080/10548408.2013.751276 INE. (2017). Portal do Instituto Nacional de Estatística. Retrieved June 13, 2017, from https://www.ine.pt/xportal/xmain?xpgid=ine_main&xpid=INE Joana Nunes Mateus. (2017). Um Quarto dos Portugueses Vai Trabalhar Para o Turismo | Expresso Emprego. Retrieved July 4, 2017, from http://portugalarecrutar.expressoemprego.pt/noticias/um-quarto-dos-portugueses-vai-trabalhar-para-o-turismo/4353 Julie Cave. (2016). Digital Marketing Vs. Traditional Marketing: Which One Is Better? - Digital19 Doughnut. Retrieved July 10, 2017, from https://www.digitaldoughnut.com/articles/2016/july/digital-marketing-vs-traditional-marketing Kaggle. (2015). Expedia Hotel Recommendations. Retrieved from https://www.kaggle.com/c/expedia-hotel-recommendations Kang, H. (2013). The prevention and handling of the missing data. Korean Journal of Anesthesiology, 64(5), 402–6. https://doi.org/10.4097/kjae.2013.64.5.402 Kevin May. (2017). Google can rejoice: Priceline Group spent $3.5 billion on PPC in 2016. Retrieved June 1, 2017, from https://www.tnooz.com/article/priceline-group-3-5-billion-advertising-2016/ Laptev, N., Smyl, S., & Shanmugam, S. (2017). Engineering Extreme Event Forecasting at Uber with Recurrent Neural Networks - Uber Engineering Blog. Retrieved June 18, 2017, from https://eng.uber.com/neural-networks/ Law, R., & Au, N. (1999). A neural network model to forecast Japanese demand for travel to Hong Kong. Retrieved from http://citeseerx.ist.psu.edu/viewdoc/download?doi=10.1.1.13.4253&rep=rep1&type=pdf Misrahi, T., & Crotti, R. (2018). The Travel & Tourism Competitiveness Report 2017 Paving the way for a more sustainable and inclusive future. Mukherjee, S., & Lakshmanan, L. (2017). Google Cloud provides a unified, streamlined way to execute your ML strategy | Google Cloud Big Data and Machine Learning Blog | Google Cloud Platform. Retrieved February 2, 2018, from https://cloud.google.com/blog/big-data/2017/11/google-cloud-provides-a-unified-streamlined-way-to-execute-your-ml-strategy Niklas Donges. (2018). The Random Forest Algorithm. Retrieved January 3, 2019, from https://towardsdatascience.com/the-random-forest-algorithm-d457d499ffcd Pai, P.-F., Hung, K.-C., & Lin, K.-P. (2014). Tourism demand forecasting using novel hybrid system. Expert Systems with Applications, 41(8), 3691–3702. https://doi.org/10.1016/J.ESWA.2013.12.007 Patrick Whyte. (2017). Smart Cities Need Open Data and a Willingness to Test and Learn. Retrieved June 20, 2017, from https://skift.com/2017/06/15/smart-cities-need-open-data-and-a-willingness-to-test-and-learn/?utm_campaign=Skift Weekly Review Newsletter&utm_source=hs_email&utm_medium=email&utm_content=53244701&_hsenc=p2 ANqtz--3Fu3wJdXe_S4rGD8KhVQjb-vWPMvXMODGF9d- Ramya Bhaskar Sundaram. (2018). Understanding the Math behind the XGBoost Algorithm. Retrieved January 6, 2019, from https://www.analyticsvidhya.com/blog/2018/09/an-end-to-end-guide-to-understand-the-math-behind-xgboost/ Rauschnabel, P. A., Brem, A., & Ivens, B. S. (2015). Who will buy smart glasses? Empirical results of two pre-market-entry studies on the role of personality in individual awareness and intended adoption of Google Glass wearables. Computers in Human Behavior, 49(May), 635–647. https://doi.org/10.1016/j.chb.2015.03.003 Sunil Ray. (2017). Essentials of Machine Learning Algorithms (with Python and R Codes). Retrieved January 6, 2019, from https://www.analyticsvidhya.com/blog/2017/09/common-machine-learning-algorithms/
20 Torres, E. N., Singh, D., & Robertson-Ring, A. (2015). Consumer reviews and the creation of booking transaction value: Lessons from the hotel industry. International Journal of Hospitality Management. https://doi.org/10.1016/j.ijhm.2015.07.012 Trefis Team. (2016). Here Are The Key Growth Areas For Priceline’s Booking.com - Nasdaq.com. Retrieved July 12, 2017, from http://www.nasdaq.com/g00/article/here-are-the-key-growth-areas-for-pricelines-bookingcom-cm723530?i10c.referrer=https%3A%2F%2Fwww.google.pt%2F Wu, L., Mattila, A. S., & Hanks, L. (2015). Investigating the impact of surprise rewards on consumer responses. International Journal of Hospitality Management, 50, 27–35. https://doi.org/10.1016/j.ijhm.2015.07.004 Zhang, L. (2016). Price trends for cloud computing services. Wellesley College. Retrieved from http://repository.wellesley.edu/thesiscollection/386
21
8. APPENDIX
8.1. APPENDIX 1 – DESCRIPTIVE ANALYSIS
Figure 3 - Search window per week per continent
Figure 4 - Search window when booking with package or without package
22 Figure 5 - Search window if booking includes weekend or does not include weekend Figure 6 - Search window when booking with children
23 Figure 7 - Number of bookings including children Figure 8 - Number of bookings per continent
24
8.2. APPENDIX 2 – PREDICTIVE ANALYSIS
Table 5 - Variables Explanation
Table 6 - Models' results
25 Figure 9 - Variables importance Figure 10 - Booking likelihood
26 8.3. APPENDIX 3 - AUTOMATION Figure 11 - Automation workflow