Social Iniquity and Mortality Related to Breast and Cervical
Cancers: an Integrative Review
Iniquidade Social e Mortalidade por Câncer de Mama e Colo do
Útero: Uma Revisão Integrativa
La Desigualdad Social y La Mortalidad por Cáncer de Mama y Cáncer de
Cuello Uterino: Una Revisión Integradora
Daniela de Almeida Pereira Duarte
1*, Maria Teresa Bustamante-Teixeira
2How to quote this article:
Duarte DAP, Bustamante-Teixeira MT. Social Iniquity and Mortality Related to Breast and Cervical
Cancers: an Integrative Review. Rev Fund Care Online. 2018 Jul./Sep.; 10(3):877-888. DOI: http://dx.doi.
org/10.9789/2175-5361.2018.v10i3.877-888
ABSTRACT
Objective:
The leading purpose has been to identify the main publications related to social iniquity and
mortality related to breast cancer (BC) and/or cervical cancer (CC), while investigating the type of association
between the triggering factor and the case outcome. Methods: It is an Integrative Literature Review from the
articles searching in the Medline, Lilacs, PubMed and Scielo databases. A total of 3,439 studies were obtained,
from which only 85 have met the inclusion criteria. Results: The vast majority of the studies have found an
association between high socioeconomic status and mortality by BC and also between low socioeconomic status
and mortality by CC. The principal indicators used to evaluate these associations were as follows: education,
income/poverty and labor market. Conclusion: Areas with high social iniquity have higher mortality rates
related to CC, while those with higher socioeconomic status exhibit high mortality rates related to BC. These
phenomena have several explanations: personal lifestyle, offer and accessibility to screening services and/or
treatment, social stratification based on the economic model adopted in the country.
Descriptors:
Breast neoplasms, Cervical neoplasms, Mortality, Social iniquity, Socioeconomic factors.
1 Universidade Federal de Juiz de Fora, Faculdade de Medicina, Departamento de Saúde Coletiva. 2 Universidade Federal de Juiz de Fora, Faculdade de Medicina, Departamento de Saúde Coletiva.
RESUMO
Objetivo: Identificar as principais publicações relacionadas à iniquidade social e mortalidade por câncer de mama (CAM) e/ou colo do útero (CCU) e investigar o tipo de associação existente entre fator e desfecho. Método: Revisão Integrativa de Literatura a partir da busca de artigos nas bases Medline, Lilacs, PubMed e Scielo. Obteve-se 3.439 estudos, destes apenas 85 atendiam aos critérios de inclusão. Resultados: A maioria dos estudos encontrou associação entre alto nível socioeconômico e mortalidade CAM e entre baixo nível socioeconômico e mortalidade por CCU. Educação, renda/pobreza e mercado de trabalho foram os principais indicadores utilizados para avaliação dessas associações. Conclusão: Áreas com grande desigualdade social apresentam maior mortalidade por CCU enquanto aquelas com melhor nível socioeconômico exibem altas taxas de mortalidade por CAM. Estes fenômenos possuem várias explicações: estilo de vida dos indivíduos, oferta e acessibilidade aos serviços de rastreamento e/ou tratamento, estratificação social baseada no modelo econômico do país.
Descritores: Neoplasias da mama, Neoplasias do colo do útero, Mortalidade, Iniquidade social, Fatores socioeconômicos.
RESUMEN
Objetivo: : Identificar las principales publicaciones relacionadas con la desigualdad social y la mortalidad por cáncer de mama (CAM) y/o el cuello uterino (CCU) e investigan el tipo de asociación entre el factor y el resultado.
Método: una revisión integradora de la literatura de la búsqueda de artículos en el Medline, Lilacs, PubMed y Scielo. Obtenido 3.439 estudios, de éstos sólo 85 cumplieron con los criterios de inclusión. Resultados: La mayoría de los estudios encontraron una asociación entre el nivel socioeconómico alto y el CAM y la mortalidad entre el bajo nivel socioeconómico y la mortalidad por cáncer de cuello uterino. Educación, ingresos/pobreza y el mercado de trabajo fueron los principales indicadores utilizados para evaluar estas asociaciones. Conclusión: Las áreas con gran desigualdad social tienen mayores tasas de mortalidad por cáncer de cuello de útero, mientras que aquellos con mayor nivel socioeconómico presentan altas tasas de mortalidad por CAM. Estos fenómenos tienen varias explicaciones: el estilo de vida de los individuos, la oferta y la accesibilidad de los servicios de seguimiento y / o tratamiento, la estratificación social basada en el modelo económico del país.
Descriptores: Neoplasias de la mama, Las neoplasias cervicales, La mortalidad, La desigualdad social, Los factores socioeconómicos.
INTRODUCTION
Demographic growth together with population aging
and socioeconomic development, they all have gradually
contributed to increasing in cancer incidence and
mor-tality, which is a serious public health problem.
Conse-quently, it has been estimated that by 2030 the worldwide
burden will be 21.4 million new cases of cancer and 13.2
million deaths due to this malignant neoplasm. In Brazil,
this disease represents the second cause of population
mortality, losing only to cardiovascular diseases. Among
the most common types that affect the female gender are
breast and cervical cancers, respectively occupying the
second and third most frequent neoplasms in the world.
1-2Incidence and mortality rates for many types of
can-cer, including breast cancan-cer, are declining in developed
countries, for example in the United States of America.
On the other hand, an inverse situation occurs in
develo-ping countries due to the adoption of unhealthy lifestyles
and behaviors. The high mortality by BC in the
underde-veloped countries has been justified by access difficulties
to prevention services/early detection, cultural barriers
and delayed diagnosis. Considering the CC cases, the
high disparity in the CC incidence has been rooted to
the unequal access to health care that causes either delay
or non-adherence to treatment, then generating high
mortality rates.
3-5Regarding the Brazil, when compared to developed
countries, it presents intermediate values of incidence
and mortality by BC and CC occurrences. In 2012, the
Brazilian mortality rate standardized by the world
popu-lation for the BC was 12.10 deaths/100 thousand women,
with the South and Southeast regions having the highest
rates, 13.61 and 13.42/100 thousand women, respectively.
Observing the CC, the rate was 4.72 deaths/100
thou-sand women, with higher rates in the North (10.5/100
thousand) and Northeast (5.81/100 thousand). It should
be noted that for CC, rates are considered high when
compared to developed countries with well-structured
early detection and screening programs.
6-7Considering the data above, it has been observed that
the incidence and mortality by the two types of
neo-plasms occur differently among the country regions. In
this perspective, there is a need to gain further
unders-tanding about the distribution of BC and CC mortality
rates among the different social strata. The fundamental
objective of this undertaking is establishing effective
stra-tegies for screening and early diagnosis. Therefore, the
aim of this study was to identify the scientific
eviden-ces on social iniquity and mortality from BC and CC,
in order to assess the type of association between the
triggering factor and the outcome.
METHODS
An Integrative Literature Review was carried out based on
the six phases proposed by Souza et.al.
8Initially, the theme
was defined as follows: social iniquity and cancer in women,
along with the guiding question: What are the scientific
evidences on social iniquity and mortality related to BC and
CC? In the second phase, we searched from the data bases:
Medline, Lilacs, PubMed and Scielo using the following
keywords: Breast neoplasms, uterine cervical neoplasms,
mortality, social iniquity, social class, poverty, social
condi-tions, socioeconomic factors, which were combined using
the Boolean operators ‘and’ and ‘or’. The paper inclusion
criteria were as follows: studies on mortality by BC and/
or CC; social iniquity and/or related social factors; social
iniquity and female mortality. Scientific productions were
selected in the form of articles and/or course conclusion
work. Taking this search strategy 3,439 papers were obtained,
from which 834 were selected by title, later it was verified
that 434 were repeated. The remaining 400 studies were
submitted to abstract reading, and then 267 were excluded.
A total of 133 studies were fully read, from which 85 were
included in this study.
The third phase consisted of the information extraction
from the studies, according to the data collection tool
propo-sed by Madeira
9. In the fourth phase each study was analyzed
in an organized and critical manner. Due to the authors’ use
of different indicators that reflect the same reality, it was
decided to categorize them by thematic areas, as proposed
by Jannuzzi
10and presented in the column 3 of the Tables
1, 2 and 3. In the fifth stage the results were interpreted and
summarized, where the similarities and divergences were
verified. Subsequently, a synthesis of the works that are
pre-sented and discussed here was composed.
RESULTS
The 85 studies selected for reviewing were organized
according to: author(s), study year/period, neoplasms
studied, indicator or variable used and type of association
found, as shown in the Tables 1, 2 and 3.
As can be verified in the Tables (1, 2 and 3) about
43% (n = 36) of the scientific productions are distributed
between 2009 and 2013. Regarding the neoplasm type
studied, 46 studies investigated the BC (Table 1),
18the
CC (Table 2) and 21 both of them at the same time
(Table 3). The social indicators used by the authors in
their research were as follows: education (n = 54)
14, 16, 17, 21, 25-6, 28-9, 31-3, 35-6, 39-44, 46-9, 52-3, 55-64, 66, 68-76, 78, 80, 82, 84-5, 87-8, 91, 94,
income and poverty (n = 46)
11-1, 16-24, 27-9, 36-40, 42, 44, 46, 48, 53-4, 65-8, 72-7, 79-80, 83-4, 87, 89, 93-5, labor market (n= 23)
28-9, 31-2, 36, 39, 44, 48, 50-1, 53, 62-3, 72, 74, 84, 86, 89-92, 94-5, habitation (n = 19)
14, 16-7, 31-2, 36, 40, 44, 48, 53, 68-9, 75-6, 81, 84, 87, 91, 94 31, demographic (n = 15)
12, 14, 17, 31, 34, 41, 45-6, 53, 65, 69, 78, 81, 90-1, race (n = 10)
18, 37, 46-7, 68, 74, 79, 83, 90, 94, infrastructure, (n=7)
12, 14, 17, 53, 69, 76, 87, health (n =
6)
14, 17, 32, 38, 42, 46, life quality (n = 3)
21, 28, 94, cultural (n =
2)
30, 54, environment (n = 2)
31, 53, violence and criminality
(n = 1)
31and one social inclusion and exclusion index
(n = 1)
15.
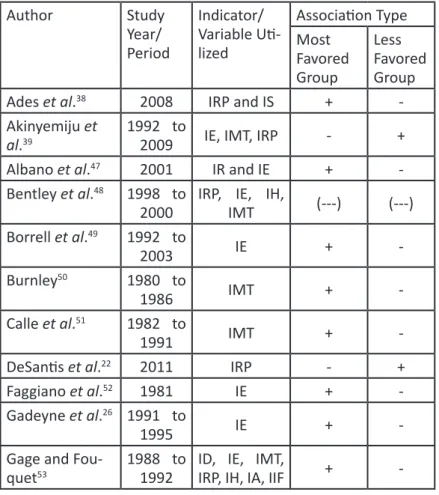
Table 1 – Summary of the breast cancer articles included in the integrative review.
Author
Study
Year/
Period
Indicator/
Variable
Uti-lized
Association Type
Most
Favored
Group
Less
Favored
Group
Ades et al.
382008
IRP and IS
+
-Akinyemiju et
al.
391992 to
2009
IE, IMT, IRP
-
+
Albano et al.
472001
IR and IE
+
-Bentley et al.
481998 to
2000
IRP, IE, IH,
IMT
(---)
(---)
Borrell et al.
491992 to
2003
IE
+
-Burnley
501980 to
1986
IMT
+
-Calle et al.
511982 to
1991
IMT
+
-DeSantis et al.
222011
IRP
-
+
Faggiano et al.
521981
IE
+
-Gadeyne et al.
261991 to
1995
IE
+
-Gage and
-Gerend and
Pai
541980 to
2006
IRP, IC
-
+
Geyer
951987 to
1996
IRP, IMT
(---)
(---)
Grubb et al.
401999 to
2009
IRP, IE, IH
+
-Harper et al.
111987 to
2005
IRP
+
-Heck et al.
551989 to
1993
IE
+
-Jaffe et al.
561982 to
1993
IE
(---)
(---)
Khang et al.
571995 to
2000
IE
+
-Kim et al.
581978 to
1985
IE
+
-Kinsey et al.
591993 to
2001
IE
+
-Lund and
Jaco-bsen
601970 to
1985
IE
+
-Martikainen;
Valkonen
611971 to
1995
IE
+
-Menvielle et
al.
621968 to
1996
IE, IMT
(---)
(---)
Menvielle et
al.
631975 to
1990
IE, IMT
(---)
(---)
Menvielle et
al.
431990 to
2000
IE
(---)
(---)
Nishi et al.
641958 to
2003
IE
-
+
Pollán et al.
651989 to
1998
ID, IRP
+
-Pudrovska and
Anikputa
291950 to
2005
IE, IMT, IRP
-
+
Russell et al.
301999 to
2003.
IC
-
+
Salcedo et al.
311994 to
2007
IMT, IE, ID,
IH, ICV, IA
+
-Sarfati et al.
661981 to
1999
IE, IRP
-
+
Shai
671979 to
1981
IRP
+
+
Sichieri et al.
681985
IE, IR, IRP, IH
(---)
(---)
Silva et al.
692000
IH, IE, ID, IIF
+
-Strand et al.
701990
IE
+
-Strand et al.
711990 to
-Association: +: Positive; -: Negative; (---): No association.
IA: Environmental Indicator, IC: Cultural Indicator, ICV: Violence and Criminality Indicator, ID: Demographic Indicator, IE: Educational Indicator, IEX: Social Exclusion Index, IH: Habitation Indicator, IIF: Infrastructure Indicator, IMT: Labor Market Indicator, IQV: Life Quality Indicator, IR: Race Indicator, IRP: Poverty Indicator, IS: Health Indicator.
Source: Elaborated by the author, 2015.
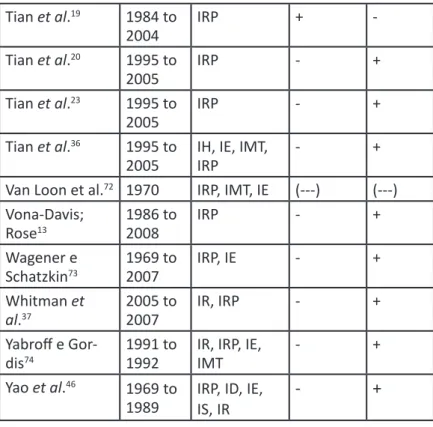
Note: All abbreviations in the “Indicator/Variable Utilized” section were kept as in the work original language. Table 2 – Summary of the cervical cancer articles included in the integrative review. .
Association: +: Positive; -: Negative; (---): No association.
IA: Environmental Indicator, IC: Cultural Indicator, ICV: Violence and Criminality Indicator, ID: Demographic Indicator, IE: Educational Indicator, IEX: Social Exclusion Index, IH: Habitation Indicator, IIF: Infrastructure Indicator, IMT: Labor Market Indicator, IQV: Life Quality Indicator, IR: Race Indicator, IRP: Poverty
Author
Study
Year/
Period
Indicator/
Variable
Uti-lized
Association Type
Most
Favored
Group
Less
Favored
Group
Antunes;
Wunsch--Filho
751980 to
2003
IE, IRP, IH
-
+
Du et al.
162000 to
2004
IRP, IE, IH
-
+
Gamarra
141996 to
2006
IRP
+ BC,
- CC
- BC,
+
CC
Gamarra et al.
171996 to
2005
IRP, IS, IH, IE,
ID, IIF
- after rate
correction
+ after
rate
cor-rection
Kim et al.
411996 to
2005
IRP, IS, IH, IE,
ID, IIF
- after rate
correction
+ after
rate
cor-rection
Tian et al.
191984 to
2004
IRP
+
-Tian et al.
201995 to
2005
IRP
-
+
Tian et al.
231995 to
2005
IRP
-
+
Tian et al.
361995 to
2005
IH, IE, IMT,
IRP
-
+
Van Loon et al.
721970
IRP, IMT, IE
(---)
(---)
Vona-Davis;
Rose
131986 to
2008
IRP
-
+
Wagener e
Schatzkin
731969 to
2007
IRP, IE
-
+
Whitman et
al.
372005 to
2007
IR, IRP
-
+
Yabroff e
Gor-dis
741991 to
1992
IR, IRP, IE,
IMT
-
+
Yao et al.
461969
to
Indicator, IS: Health Indicator.
Source: Elaborated by the author, 2015.
Note: All abbreviations in the “Indicator/Variable Utilized” section were kept as in the work original language.
Regarding the associations between social iniquity and mortality, a positive association was found in the groups with the
highest mortality rate and a negative association in those with the lowest. Considering the BC mortality, 58.2% (n = 39) of
the studies found a positive association in the most favored groups
11, 15, 19, 21, 24-7, 31, 38, 40, 45, 47, 49-53, 55, 57-61, 65, 67, 69-71, 82-92, 23.9% (n =
16) in the less favored groups
13, 20, 22-3, 29-30, 36-7, 39, 44, 46, 54, 64, 66, 73-4, 1.5% (n = 1) positive association in both groups
67and 16.4%
(n = 11) had no association found
43, 48, 56, 62-3, 68, 72, 80, 93-5. The CC results were 2.57% (n = 1) for finding a positive association
in the most favored groups
83,92.3% (n = 36) to the less favored groups
12, 14-8, 21, 24-5, 27-8, 32-5, 41-2, 44-5, 75-80, 82, 84-5, 87-94and 5.13% (n
= 2) had no association found
81, 86.
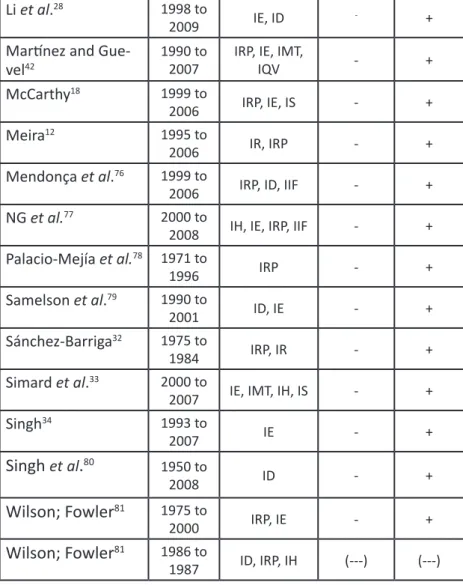
Table 3 – Summary of the articles included in the integrative review about breast and cervical cancers.
Studied neoplasm: BC – Breast Cancer; CC – Cervical Cancer. Association: +: Positive; -: Negative; (---): No association.
Li et al.
281998 to
2009
IE, ID
-+
Martínez and
Gue-vel
421990 to
2007
IRP, IE, IMT,
IQV
-
+
McCarthy
181999 to
2006
IRP, IE, IS
-
+
Meira
121995 to
2006
IR, IRP
-
+
Mendonça et al.
761999 to
2006
IRP, ID, IIF
-
+
NG et al.
772000 to
2008
IH, IE, IRP, IIF
-
+
Palacio-Mejía et al.
781971 to
1996
IRP
-
+
Samelson et al.
791990 to
2001
ID, IE
-
+
Sánchez-Barriga
321975 to
1984
IRP, IR
-
+
Simard et al.
332000 to
2007
IE, IMT, IH, IS
-
+
Singh
341993 to
2007
IE
-
+
Singh
et
al
.
801950 to
2008
ID
-
+
Wilson; Fowler
811975 to
2000
IRP, IE
-
+
Wilson; Fowler
811986 to
1987
ID, IRP, IH
(---)
(---)
Author
S t u d y
Year/Pe-riod
I n d i
-c a t o r /
Variable
Utilized
Association Type
Most
Favored
Group
Less
Favored
Group
Baena et al.
212000 to
IA: Environmental Indicator, IC: Cultural Indicator, ICV: Violence and Cri-minality Indicator, ID: Demographic Indicator, IE: Educational Indicator, IEX: Social Exclusion Index, IH: Habitation Indicator, IIF: Infrastructure Indicator, IMT: Labor Market Indicator, IQV: Life Quality Indicator, IR: Race Indicator, IRP: Poverty Indicator, IS: Health Indicator.
Source: Elaborated by the author, 2015.
Note: All abbreviations in the “Indicator/Variable Utilized” section were
kept as in the work original language.
DISCUSSION
Both BC and CC are important causes of mortality
among the female population. The results of most studies
presented in this review demonstrate that BC mortality has
been associated with groups of a high socioeconomic level,
while CC mortality has been related to groups with lower
socioeconomic status.
Bouchardy et al.
821978 to
1982
IE
+ BC,
- CC
- BC, + CC
Bray et al.
242008 to
2030
IRP
+ BC,
- CC
- BC, + CC
Chu et al.
831990 to
2000
IR, IRP
+
-Elstad et al.
251971 to
2002
IE
+ BC,
- CC
- BC, + CC
Faggiano et al.
841966 to
1994
IMT, IE,
IH, IRP
+ BC,
- CC
- BC, + CC
Fernandez and
Borrell
851992 to
1995
IE
+ BC,
- CC
- BC, + CC
Krieger et al.
271960 to
2006
IRP
+ BC,
- CC
- BC, + CC
MacArthur et al.
861950 to
1994
IMT
(---) CC
+ BC,
- BC, (---) CC
Matos et al.
871980 to
1986
IRP, IIF
IH, IE,
+ BC,
- CC
- BC, + CC
Menvielle et al.
881990
IE
+ BC,
- CC
- BC, + CC
Middelkoop et al.
891982 to
1991
IRP, IMT
+ BC,
- CC
- BC, + CC
Müller
151996 to
2005
IEX
+ BC,
- CC
- BC, + CC
Najem and Greer
901968 to
1977
IR, ID,
IMT
+ BC,
- CC
- BC, + CC
Philips Junior et
al.
442004 to
2008
IRP, IMT
IH, IE,
-
+
Polleto and
Mo-rini
911977 to
1981
IE, IMT,
IH, ID
+ BC,
- CC
- BC, + CC
Ribeiro and
Nar-docci
451998 to
2008
ID
+ BC,
- CC
- BC, + CC
Robinson and
Walker
921984 to
1995
IMT
+ BC,
- CC
- BC, + CC
Smailyte et al.
352001 to
2004
IE
(---) BC,
- CC
(---) BC, + CC
Smith et al.
931987 to
1991
IRP
(---) BC,
- CC
(---) BC, + CC
Williams et al.
941979 to
1983
IMT, IR,
IE, IH,
IQV
(---) BC,
- CC
(---) BC, + CC
In the Americas, BC mortality rates from 2000 to 2009
were low in El Salvador and Guatemala, while in Brazil,
Canada and in the United States of America intermediate
values have been found. For the CC, annual rates are high
in El Salvador, Nicaragua and Paraguay, and lower rates
were found in Canada, Puerto Rico and the United States of
America. The authors point out that in Brazil, the BC death
rate is higher than by CC, and also highlighted that the CC
disproportionately affects women residing in poorer areas.
96In Brazil, the BC showed an increasing trend since 1980
and, at the end of the 1990s, started showing a decrease for
women living in the capitals. From 1980 to 2010, the BC
mortality rates increased in the Brazilian States with the
increase of the positive indicators of socioeconomic level,
although started to decrease as the negative indicators began
increasing, among them the fertility rate.
97To Ribeiro et.al.
98,
this latter indicator is due to greater exposure to risk factors,
such as: oral contraceptive use, breastfeeding, overweight and
obesity, and family history. Reproductive risk factors for BC
are related to hormone effects on the ovaries that begin at
puberty, continue with monthly cycles, and end at menopause.
After the fifth year using oral contraceptives significantly
increases the risk for BC. On the other hand, lactation exerts
a protective effect because it promotes the complete
diffe-rentiation of the mammary cells and by reducing the time of
exposure to the action of the sex hormones that decrease due
to the amenorrhea produced by breastfeeding. Overweight
and obesity increase the level of circulating estrogen since
the adipose tissue is the main site of estrogen synthesis in
postmenopausal women. However, the practice of physical
activity brings several benefits, including serum estrogen
reduction and helping in weight control.
99, 100, 101When assessing the society and its transformations over
the years, it has been verified that women’s lifestyle has
chan-ged over time and these changes reflect on their lifestyle habits
and behaviors. According to Fumis
102women residing in
more developed regions tend to postpone maternity, leaving
it to after the age of 30 and using contraceptives. Moreover,
heavy involvement with work may not provide sufficient time
for physical activities, which prevents them from enjoying
the protection benefits provided by these practices. On the
other hand, areas of better socioeconomic level have more
and more advanced resources for the detection and treatment
of cancer, as well as greater and easier access to these health
care services, which enable early diagnosis and cure. Barbosa
et al.
103observed that living in urban areas is associated with
a greater number of mammography exams being made.
Ribeiro et al.
98research suppose that women living in
areas of low socioeconomic level tend to seek treatment in
hospitals in the major centers and capitals due to the
grea-ter availability of resources, which contributes to increased
mortality in these areas. It is highlighted that in many cases,
the search for treatment may occur at an advanced stage,
where there is no longer a chance for the cancer cure.
Fur-thermore, the quality of death records in capitals is more
effective, which can increase the number of quantified cases.
Despite the improvement of the information systems in the
country in recent years, underreporting still occur in the
most remote regions.
104Regarding the CC mortality, it is verified that there is a
decreasing trend over the years. But, the increase in regions
with socioeconomic disadvantages is highlighted. In Brazil,
the low availability of health care services is associated with
regions with worse socioeconomic conditions. The early
detection of the CC is performed through the Papanicolaou
test. According to the World Health Organization, the
cove-rage of at least 80% of the target population and adequate
diagnosis/treatment can guarantee a average reduction of
about 60-90% of the incidence of CC. European and
Ame-rican countries that adopted this method had great success
in reducing mortality due to this neoplasm.
7Notwithstanding the existence of the screening test, it has
been observed that it is not equally available in all the country
regions. According to Santos et al.
105, the regions with worse
socioeconomic conditions present poor performance of the
agreed indicators for the CC control. Data from Fiocruz
106,
on the Health System Performance Evaluation, showed that
in 2008 the percentage of women in the group age from 25
to 64 years old that underwent the Papanicolaou test in the
last 3 years was 78.4%. The highest percentage was found
in the Southeast region and the lowest in the North and
Northeast regions.
Thuler et.al.
107studies confirmed that the socioeconomic
iniquities existing in Brazil are associated with the diagnosis
of the CC at an advanced stage. Regarding this
informa-tion, black women with low schooling are more likely to
be diagnosed for CC advanced-stage. From 1980 to 2010,
the CC mortality rates in the country’s capitals correlated
directly with negative socioeconomic status indicators. It was
observed a decrease in mortality in the South and Southeast
regions, however, for the North and Northeast regions this
fact occurred only within the capitals.
97There are regions where treatment is available, but with
more concentration in more developed areas, such as capitals,
for example. In general, populations of low socioeconomic
status tend to live in distant areas, and the difficulty of access
to large urban centers means that the assistance is performed
in the locality, where the resources are insufficient in most
cases.
1, 108According to the National Commission on Social
Deter-minants of Health
109, the individual socioeconomic
condi-tions generate socioeconomic stratification of a population,
attributing them different social positions, which in turns,
define the life and health conditions. According to Barata
110,
the way the different groups present themselves in society is
related to the patterns of work, consumption, practical
activi-ties of daily life, organizational forms or social participation,
politics and culture. Thus, some of these relationships are
beneficial and maintain health, and others are harmful and
disease producing, giving rise to the health-disease patterns
of social classes.
The social position occupied by the individual is reflected
in the differential exposure to risks that cause health damage,
vulnerability to disease occurrence from exposure to them
and social or physical consequences, once the disease is
con-tracted. In this sense, it is important to understand the real
factors associated with social iniquity and mortality related
to BC and CC in Brazil, since we live in a country where
wealth is inadequately distributed, which amplifies iniquities
and interferes in the population health state.
In the studies presented by this review, the three most
used indicators for assessing the association between social
iniquity and mortality related to BC and CC involved the
following themes: education, income/poverty, and the labor
market. The higher the educational level, the higher the risk
of death by BC, while the lower to happening by CC. This fact
might be explained by the greater exposure to risk factors.
Low schooling levels can be considered as a barrier to
assimilating knowledge about the disease, which may lead
people to expose themselves to risk factors because they do
not clearly understand how they increase the likelihood of
illness. High schooling levels, on the other hand, may provide
opportunities in the labor market that demand more time
and interfere with the accomplishment of physical activities,
postpone maternity and shorten the breastfeeding time,
which are protection factors in the case of BC occurrence.
Poverty is associated with low BC screening, greater
probability of end-stage diagnosis for this neoplasm, and
inadequate treatment provision. Deaths from CC are more
common in women living in poor areas. Higher death risk by
BC was observed among women that perform skilled
occu-pations, when compared to those who perform activities that
are either not valued or are not socially recognized, or even
that do not have remuneration, for example, housewives.
86, 92Most studies that did not find any association between
iniquity and the cancers under consideration here were
con-ducted before 1990, and in the past the information
under-reporting was greater than currently, especially in the most
underprivileged areas.
Few studies have involved Brazilian women and
morta-lity by BC, and among those conducted in the country, the
majority of them were performed in the São Paulo State. In
order to have an overview of the country with regard to social
iniquity and mortality related to BC, it is important to know
the reality of each State, once in Brazil there are intermediate
values of mortality for this cause. The most used indicators in
the reviews of this type of cancer were income/poverty and
educational, but not all those residing in a favored
socioe-conomically developed area have a better income and high
schooling levels, especially in a State like São Paulo, which
presents great diversity in the social conditions.
Regarding the CC cases, since there is a nationwide
scree-ning program in place, it is unacceptable that mortality is
still high, especially in poor areas. Since most of the studies
involved an educational indicator and the people behavior
reflects the knowledge they acquired throughout their lives, it
is emphasized that educational actions and written
informa-tion for women having low levels of educainforma-tion should have
simple language, be clear and prejudice free, especially with
regard to their choices, providing a better understanding and
approximation of health care services, then achieving equity.
Most studies are ecological, it is emphasized that these do
not refer to the analysis of the life and/or health situation at the
individual level. However, when it comes to social iniquity, the
results found can help understanding the people health
pro-blems, since the aggregate studies results are originated from
individual groups that experience the same reality daily. It is
due to the characteristics that bond them within a common
geographic space, as follows: basic sanitation absence, lack
or poor quality of public services, long distances traveled to
access the health care resources and various other barriers,
like the social, economic and health ones.
Social determinants such as income, education,
occupa-tion, availability/access to health care services, exposure to
diseases and among others; they are all causes of illness and
social iniquities in health care.
111As most determinants and
health determinants involve social aspects, the use of social
indicators becomes essential for measuring the problems
and evaluating health care outcomes. “Measuring iniquities
in living and health care conditions is the first step in order
to identify health care iniquities... since equity in health care
services is vital to regional economic development.”
112Hence,
it is necessary to establish very specific indicators
CONCLUSIONS
Areas with high social iniquity have higher mortality
by CC, and the areas with higher socioeconomic level have
higher mortality by BC. These phenomena have several
expla-nations: personal lifestyle, offer and accessibility to screening
services and/or treatment, social stratification based on the
economic model adopted in the country. These factors may
be appropriate when taking into consideration the analysis
of each particular area, in which they are most frequent in
order to improve the life quality and the population health.
Assessing the population health conditions requires the
use of indicators capable of detecting reality and changes
in society over time and space. A good indicator should be
available on an easily accessible basis, have a large coverage
and periodic updating, and low time investment and
resour-ces in obtaining it. The information on the indicators most
used in the studies are easily accessible in our country and
to obtain them there is no cost whatsoever, since they are
made available on national and public sites of the institutions
responsible for their collection, consolidation, analysis and
dissemination, among which it is possible to mention:
Ins-tituto Brasileiro de Geografia e Estatística (IBGE) [Brazilian
It is emphasized that health care equity is closely related to
the adequate provision of health care services and according
to the population needs. By knowing the reality of each area,
the manager can propose effective and specific strategies to
reduce the exposure to modifiable risk factors for BC and
CC, especially with regard to the iniquities in the provision of
health care services and resources that guarantee the survival,
health and well-being of the disadvantaged group and/or
population. Additionally, monitoring the indicators updating
can provide information that will help to assess the actions
implemented in order to modify them, improve them and/
or extend them when necessary.
REFERENCES
1. Oliveira EXG, Melo ECP, Pinheiro RS, Noronha CP, Carvalho MS. Acesso à assistência oncológica: mapeamento dos fluxos origem-destino das internações e dos atendimentos ambulatoriais. O caso do câncer de mama. Cad Saude Publica. 2011 fev ; 27(2): 317–26. 2. Instituto Nacional do Câncer (BR) [homepage na Internet]. INCA e
Ministério da Saúde apresentam estimativas de câncer para 2014. [acesso em 2014 Dez 20]. Disponível em: http://www2.inca.gov.br/ wps/wcm/connect/agencianoticias/site/home/noticias/2013/inca_ ministerio_saude_apresentam_estimativas_cancer_2014 3. Jemal A, Center MM, DeSantis C, Ward EM. Global patterns of
cancer incidence and mortality rates and trends. Cancer Epidemiol Biomarkers Prev. 2010 Jul 20; 19 (8): 1893-907.
4. Porter P. “Westernizing” Women’s Risks? Breast Cancer in LowerIncome Countries. N Engl J Med. 2008; 358: 213-6. 5. Tsu, VD, Jeronimo J, Anderson BO. Why the time is right to tackle
breast and cervical cancer in low-resource settings. Bull World Health Org. 2013 Sep 1; 91(9): 683–90.
6. Instituto Nacional do Câncer (BR) [homepage na Internet]. Tipos de Câncer. Mama. 2014. [acesso em 2014 Dez 20]. Disponível em: http://www2.inca.gov.br/wps/wcm/connect/tiposdecancer/site/ home/mama
7. Instituto Nacional do Câncer (BR) [homepage na Internet]. Tipos de Câncer. Colo do Útero. 2014. [acesso em 2014 Dez 20] Disponível em: http://www2.inca.gov.br/wps/wcm/connect/tiposdecancer/site/ home/colo_utero
8. Souza MT, Silva MD, Carvalho S. Revisão integrativa: o que é e como fazer. Revista Einstein. 2010; 8(1): 102-6.
9. Madeira, AMF, Silveira MR, Bastos MAR, Teixeira VMN. Investigando questões de educação na área da saúde. Apostila do Curso de Especialização de Formação Pedagógica para Profissionais de Saúde. Módulo VII. Universidade Federal de Minas Gerais. Belo Horizonte, 2014.
10. Januzzi PM. Indicadores Sociais no Brasil: conceitos, fontes de dados e aplicações. 5ª Edição. São Paulo: Editora Alínea, 2012. 11. Harper S, Lych J, Meersman SC, Breen N, Davis WW, Reichman
MC. Trends in area-socioeconomic and race-ethnic disparities in breast cancer incidence, stage at diagnosis, screening, mortality, and survival among women ages 50 years and over (1987-2005). Cancer Epidemiol Biomarkers Prev. 2009 Jan; 18(1): 121–31. 12. Meira KC. Mortalidade por câncer de colo de útero no município
do Rio de Janeiro no período de 1999 a 2006 [dissertação]. Rio de Janeiro (RJ): Escola Nacional de Saúde Pública Sérgio Arouca, 2009. 13. Vona-Davis L, Rose DP. The influence of socioeconomic disparities
on breast cancer tumor biology and prognosis: a review. J Womens Health (Larchmt). 2009. 18(6): 883–93.
14. Gamarra CJ. Magnitude da mortalidade por câncer do colo do útero no Brasil, 1996-2005. [Tese]. Rio de Janeiro (RJ): Universidade do Estado do Rio de Janeiro; 2009.
15. MÜLLER, N. C. DA S. Mortalidade por câncer de mama e de colo do útero: Análise temporal e espacial, Município de São Paulo, 1996 a 2006 [dissertação]. São Paulo (SP): Universidade de São Paulo, 2009.
16. Du P, Lemkin A, Klushman B, Chen J, Roth RE, MacEachren A, et al. The roles of social domains, behavioral risk, health care resources, and chlamydia in spatial clusters of US cervical cancer mortality: Not all the clusters are the same. Cancer Causes and Control. 2010; 21(10):1669–83.
17. Gamarra CJ, Valente JG, Azevedo e Silva, G. Magnitude of mortality from cervical cancer in the Brazilian Northeast and socioeconomic factors. Rev Panam Salud Publica. 2010; 28(2): 100–6.
18. McCarthy AM, Dumanosvsky T, Visvanathan K, Kahn AR, Schymura MJ. Racial/ethnic and socioeconimic disparities in mortality among women diagnosed with cervical cancer in New York City, 1995-2006. Cancer Causes Control. 2010 Aug 1. 21(10): 1645–55.
19. Tian N, Wilson JG, Zhan FB. Female breast cancer mortality clusters within racial groups in the United States. Health Place. 2010; 16(2): 209–18.
20. Tian N, Goovaerts P, Zhan FB, Wilson JG. Identification of racial disparities in breast cancer mortality: does scale matter? Int Journal Health Geogr. 2010; 9: 35.
21. Baena A, Almonte M, Valencia ML, Martínez S, Quintero K, Sánchez GI. Tendencias e indicadores sociales de la mortalidad por cáncer de mama y cuello. Salud Publica Mex. 2011 nov-dic; 53(6): 486-92.
22. DeSantis C, Siegel R, Bandi P, Jemal A . Breast Cancer Statistics, 2011.
CA Cancer J Clin. 2011 Nov-Dec; 61(6): 409–18.
23. Tian N, Wilson JG, Zhan B. Spatial association of racial/ethnic disparities between late-stage diagnosis and mortality for female breast cancer: where to intervene? Int J Health Geogr. 2011. 10(1): 24.
24. Bray F, Jemal A, Grey N, Ferlay J, Forman, D. Global cancer transitions according to the Human Development Index (2008-2030): A population-based study. Lancet Oncol. 2012 Aug; 13(8): 790–01.
25. Elstad JI, Torstensrud R, Lyngstad TH, Kravdal O. Trends in educational inequalities in mortality, seven types of cancers, Norway 1971-2002. Eur J Public Health. 2012 Dec 13; 22(6): 771–6. 26. Gadeyne S, Deboosere P, Vandenheede H, Neels K. Does birth
history account for educational differences in breast cancer mortality? A comparison of premenopausal and postmenopausal women in Belgium. Int J Cancer. 2012; 131(12): 2878–85. 27. Krieger N, Chen JT, Kosheleva A, Waterman PD. Shrinking,
widening, reversing, and stagnating trends in US socioeconomic inequities in cancer mortality for the total, black, and white populations: 1960-2006. Cancer Causes Control. 2012 Feb. 23(2): 297–19.
28. Li X, Sundquist J, Calling S, Zoller B, Sundquist K. Neighborhood deprivation and risk of cervical cancer morbidity and mortality: A multilevel analysis from Sweden. Gynecol Oncol. 2012 Jul 20; 127(2): 283–9.
29. Pudrovska T, Anikputa B. The Role of Early-Life Socioeconomic Status in Breast Cancer Incidence and Mortality: Unraveling Life Course Mechanisms. J Ageing Health. 2012 Mar. 24(2): 323–44. 30. Russell EF, Kramer MR, Cooper HLF, Gabram-Mendola S,
Senior-Crosby D, Arriola KRJ. Metropolitan area racial residential segregation, neighborhood racial composition, and breast cancer mortality. Cancer Causes and Control. 2012; 23(9): 1519–27. 31. Salcedo N, Saez M, Bragulat B, Saurina C. Does the effect of gender
modify the relationship between deprivation and mortality? BMC Public Health. 2012; 12(1): 574-82.
32. Sánchez-Barriga JJ. Tendencias de mortalidad por cáncer cervicouterino en las siete regiones socioeconómicas y en las 32 entidades federativas de México en los años 2000-2008. Gac Med Mex. 2012; 148(1): 42–51.
33. Simard EP, Fedewa S, Ma J, Siegel R, Jemal A. Widening socioeconomic disparities in cervical cancer mortality among women in 26 states, 1993-2007. Cancer. 2012 Oct 15. 118(20): 5110–16.
34. Singh GK. Rural-urban trends and patterns in cervical cancer mortality, incidence, stage, and survival in the United States, 1950-2008. J Community Health. 2012. 37(1): 217–23.
35. Smailyte G, Jasilionis D, Ambrozaitiene D, Stankuniene V. Educational inequalities in cancer incidence and mortality in Lithuania: A record linkage study. Cancer Epidemiol. 2012 Jun 15; 36(5): e279–83.
36. Tian N, Goovaerts P, Zhan FB, Chow TE, Wilson JG. Identifying Risk Factors for Disparities in Breast Cancer Mortality among African-American and Hispanic Women. Womens Health Issues. 2012; 22(3): e267–e76.
37. Whitman S, Orsi J, Hurlbert M. The racial disparity in breast cancer mortality. J Community Health. 2011; 36(4): 588-96.
38. Ades F, Senterre C, Azambuja E, Sullivan R, Popescu R, Parent F, Piccart M. Discrepancies in cancer incidence and mortality and its relationship to health expenditure in the 27 European Union member states. Ann Oncol. 2013 Sep 28; 24(11): 2897–902. 39. Akinyemiju TF, Soliman AS, Copeland G, Banerjee M, Schawartz
K, Merajver SD. Trends in Breast Cancer Stage and Mortality in Michigan (1992-2009) by Race, Socioeconomic Status, and Area Healthcare Resources. PLoS ONE. 2013 Apr; 8(4): 1–9. 40. Grubb MCM, Kilbourne B, Kihlberg C, Levine RS, Hood DB.
Demographic and geographic variations in breast cancer mortality among U.S. Hispanics. J Health Care Poor Underserved. 2013 Feb 1; 24(1): 140–52.
41. Kim MH, Song YM, Kim BK, Park SM, Ko GP. Trends in cervical cancer mortality by socioeconomic status in Korean women between 1998 and 2009. Korean J Fam Med. 2013 Jul. 34(4): 258–64. 42. Martínez ML, Guevel CG. Desigualdades sociales en la mortalidad
por cáncer de cuello de útero en la ciudad autónoma de buenos aires, 1999-2003 y 2004-2006. Salud Colect. 2013 may-ago; 9(2), 169–82.
43. Menvielle G, Rey G, Jougla E, Luce D. Diverging trends in educational inequalities in cancer mortality between men and women in the 2000s in France. BMC Public Health. 2013; 13(1): 823-31.
44. Philips Junior BU, Belasco E, Markldes KS, Gong G. Socioeconomic deprivation as a determinant of cancer mortality and the Hispanic paradox in Texas, USA. Int J Equity Health. 2013 Apr 15; 12(26): 26-34.
45. Ribeiro AA, Nardocci, A C. Desigualdades socioeconômicas na incidência e mortalidade por câncer : revisão de estudos ecológicos, 1998-2008. Saúde Soc. 2013; 22(3): 878–91.
46. Yao N, Lengerich EJ, Hillemeier MM. Breast Cancer Mortality in Appalachia: Reversing Patterns of Disparity over Time. J Health Care Poor Underserved. 2012 May. 23(2): 715–25.
47. Albano JD, Ward E, Jemal A, Anderson R, Cokkinides VE, Murray T, et al. Cancer mortality in the United States by education level and race. J Natl Cancer Inst. 2007 Sep 19; 99(18):1384–94. 48. Bentley R, Kavanagh AM, Subramanian SV, Turrell G. Area
disadvantage, individual socio-economic position, and premature cancer mortality in Australia 1998 to 2000: A multilevel analysis. Cancer Causes Control. 2008; 19(2): 183–93.
49. Borrell C, Dell’Olmo MM, Palencia L, Gotsens M, Burstrom BO, Domínguez-Berjón F, et al. Trends in socioeconomic mortality inequalities in a southern European urban setting at the turn of the 21st century. J Epidemiol Community Health. 2008; 62(3): 258–66. 50. Burnley IH. Mortality from selected cancers in NSW and Sydney,
Australia. Soc Sci Med. 1992; 35(2): 195–08.
51. Calle EE, Murphy TK, Rodriguez C, Thun MJ, Heath CW. Occupation and breast cancer mortality in a prospective cohort of US women. Am J Epidemiol. 1998; 148(2): 191–7.
52. Faggiano F, Lemma P, Costa G, Gnavi R, Pagnanelli F. Cancer mortality by educational level in Italy. Cancer Causes and Control. 1995; 6(4): 311–20.
53. Gage H, Fouquet R. Explaining breast cancer mortality in England: The effect of socio-economic factors and health care service. Eur J Cancer Prev. 1997 Mar; 6(4): 1–27.
54. Gerend MA, Pai M. Social determinants of black-white disparities in breast cancer mortality: A review. Cancer Epidemiol Biomarkers Prev. 2008 Nov; 17(11): 2913–23.
55. Heck KE, Wagener DK, Schatzkin A, Devesa SS, Breen N. Socioeconomic status and breast cancer mortality, 1989 through 1993: An analysis of education data from death certificates. Am J Public Health. 1997 Jul; 87(7): 1218–22.
56. Jaffe DH, Eisenbach Z, Neumark YD, Manor O. et al. Does one’s own and one’s spouse’s education affect overall and cause-specific mortality in the elderly? Int J Epidemiol. 2005; 34(6): 1409–16. 57. Khang YH, Lynch JW, Kaplan GA.; et al. Health inequalities in
Korea: Age- and sex-specific educational differences in the 10 leading causes of death. Int J Epidemiol. 2004; 33(2): 299–08. 58. Kim C, Eby E, Piette JD. Is education associated with mortality for
breast cancer and cardiovascular disease among black and white women? Gend Med. 2005; 2(1): 13–8.
59. Kinsey T, Jemal A, Liff J, Ward E, Thun M. Secular trends in mortality from common cancers in the United States by educational attainment, 1993-2001. J Natl Cancer Inst. 2008 Jul 16; 100(14): 1003–12.
60. Lund E, Jacobsen BK. Education and breast cancer mortality: experience from a large Norwegian cohort study. Cancer Causes Control. 1991; 2(4): 235–38.
61. Martikainen P, Valkonen T. Diminishing educational differences in breast cancer mortality among Finnish women: A register-based 25-year follow-up. Am J Public Health. 2000 Feb; 90(2): 277–80. 62. Menvielle G, Leclerc A, Chastang J-F, Luce D. Social inequalities in breast cancer mortality among French women: disappearing educational disparities from 1968 to 1996. Br J Cancer. 2006; 94(1): 152–5.
63. Menvielle G, Luce D, Geoffroy-Perez B, Chastang JF, Leclere A, Kodama K. Social inequalities and cancer mortality in France, 1975-1990. Cancer Causes Control. 2005; 16(5): 501–13. 64. Nishi N, Sugiyama H, Hsu WL, Soda M, Kasagi F, Mabuchi K.
Differences in mortality and incidence for major sites of cancer by education level in Japanese population. Ann Epidemiol. 2008 Jul; 18(7): 548–91.
65. Pollán M, Ramis R, Aragonés N, Pérez-Gómez B, Gómez D, Lopes V. Municipal distribution of breast cancer mortality among women in Spain. BMC cancer. 2007 May 8; 7: 78-91.
66. Sarfati D, Blakely T, Shaw C, Cormack D, Atkinson J. Patterns of disparity: Ethnic and socio-economic trends in breast cancer mortality in New Zealand. Cancer Causes Control. 2006; 17(5): 671–8.
67. Shai D. Cancer mortality, ethnicity, and socioeconomic status: two New York City groups. Public Health Rep. 1986 Sep-Oct; 101(5): 547–2.
68. Sichieri R, Lolio CA, Correia VR, Everhart JE. Geographical patterns of proportionate mortality for the most common causes of death in Brazil. Rev. Saúde Pública 1992 out 23; 26(6): 424–0. 69. Silva VL, Leal MCC, Marino JG, Marques APO. Associação
entre carência social e causas de morte entre idosos residentes no Município de Recife, Pernambuco, Brasil. Cad. Saúde Pública. 2008 mai; 24(5): 1013–23.
70. Strand BH, Kunst A, Huisman M, Menvielle G, Glickman M, Bopp M, et a. The reversed social gradient: Higher breast cancer mortality in the higher educated compared to lower educated. A comparison of 11 European populations during the 1990s. Eur J Cancer. 2007; 43(7): 1200–7.
71. Strand, B. H. et al. Is birth history the key to highly educated women’s higher breast cancer mortality? A follow-up study of 500,000 women aged 35-54. Int J Cancer. 2005; 117(6): 1002–6. 72. Van Loon AJM, Brandt PAVD, Goldbohm R A. Differences in
cancer incidence and mortality among socioeconomic groups. Scand J Soc Med. 1995; 23(2): 110–20.
73. Wagener DK, Schatzkin A. Temporal trends in the socioeconomic gradient for breast cancer mortality among US women. Am J Public Health. 1994 Jun; 84(6): 1003–6.
74. Yabroff KR, Gordis L. Does stage at diagnosis influence the observed relationship between socioeconomic status and breast cancer incidence, case-fatality, and mortality? Soc Sci Med. 2003; 57(12): 2265–79.
75. Antunes JLF, Wünsch-Filho V. The effect of performing corrections on reported uterine cancer mortality data in the city of São Paulo. Braz J Med Biol Res. 2006 Apr 5; 39(8): 1091–9.
76. Mendonça VG, Lorenzato FRB, Mendonça JG, Menezes TC, Guimarães MJB. Mortalidade por câncer do colo do útero: características sociodemográficas das mulheres residentes na cidade de Recife, Pernambuco. Rev.Bras.Ginecol Obstet. 2008; 30(5): 248-255.
77. Ng E, Wilkins R, Fung MFK, Berthelot JM. Cervical cancer mortality by neighbourhood income in urban Canada from 1971 to 1996. Cma. 2004 May 11. 170(10): 1545–49.
78. Palacio-Mejía LS, Rangel-Gómez G, Avila MHA, Lazcano-Pince E. Cervical cancer, a disease of poverty: Mortality differences between urban and rural areas in Mexico. Salud Publica Mex. 2003; 45(S3): S15-S25.
79. Samelson EJ, Speers MA, Ferguson R, Bennett C. Racial differences in cervical cancer mortality in Chicago. Am J Public Health. 1994 Jun; 84(6): 1007–9.
80. Singh GK, Miller BA, Hankey BF, Edwards B. Persistent area socioeconomic disparities in U.S. incidence of cervical cancer, mortality, stage, and survival, 1975-2000. Cancer. 2004 Sep 1. 101(5): 1051–57.
81. Wilson SH, Fowler P. The social and demographic characteristics of women dying from cervical cancer in Nottingham. Public Health. 1990; 104(6): 449–55.
82. Bouchardy C, Parkin DM, Khlat M, Mirra AP, Kogevinas M, Lima FD, et al. Education and Mortality from Cancer in São Paulo, Brazil. AEP. 1993 Jan; 3(1): 64-70.
83. Chu KC, Miller BA, Springfield SA. Measures of racial/ethnic health disparities in cancer mortality rates and the influence of socioeconomic status. J Natl Med Assoc. 2007 Oct; 99(10):1092– 100, 1102–4.
84. Faggiano F, Partanen T, Kogevinas M, Boffeta P. Socioeconomic differences in cancer incidence and mortality. IARC Sci Publ. 1997; 138: 65–176.
85. Fernandez E, Borrell C. Cancer mortality by educational level in the city of Barcelona. Br J Cancer. 1999; 79(3-4): 684–9. 86. MacARthur AC, Le ND, Abanto ZU, Gallagher RP. Occupational
female breast and reproductive cancer mortality in British Columbia, Canada, 1950-94. Occup Med (Lond). 2007 Feb 22; 57(4): 246–53.
87. Matos EL, Loria DI, Vilensky M. Cancer mortality and poverty in Argentina: A geographical correlation study. Cancer Epidemiol Biomarkers Prev. 1994 Apr-May; 3(3): 213–18.
88. Menvielle G, Kunst AE, Stirbu I, Strand BH, Borrell C, Leclerc A, et al. Educational differences in cancer mortality among women and men: a gender pattern that differs across Europe. Br J Cancer. 2008; 98(5): 1012–19.
89. Middelkoop BJ, Struben HWA, Burger I, Vroom-Jongerden JM. Urban cause-specific socioeconomic mortality differences. Which causes of death contribute most? Int J Epidemiol. 2001; 30(2): 240–7. 90. Najem GR, Greer TW. Female reproductive organs and breast
cancer mortality in New Jersey counties and the relationship with certain environmental variables. Prev Med. 1985; 14 (5): 620–35. 91. Polletto L, Morini JC. Cancer mortality and some socio economic
correlates in Rosario, Argentina. Cancer Lett. 1990; 49(3): 201–5. 92. Robinson CF, Walker JT. Cancer mortality among women
employed in fast-growing U.S. occupations. Am J Ind Med. 1999; 36(1): 186–92.
93. Smith D, Taylor R, Coates M. Socioeconomic differentials in cancer incidence and mortality in urban New South Wales, 1987-1991. Aust N Z J Public Health. 1996; 20(2): 129–37.
94. Williams J, Clifford C, Hopper J, Giles G. Socioeconomic status and cancer mortality and incidence in Melbourne. Eur J Cancer. 1991; 27(7): 917–21.
95. Geyer, S. Social inequalities in the incidence and case fatality of cancers of the lung, the stomach, the bowels, and the breast. Cancer Causes and Control. 2008; 19(9): 965–74.
96. Luciani S, Cabanes A, Prieto-Lara E, Gawryszewski V. Cervical and female breast cancers in the Americas: current situation and opportunities for action. Bull World Health Organ. 2013 May 27; 91: 641-9.
97. Girianelli, VR, Gamarra CJ, Silva GA. Os grandes contrastes na mortalidade por câncer do colo uterino e de mama no Brasil. Rev. Saúde Pública. 2014; 48(3): 459–67.
98. RIBEIRO, M. S. et al. Urbanidade e mortalidade por cânceres selecionados em capitais brasileiras, 1980–2009. Cad. Saúde Coletiva. 2013; 21(1): 25-33.
99. Lodha RS, Nandeshwar S, Pal DK, Shrivastav A, Lodha KM, Bhagat VK. Risk Factors for Breast Cancer among Women in Bhopal Urban Agglomerate: A Case-Control Study. Asian Pac J Cancer Prev. 2011; 12: 2111-5.
100. Lauter DS, Berlezi EM, Rosanelli CLSP, Loro MM, Kolankiewicz ACB. Câncer de mama: estudo caso controle no Sul do Brasil. Rev. cienc. Saude. 2014 jan-abr; 7(1): 19-26.
101. Inumaru LE, Silveira EA, Naves MMV. Fatores de risco e de proteção para câncer de mama: uma revisão sistemática. Cad. Saúde Pública. 2011 jul; 27(7): 1259-70.
102. Fumis RRL. Um foco na saúde da mulher: o câncer feminino exige conhecimento, cuidado e prevenção. Rev.Bras. Med. 2013 dez 13; 70(4): 16-20.
103. Barbosa IR, Costa ICC, Pérez MMB, Souza DLB. Mortalidade por Câncer de Mama nos Estados do Nordeste do Brasil: Tendências Atuais e Projeções até 2030. Rev.Ciência Plural. 2015; 1(1): 4-14. 104. Borges DML, Sena MF, Ferreira MAF, Roncalli AG. Mortalidade
por câncer de boca e condição socioeconômica no Brasil. Cad. Saúde Pública. 2009 fev; 25(2): 321-7.
105. Santos RS, Melo ECP, Santos KM. Análise Espacial dos
Indicadores Pactuados para o Rastreamento do Câncer do Colo do Útero no Brasil. Revista Texto e Contexto de Enfermagem. 2012 oct-dez. 21(4): 800-10.
106. Fundação Oswaldo Cruz [homepage na Internet]. Rio de Janeiro (RJ): FIOCRUZ [acesso em 2015 jan 03]. Disponível em: http:// www.proadess.icict.fiocruz.br/index.php?pag=graf3
107. Thuler LCS, Aguiar SS, Bergmann A. Determinantes do diagnóstico em estadio avançado do câncer do colo do útero no Brasil. Rev Bras Ginecol Obstet. 2014; 36(6):237-43.
108. Roder D. Analyzing risk factors for poorer breast cancer outcomes in residents of lower socioeconomic areas of Australia. Aust Health Ver. 2014 Apr 8; 38(2):134 41.
109. Comissão Nacional sobre Determinantes Sociais da Saúde. As causas sociais das iniquidades em saúde no Brasil. Rio de Janeiro: Editora Fiocruz, 2008.
110. Barata RB. Como e por que as desigualdades sociais fazem mal à saúde. Rio de Janeiro: Editora Fiocruz, 2009.
111. Geib LTC. Determinantes sociais da saúde do idoso. Ciênc.Saúde Colet. 2012; 17(1):123-33.
112. Schneider MC. Métodos de mensuração das desigualdades em saúde. Rev Panam Salud Publica. 2002 set; 12(6):1-17
.