Cláudia Sofia Serre Miranda
Maio de 2013
Could the immunosenescence profile
among aged individuals be related with
their distinct cognitive performances?
UMinho|20
13
Cláudia Sofia Serr
e Miranda
Could t
he immunosenescence profile among aged individuals be related wit
h t
heir distinct cognitive per
formances?
Universidade do Minho
Escola de Ciências da Saúde
Trabalho realizado sob a orientação da
Doutora Susana Cristina Roque Oliveira
e co-orientação da
Prof.ª Doutora Maria Margarida Teles
Vasconcelos Correia-Neves
Cláudia Sofia Serre Miranda
Maio de 2013
Dissertação de Mestrado
Mestrado em Ciências da Saúde
Could the immunosenescence profile
among aged individuals be related with
their distinct cognitive performances?
Universidade do Minho
iii
v
AGRADECIMENTOS
Agradeço à Susana por acreditar em mim para levar este projecto a bom rumo, estando sempre pronta e disponível a ouvir a minha opinião. Se hoje me sinto uma pessoa melhor no “mundo da ciência” devo-o em grande parte a ti. Aprendi a não “comprar” tão facilmente as ideias dos outros, no entanto ainda tenho muito a aprender, não é? Agradeço acima de tudo a tua humanidade, porque mais que uma chefe és uma pessoa com quem posso contar.
À Margarida, um obrigado por todas as discussões e sugestões no decorrer deste trabalho. É uma honra pertencer aos “MCNs”.
Aos “MCNs” (Daniela, Bruno, Vitor, Palmira, Cláudia, Alice, Nuno) um especial obrigado por todo o apoio que me foram dando ao longo deste último ano, por todo o companheirismo e bom ambiente de trabalho. Obrigado por toda a paciência quando eu aparecia nas reuniões com aqueles mil e quinhentos slides com os plots de citometria ou com os resultados intermináveis (sei que a vossa vontade era esganar-me). Agradeço por todas as sugestões e discussões que foram proporcionando. Um muito obrigado em especial ao Vitor por toda a ajuda, principalmente, na fase inicial do trabalho e pela sua prontidão.
A todo o pessoal do I3.02 e do I2.01 (as duas minhas casas no instituto), agradeço o bom ambiente de laboratório que sempre me proporcionaram (e aos momentos de tagarelice também).
À Ana Maria, à Mika, à Vanessa, à Joana e à Sofia, obrigado por fazerem com que este último ano passasse a correr com as melhores lembranças possíveis, por todas as jantaradas e caminhadas ao final do dia. Mas acima de tudo, agradeço à Ana Rita, à Carla e à Margarida, literalmente a minha segunda família neste momento. Sem vocês a minha estadia aqui em Braga não seria a mesma. Adoro a sensação de chegar a casa e poder contar com a vossa amizade. Espero que nunca deixem de fazer parte da minha vida! Não desprezando ninguém, agradeço principalmente à Ana Rita. Este último ano aprendi muito contigo, a tua boa disposição e optimismo contagiam qualquer um. Sinto que mudei muito estes últimos dois anos graças à convivência contigo.
vi
Ao Tó, à Mariana, à Sara Rita e à Sara Freitas um muito obrigado por toda amizade que sempre demonstraram por mim. Contei e sei que posso continuar a contar com o vosso ombro amigo nos momentos mais difíceis (e nos momentos mais felizes também!).
E por último (o mais importante) agradeço à minha família. Aos meus pais por todo o apoio que sempre me deram, por acreditarem em mim e por me aturarem nos momentos mais complicados. Sempre que batia com a cabeça eles estavam lá para me amparar. Ao Filipe, apesar de andarmos sempre às turras, sem ele a minha vida não seria a mesma. À Letícia, por me fazer olhar para a vida com outros olhos (a simplicidade de uma criança às vezes tem destas coisas). Agradeço por me receberes sempre de braços abertos pronta a dar um beijo doce com aqueles olhinhos de felicidade por me ver. Isso não tem preço!
vii
ABSTRACT
Aging has been an important hallmark of the world’s population for the last decades. Some of the frequent alterations observed in older individuals are the progressive decline in immune function (immunosenescence) and in cognitive performance. In fact, in the last few years an increased body of evidences has highlighted the strong interaction between the immune system and cognitive functions. Particularly, the “low-grade inflammation”, frequently observed in older individuals, has been associated with cognitive decline. Moreover, immunocompromised individuals present cognitive dysfunction that is restored when the levels of immune cells return to normal. The findings follow animal data evidencing that mice devoid of adaptive immune system present cognitive deficits, which are reverted by T cell replenishment.
In this project we are using a novel strategy to investigate possible correlations between “immunosenescence phenotype” and “cognitive phenotypes” in a well characterized cohort of healthy agers with distinct cognitive performances. To achieve this objective we assessed the most relevant adaptive immune cell populations (lymphocytes, CD4+ and CD8+ T cell
compartments and regulatory T cells) by flow cytometry and compared them between good and poor cognitive performers. We observed that poor cognitive performance was associated with higher levels of effector memory CD4+ T cell and lower levels of naive CD8+ T cell. In order to
understand if adaptive immune cell components could have distinct impacts on different cognitive function we correlated percentages and counts of adaptive immune cell populations with memory and general cognition and executive function scores. Since several statistical significant correlations were obtained, we performed, with those variables, multiple linear regression models to ascertain if the immune parameters would be good predictors of memory and general cognition and executive function taking into account age and gender. Statistical significant models revealed that, besides age and/or gender, effector memory CD4+ T cells were
the immune parameter that showed to be a statistical significant predictor in all models. Since these cells are the major cytokine producers among T cells, the negative impact of the CD4+
effector memory T cells differential accumulation during aging can be mediated by the production of pro-inflammatory cytokines, which has been associated with cognitive impairments in older individuals.
The results from this work prompted us to hypothesize that an immune system that aged faster (presents more effector memory CD4+T cells), can be associated with poorer cognitive
performance. The identification of this immune phenotype associated with a specific cognitive performance contributed to the increased knowledge about the key players associated with age-related cognitive decline.
ix
RESUMO
Nas últimas décadas observou-se um envelhecimento crescente da população mundial. Algumas das alterações frequentemente observadas na população idosa são o declínio progressivo da função do sistema imunitário (imunosenescência) e do desempenho cognitivo. De facto, nos últimos anos tem havido um número crescente de estudos que destacam a interacção entre o sistema imunitário e a função cognitiva. Um dos exemplos é associação do ligeiro aumento do estado inflamatório, observado frequentemente na população mais envelhecida, com o declínio cognitivo. Para além disso, indivíduos imunossumprimidos apresentam défices cognitivos que desaparecem quando os números de células do sistema imunitário afectadas aumentam para valores normais. Estudos em animais também mostram que a depleção de linfócitos T está associada a défices cognitivos que podem ser revertidos pela administração de células T.
Neste projecto estamos a usar uma estratégia inovadora para investigar possíveis correlações entre um “fenótipo de imunosenescência” e um “fenótipo cognitivo” numa população de idosos saudáveis com padrões distintos de perfis cognitivos. Para atingir este objectivo foram analisadas as populações de células mais relevantes do sistema imunitário adaptativo (linfócitos, compartimentos das células T CD4+ e CD8+ e células T reguladoras) por
citometria de fluxo e comparadas entre indivíduos com má ou boa performance cognitiva. Observamos que os indivíduos com pior desempenho cognitivo apresentavam valores mais elevados de células T CD4+ efectoras de memória e valores mais baixos de células T CD8+ naive.
Para esclarecer se a componente celular do sistema imunitário adaptativo poderia ter um impacto diferencial nos diferentes domínios cognitivos, fomos correlacionar percentagens e números totais de células do sistema imunitário adaptativo com os valores calculados para a função de memória e executiva. Uma vez obtidas várias correlações estatisticamente significativas, usamos essas variáveis num modelo de regressão múltipla de forma a averiguar se os parâmetros imunitários poderiam predizer as capacidades cognitivas como memória e função executiva, tendo em consideração os factores idade e género. Os modelos obtidos (estatisticamente significativos) revelaram que, para além da idade e/ou do género, as células T CD4+ efectoras de memória eram o parâmetro imunitário que apresentava ser consistentemente
um bom preditor em todos os modelos. Uma vez que estas células são as principais produtoras de citocinas entre as células T, o impacto negativo da acumulação diferencial das células T CD4+
efectoras de memória durante o envelhecimento pode ser mediado pela produção de citocinas pró-inflamatórias, que têm sido associadas com o mau desemprenho cognitivo em indivíduos mais velhos.
x
Os resultados deste trabalho levaram-nos a colocar a hipótese de que um sistema imunitário que envelhece mais rápido (que apresenta mais células efectoras) pode estar associado a um pior desempenho cognitivo. A identificação de um fenótipo imunitário associado a um perfil cognitivo específico, contribui para o aumento do conhecimento acerca dos factores associados com o declínio cognitivo que normalmente ocorre durante o envelhecimento.
xi
CONTENTS
Agradecimentos ... v Abstract ... vii Resumo ... ix Contents... xiAbbreviations list ... xiii
1. Introduction ... 1
1.1. Age-related cognitive decline ... 3
1.2. Immunosenescence ... 5
1.3. The role of the immune system on cognitive functions ...10
2. Research Objectives ...19
3. Material and methods ...23
3.1. Participants characterization ...25
3.2. Flow Cytometry Analysis ...26
3.3. Statistical Analysis ...27
4. Results ...29
4.1 . Characterization of leukocyte profile ...31
4.2. Adaptive immune cell profile: differences between distinct cognitive performers ...32
4.3. Correlations of the adaptive immune cell populations with memory and general executive function ...37
4.4. Regression models to address if adaptive immune compartments can predict cognitive functions ...41
5. Discussion and Conclusions ...45
6. References ...55
xiii
ABBREVIATIONS LIST
APC Antigen Presenting Cells
BCSFB Blood Cerebrospinal Fluid Barrier
BDNF Brain Derived Neurotrophic Factor
CCL C-C Chemokine Ligands
CCR C-C Chemokine Receptor
CD Cluster of Differentiation
CM Central Memory
CNS Central Nervous System
CRP C-Reactive Protein
CSF Cerebrospinal Fluid
DC Dendritic Cells
EM Effector Memory
EXEC General Cognition executive function dimension
Foxp3 Forkhead box P3
GDS Mood dimension/Geriatric Depression Scale
HLA-DR Human Leukocyte Antigen - DR
IFN Interferon
IGF Insulin-like Growth Factor
IL Interleukin
LD Late Differentiated
M Mean
M2 “Alternatively” Activated Myeloid Cells
MEM Memory Dimension
MHC Major Histocompatibility Complex
MIP Macrophage Inflammatory Protein
MWM Morris Water Maze
NK Natural Killer Cells
NKT Natural Killer T Cells
xiv
r Pearson´s correlation coefficient
ROS Reactive Oxygen Species
SCID Severe Combined Immune Deficient
SD Standard Deviation
t T-test
Tc Cytotoxic T-lymphocytes
TCR T Cell Receptor
Tfh Follicular Helper T Cells
Th Helper T-lymphocytes
TLR Toll-like Receptor
TNF Tumor Necrosis Factor
Tr1 Regulatory Type 1 Cells
Tregs Regulatory T cells
U Mann-Whitney U test
WT Wild type
1
3
Population aging has been one of the last decade’s hallmarks and it is expected to increase in the years to come, being a major concern of modern societies. According to the United Nations Program on Aging, one out of every ten persons is now 60 years old or above, and by 2050 this number is expected to increase to one out of five (DESA United Nations 2001). The Portuguese population also reflects this trend. In the last 10 years the population with more than 65 years old increased from 16% to 19% and the aging index, which reflects the proportion of older population in relation to the younger population, increased from 102 in 2001 to 128 in 2011, meaning that for each 100 young there are 128 older individuals (Instituto Nacional de Estatística 2012).
Aging is a multidimensional process related with social, physical, biological/biochemical, (brain) structural, cognitive and psychological parameters. Thus, the current trend and estimation on population aging seems extremely worrying when considering that aging is associated with several pathologies or decline of several abilities. Among them, one of the functions that gradually decline with age is cognition (Salthouse 2010; Deary et al. 2009; Paulo et al. 2011). As such, accompanying the clinical measures that support living longer years, and to ensure the mental and cognitive wellbeing of older individuals into their elder years, the scientific community faces the need to identify predictive factors for cognitive aging so to understand, halt or delay cognitive-aging related aspects. This would ultimately allow for continued functionality and independence of the individual throughout aging, positively reflecting in his/her continued overall quality of life.
1.1. AGE-RELATED COGNITIVE DECLINE
During normal aging, the trajectory of cognitive performance is a heterogeneous process that affects differently the two major (so termed) types of cognitive processes: the “crystalized” and the “fluid” abilities. In general, the “crystalized” abilities, which are the acquired knowledge, can be evaluated by tests of general information or vocabulary; while the more “fluid” abilities, which including reasoning, memory and speed capacity, can be evaluated by neurocognitive tests directed towards those parameters (that is, overall reasoning and novel problem solving) (Salthouse 2012). Summarily, it is overall considered, albeit with great variability and/or dispersion, that while for measures representing products of processing carried out in the past (knowledge) may not decline (or even increase), until middle age onward. The “fluid” abilities, that represent efficiency and effectiveness of processing carried out at the time of assessment,
4
may start to decline well previous to entering the “senior years” (Salthouse 2010; Salthouse 2012; Salthouse 2009). This possibly means that the ability of solving novel problems is more sensitive to age than knowledge acquired during life (Salthouse 2012). Regardless, all of our cognitive abilities are intrinsically important for carrying out daily activities, living independently and overall continued enriching lifestyle (Salthouse 2012). As such, their loss (cognitive decline) may lead to a progressive decline in the quality of life and it is, in fact, one of the most feared aspects of growing old, including underlying admissions to institutional care (Deary et al. 2009).
Interestingly, however, cognitive performance in healthy aging is associated with an inter-individual (diversity) and intra-inter-individual (dispersion) variability (Paulo et al. 2011). While some people present cognitive decline with aging, others remain stable or even improve throughout life (Salthouse 2010), and also the same individual may perform differently in different cognitive domains (Salthouse 2010; Paulo et al. 2011) in different periods throughout aging. To understand the mechanisms behind the variability there is an increased research effort trying to identify the predictors for this differential cognitive aging. The approach ranges from identification of risk factors (or mechanisms) for cognitive decline in a multitude of parameters, including: genetics, general health, biological processes such as inflammation, neurobiological changes, diet, lifestyle, education, social engagement and socio-demographic/economic characteristics (Deary et al. 2009; Paulo et al. 2011).
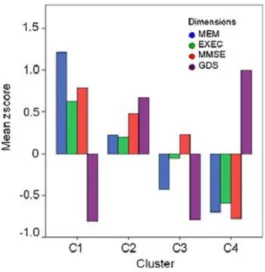
In a recent study from our group, healthy individuals, between 50 and 91 years old from the Minho region of Portugal, were submitted to a battery of neurocognitive and psychological tests to assess short-term verbal memory, verbal working memory, response inhibition/cognitive flexibility, verbal fluency, multiple trial verbal learning and memory, high level information processing speed, global cognitive status, and mood [evaluated by the geriatric depression scale (GDS)] (Santos et al. 2012). Using principal component analysis, four significant dimensions of cognitive performance and mood status were identified: memory (MEM) and executive function (EXE) (encompassing multiple test variables), and global cognitive status (MMSE) and mood (GDS) (both single test based dimensions). Cluster analysis revealed four different categories of cognitive performers (Figure 1): a “good” (cognitive) group subdivided as C1 and C2, and a “poor(er)” (cognitive) group subdivided as C3 and C4 cognitive performers. Interestingly, however, mood was the principal factor contributing to the separation between C1 and C2, as well as, between C3 and C4 (Santos et al. 2012), indicating that it may work as a precipitating factor within performance groups, while other factors (age, gender and educational status) may
5
underlie being already either in the “good” or “poor” group. For instance, previous work by the group, had shown that social inclusion and higher educational level are beneficial factors for the cognitive performance in older population (Paulo et al. 2011).
Figure 1. Cluster analysis. Mean performance zscores by clusters in the MEM, EXEC, MMSE and GDS
dimensions (adapted from (Santos et al. 2012))
1.2.
IMMUNOSENESCENCELikewise cognitive function, the immune system also progressively declines over the years, which is known as “immunosenescence”.
The main role of the immune system is to perform the surveillance of the organism and participate in the maintenance of body homeostasis. Cells that constitute the immune system have the ability to distinguish between the self and the non-self and are divided in two main types of cells that constitute the innate and adaptive components of the immune system. The innate immune system identifies the non-self in a non-specific manner, while the adaptive immune response recognizes specific antigens. During immune response these two components of the immune system communicate with each other. This interaction is essential to establish effective immune response but it suffers alterations during aging, resulting in an increased susceptibility to certain infections, increased predisposition to autoimmune disorders and reduced response to vaccination (Orsini et al. 2012).
6
INNATE IMMUNITY
The innate immune system is composed by several cell types including neutrophils, monocytes/macrophages, dendritic cells (DC), natural killer (NK) and natural killer T (NKT) cells, which constitute the first line of defense. It is usually triggered when non-self molecules are recognized by pattern recognition receptors, such us toll-like receptors (TLR) that recognize molecules conserved among a broad group of pathogens. As we age, the innate immunity undergo both quantitative and quantitative alterations (Shaw et al. 2010).
Neutrophils constitute the first immune cell defense against bacteria, yeast and fungal infections, being the first cells to arrive at the sites of damage. They fight against infection through the generation of reactive oxygen and nitrogen species, release of proteolytic enzymes, and microbicidal peptides from cytoplasmic granules (Shaw et al. 2010). While the number of neutrophils is well preserved in the older individuals, some of their functions are reduced, for instance reduced chemotactic activity, phagocytic capacity, free radicals production (Shaw et al. 2010; Larbi et al. 2008; Wenisch et al. 2000; Hakim et al. 2004). These changes result in the reduced ability to control infections, but also inhibit the interaction with the adaptive immune system (Wessels et al. 2010).
Monocytes, which are important in recognition and clearance of invaders through their pattern recognition receptors, represent a highly mobile component of the innate immune system located mainly in the spleen and blood. They respond to inflammation differentiating into antigen presenting cells (APC) such as macrophages and dendritic cells (Shaw et al. 2010). These cells process antigens and present them to T cells in the context of MHC (major histocompatibility complex). T cell recognizes these complexes through their T-cell receptors (TCRs). With age, although there is an increase of monocytes in absolute numbers, their function has been described to become impaired (Della Bella et al. 2007). The increase in monocyte numbers also contrasts with a decreased in macrophages function such as reduced activation through TLR (Shaw et al. 2010), chemotaxis and phagocytic activity (Panda et al. 2009), decreased antigen presentation possibly due the reduction of MHC class II expression with age (Larbi et al. 2008; Villanueva et al. 1990) and also increased pro-inflammatory cytokine production (Fulop et al. 2011).
DC are professional APC and play critical roles in the initiation and definition of the immune response profile linking the innate and adaptive immunity (MacDonald et al. 2002). They capture and process antigens in the periphery and migrate to the draining lymph nodes where
7
they present the antigens to T cells, inducing an antigen specific response by the adaptive immune system (Orsini et al. 2012). In general, aging induces a decrease in DC function. Reports suggest that DC present impairments in phagocytic and migration functions, alterations in the antigen presentation capacity and cytokine output (Shaw et al. 2010; Fulop et al. 2011; Della Bella et al. 2007). Regarding the age-related numerical alterations, various studies, up to now, have shown controversial results: while some report no alterations either in terms of phenotype or number, others demonstrate that aging is associated with decreased in total number of blood DC and in the two main subsets (lymphoid and myeloid subsets) (Orsini et al. 2012; Fulop et al. 2011; Jing et al. 2009).
NK and NKT cells are cytotoxic cells that play a significant role in innate defense against viral infected cells and tumors. Besides their cytotoxic activity, NK(T) cells express cytokines and chemokines that are required at driving the adaptive immune response (Solana & Mariani 2000; Mocchegiani et al. 2009). In humans, NK can be subdivided taking into account the expression of CD56 (CD56bright cells and CD56dimNK cells) (Chidrawar et al. 2006). Older individuals present
increased levels of CD56dimNK cells and, despite the total stability of NK cytotoxicity, the “per-cell”
basis cytotoxicity is impaired (Solana & Mariani 2000; Mocchegiani et al. 2009; Borrego et al. 1999). On the other hand, the number of CD56brightNK cells within the peripheral blood declines
with aging, impairing the communication with the adaptive immune system (Chidrawar et al. 2006). Aging is also associated with the reduction of cytokines and chemokines production (CCL5, MIP1α, IL-8, INF-γ) upon NK cell activation (Mocchegiani et al. 2009).
ADAPTIVE IMMUNITY
One of the main functions of the innate immune system is the activation of the adaptive immunity, which is composed by highly specialized cells and processes that, for example, eliminate or prevent pathogen growth in a pathogen-antigen-specific manner. This protection is mediated by B- and T-lymphocytes following the exposure to specific antigen and is also characterized by immunologic memory. The senescence of adaptive immune system is reflected in the alteration of cell compartments, mainly on T cell subsets (Fulop et al. 2011).
T cells are responsible for cell-mediated immunity through the recognition of a specific antigen by the TCR in the context of MHC molecules. Their precursors are produced in the bone marrow but only fully differentiate in the thymus, where they acquire distinct phenotypes: expression of the co-receptor CD4, becoming helper T-lymphocytes (Th cells), or expression of
8
the CD8 co-receptor to be cytotoxic T-lymphocytes (Tc cells). The T cell population can be divided in several subsets based on their phenotype, which is characterized by the expression of cell surface receptors, such as, CD45RA and CD45RO (receptors involved in T cell activation), CCR7 (lymph node homing receptor), CD27 and CD28 (co-stimulation receptors) (Okada et al. 2008; Appay et al. 2008). The cells that compose the T cell compartments are: 1) naive T cells (CD45RA+CD45RO-CCR7+), that have not yet contacted with their cognate antigen; 2) central
memory (CM) T cells (CD45RA-CD45RO+CCR7+), previously activated but with the capacity to be
maintained in the absence of antigenic stimulation and have the ability to expand rapidly upon secondary challenge; 3) effector memory (EM) T cells (CD45RA-CD45RO+CCR7-) are the ones
found in sites of active antigenic stimulation; and 4) late differentiated (LD) T cells, characterized by the re-expression of CD45RA lacking the expression of CCR7, are considered end-stage differentiated effectors with a major representation in CD8+ T cell subset (Appay et al. 2008;
Okada et al. 2008; Saule et al. 2006). The expression of CD28, a co-stimulatory signal, is also used to distinguish different subsets within the ones that were referred above. Moreover, the loss of CD28 expression is also considered one of the most consistent immunological markers of aging (Saule et al. 2006; Gupta et al. 2004).
Although peripheral T cell numbers do not diminish with age, one of the most described changes during immunosenescence is the proportion of T cells compartments and the CD4/CD8 ratio alterations (Hakim et al. 2004; Macaulay et al. 2013). Older individuals present a reduction of naive T cells (most probably associated with reduced thymus output) and an accumulation of memory T cells, which also impacts on cytokine production (Hakim et al. 2004). The memory T cells increase in the CD4+ subsets is mainly caused by a raise on the CM and EM cells and in the
CD8+ subsets by EM and LD cells (Saule et al. 2006). Reduced thymic activity and the expansion
of peripheral T cell leads to a reduced diversity of the TCR repertoire (Hakim et al. 2004; Goronzy & Weyand 2005).
An increased number and proportion of regulatory CD4+T cells (Tregs) has been also
shown as an characteristic of aging (Orsini et al. 2012; Gregg et al. 2005; Lefebvre & Haynes 2012). However, these results are not so clear since other studies showed no differences in the frequency of this cell population between young and older individuals (Hwang et al. 2009; Santner-Nanan et al. 2008). Tregs function as immunomodulators through the production of cytokines such as IL-10 and TGF-β, and maintain immune cell tolerance by inhibiting several cells such as T cells, NK cells and DC. The increased frequency of these cells has been
9
suggested to contribute to the impaired immunity observed at advanced age, possibly because there is also loss or impairment of their main functions (Fulop et al. 2011; Lefebvre & Haynes 2012; Hwang et al. 2009).
B cells are generated in the bone marrow and produce antibodies (also known as immunoglobulins) upon stimulation in a T cell-dependent or independent manner, making them vital for the humoral immunity. The main functions of B cells are the production of immunoglobulins against specific antigens, function as APCs and develop into memory cells after activation. B cells were also described as having important regulatory functions (Ongrádi & Kövesdi 2011). During aging, the overall number of B cells seems to be stable or decrease moderately (Ongrádi & Kövesdi 2011; Colonna-Romano et al. 2003), and the main alterations observed are in the cell compartments. An accumulation of memory B cells, a decreased in T-independent antibodies production by B cells (while T-dependent antibodies production do not change significantly) and loss of naive B cells has been suggested as hallmarks of immunosenescence (Colonna-Romano et al. 2003; Colonna-Romano et al. 2008). B cell functional alterations are also observed in aged individuals, such as antibody diversity and production (Frasca et al. 2005). The antibodies produced by lifelong B cells are commonly of low affinity (Larbi et al. 2008; Ongrádi & Kövesdi 2011) and it is also observed an increased production of immunoglobulin from specific classes, like IgG and IgA, and reduction or no alterations on proportion of others, such as IgM and IgD (Ongrádi & Kövesdi 2011; Paganelli et al. 1992).
All the alterations of the immune system have an impact on immune response mediators that are produced by these cells, such as cytokines and chemokines. In fact, due to the functional alterations of the immune system that commonly occurs with aging, older individuals present 2-4 fold increases in plasma/serum levels of pro-inflammatory mediators, such as cytokines and acute phase proteins, but far from the increases observed during acute infections (Krabbe et al. 2004). This chronic-low grade inflammation observed in elderly is also called as “inflammaging”. Most studies focused on IL-6 and showed increased levels of this cytokine, as well as tumor necrosis factor (TNF), with advancing age (Krabbe et al. 2004). Aging is also associated with increased levels of C-reactive protein (CRP) (Capuron et al. 2011).
10
1.3.
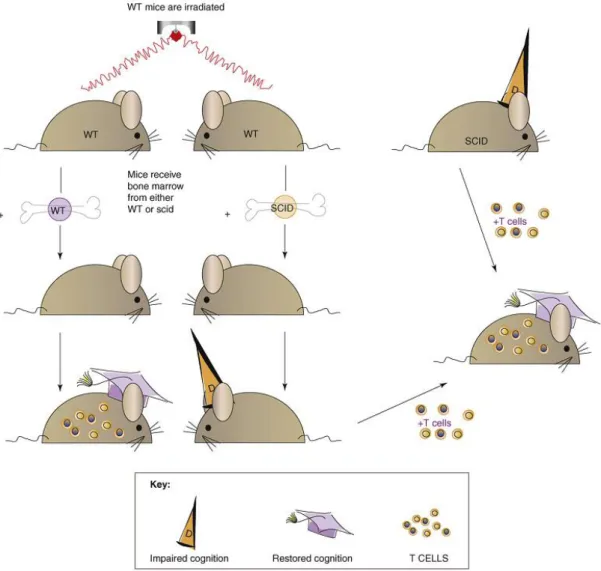
THE ROLE OF THE IMMUNE SYSTEM ON COGNITIVE FUNCTIONSIn the last decade, some researchers raised the notion that the immune system plays a general supportive role in brain function, including cognitive abilities and neurogenesis (Kipnis et al. 2008; Schwartz & Shechter 2010). These studies support the idea that, throughout life, the brain is not “immune privileged” but rather “enjoys the privilege” of immune-dependent maintenance. Experimental evidences that support this theory, concerning cognitive functions, have been provided by animal models that lack peripheral immune cells. For instance, severe combined immune deficiency (SCID) mice, which are devoid of B and T cells, and nude mice, which are devoid of mature T cells, present a significant impairment in the hippocampal-dependent spatial learning and memory in several cognitive tasks (Kipnis et al. 2004; Ron-Harel et al. 2008; Brynskikh et al. 2008). These cognitive deficits can be reverted by replenishing the mouse with T cells (Kipnis et al. 2004; Ron-Harel et al. 2008; Brynskikh et al. 2008), but not with other immune cells (Brynskikh et al. 2008), meaning that T cells constitute the main immune cell population affecting cognitive behavior (Figure 2). Moreover, other studies demonstrated that not only a lifelong immune deficiency, which can affect brain development in young mice, but also the imposition of immune deficiency in adulthood is sufficient to cause cognitive deficits. These studies proved that irradiated wild-type mice after transplantation with SCID-bone marrow present spatial learning and memory loss (Brynskikh et al. 2008; Ron-Harel et al. 2008) (Figure 2), and also acute suppression of T cells using immunosuppressive drugs, currently used in clinical trials or in disease treatment, would yield similar phenotype of cognitive impairment (Derecki et al. 2010). Furthermore, CD4-depleted mice present a significantly impaired performance during the reversal learning of morris water maze (MWM) (Wolf et al. 2009), which leads to consider that the key players between adaptive immunity and cognitive functions are CD4+ T cells.
11
Figure 2. Immune system availability and cognitive function. Depletion of adaptive immunity from wild-type
mice by a split-dose irradiation, followed by injection of bone marrow from SCID mice impairs cognitive function, whereas replacement of bone marrow with that of autologous (wild type) WT mice does not. The cognitive decline observed as a result of acute depletion of the immune system and the cognitive decline associated with long-lasting immunodeficiency are both reversible by injection of T cells from wild-type donors (Kipnis et al. 2008).
Some authors argue that a better cognitive performance is associated with the presence of T cells that recognize central nervous system (CNS)-specific antigens. Transgenic mice possessing mainly T cells receptors specific to myelin based protein, a CNS antigen, perform better in MWM than their wild type controls while. In addition, transgenic mice for ovalbumin (an irrelevant non-specific antigen) specific T cell receptors, perform worse (Ziv et al. 2006). Moreover, cognitive impairment induced by neurotransmitter dysfunctions in animal models can also be reverted boosting T cell activation by vaccination, using copolymer-1, which is a random polymer of four amino acids enriched in myelin based protein (Kipnis et al. 2004). These findings
12
support the notion of a “protective autoimmunity” – T cells that recognize self and CNS-specific antigens are needed to maintain the proper brain function, such as cognition (Schwartz & Shechter 2010) – and that T cells present a pro-cognitive properties (Kipnis et al. 2012). Alterations in homeostasis, such as learning associated stress and brain activity, may release mediators (brain-derived molecular cues) into cerebrospinal fluid (CSF) or blood that function as a trigger for immune cells to assume a pro-cognitive phenotype (Kipnis et al. 2012).
In accordance with the data in animal models, individuals with a marked decrease in T cells also present deficits in cognitive functions. For instance, humans that are immunocompromised (acquired immunodeficiency syndrome patients and patients submitted to immunosuppressive chemotherapy treatment) present cognitive dysfunction, and when the levels of immune cells return to normal there is an improvement of the cognitive function (Kipnis et al. 2008; Cysique et al. 2009; Hess & Insel 2007). However, care should be taken in the interpretation of these results due to the potential confounding factors inherent to the health state of the individuals.
As previously shown, T cells apparently have an important role in the maintenance of cognitive functions, however, some aspects are far from being understood. The location and what are the mechanisms underlying T cell effect on cognitive function are two main issues that have been addressed in the last years but need to be further explored.
LOCALIZATION OF T CELLS THAT AFFECT COGNITIVE FUNCTIONS
It is known that no T cells are detectable, in healthy physiological conditions, in the parenchyma of naive or cognitive trained mice, but in areas immediately adjacent to the parenchyma (such as choroid plexus and subarachnoid meningeal spaces), which are highly enriched with blood vessels (Derecki et al. 2010). Additionally, it was recently reviewed that “protective autoimmunity” occurs through intracranial immune surveillance, and that brain homeostasis is maintained by a supportive immune response within the brain’s barriers (Ron-Harel et al. 2011; Schwartz & Shechter 2010). Supporting these concepts, it has been proved that peripheral immune modulation or the performance of cognitive tasks induces substantial immunological changes in the brain barriers, mainly on meninges. The elimination of T cells from the meningeal spaces through the inhibition of T cells migration into the CNS seems to induce cognitive deficits, similar to the ones observed after peripheral T cell depletion (Derecki et al. 2010), meaning that meninges need to be populated by T cells to ensure proper cognitive
13
abilities. However, it was not proved that the treatment with antibodies anti-very late antigen-4 (VLA-4), which was used to inhibit T cells migration into the CNS, did not induce also peripheral lymphopenia. Besides changing immune cell populations, adaptive immune modulation also affects the phenotype of meningeal cells. Depletion of T cells from the meningeal spaces skew meningeal myeloid cells toward pro-inflammatory phenotype (IL-12 and/or TNF) (Derecki et al. 2010), and the same phenotype was evident in SCID mice as well as IL-4 -/- animals. Moreover, after performance of a cognitive task (MWM-training) meninges presented increased numbers of activated CD4+ T cells (and not CD8) with an IL-4-production phenotype, whereas interferon
(IFN)-γ-producing T cells did not change substantially after cognitive training, conferring to IL-4-producing T cells a role in the balance/maintenance of meningeal homeostasis (Derecki et al. 2010).
Besides T cells, myeloid cells seem also to play a role in cognition but it is not known if the effect is (in)dependent of T cells. A recent study demonstrated that the induction of an “alternatively” activated M2 phenotype (an anti-inflammatory phenotype characterized by the production of IL-10 and by the expression of CD206) of myeloid cells, achieved by skewing them in vitro with IL-4, and their subsequent intravenously injection into mice devoid of T cells, results in the reverse of pro-inflammatory skew meningeal phenotype and improved learning and memory (Derecki et al. 2011). These results suggest that M2 cells could contribute to a T cell-independent manner to improve cognitive functions associated with T cells malfunctions, being a possible therapeutic target.
MECHANISMS UNDERLYING THE EFFECT OF IMMUNE CELLS ON COGNITIVE FUNCTIONS Hippocampal neurogenesis, which is maintained throughout adult life, has been defined as a prerequisite for certain aspects of brain cognitive activity (Leuner et al. 2006). Moreover, immune cells, besides being associated with cognitive functions (spatial learning abilities), also contribute to the maintenance of neurogenesis (Ziv & Schwartz 2008; Ziv et al. 2006). Hippocampal neurogenesis in immune-deficient mice is markedly impaired and cannot be enhanced by environment enrichment, which normally increases hippocampal neurogenesis (Ziv et al. 2006). Ziv and colleagues, showed that neurogenesis is dependent on T cells, namely T cells that recognize CNS antigens (in this case cells that recognize myelin based protein) (Ziv et al. 2006). Furthermore, CD4+ T cells, besides being key players on cognitive behavior, also affect
14
lymphocytes or B cells, lead to a reduction in hippocampal neurogenesis, and the repopulation with CD4+ T cells, but not with CD8+ T cells, increase hippocampal neurogenesis in mice devoid of
lymphocytes (Wolf et al. 2009). These results prompted us to consider that CD4+ T cells provide
a neuroimmunological link in the control of adult hippocampal neurogenesis and consequently on cognitive function.
Other possible mechanism by which the immune system maintains brain plasticity, such as cognitive activity, is through regulation of brain-derived neurotrophic factor (BDNF) expression (Yirmiya & Goshen 2011). BDNF is an important molecule for hippocampal-dependent learning and memory and also adult hippocampal neurogenesis (Heldt et al. 2007; Donovan et al. 2008; Ron-Harel & Schwartz 2009). T cells that recognize CNS-specific antigens and CD4+ T
cells are able to increase BDNF expression in the brain parenchyma (Wolf et al. 2009; Ziv et al. 2006). Astrocytes cultures treated with IL-4, an immunomodulatory cytokine, also present increased levels of BDNF expression, whereas the culture with pro-inflammatory cytokines leads to a reduced expression (Derecki et al. 2010). Possibly T cell could affect levels of parenchymal BDNF expression through the regulation of meningeal cytokines.
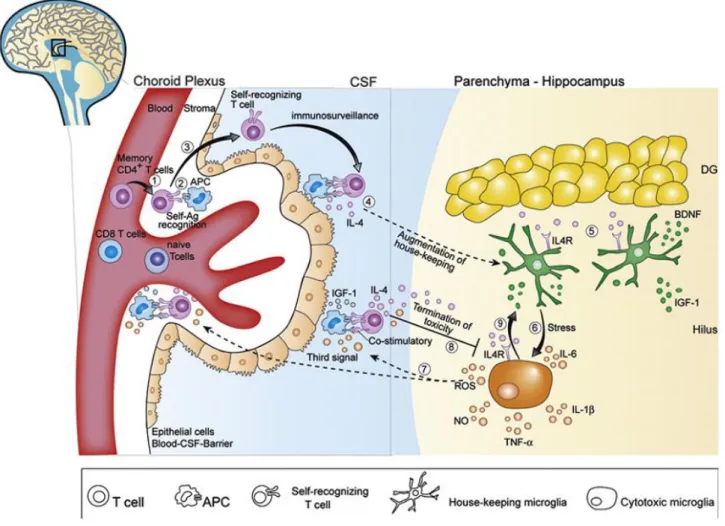
Also considering aspects along the same line as the ones here discussed, Schwartz and Shechter (2010) proposed a model that aims to explain the link between “protective autoimmunity” and “CNS immunesurveilance”, and how it can affect, for instance, cognitive functions (Figure 3). In the model, memory CD4+T cells that recognize their cognate antigen
presented at the barriers of the CNS, namely the choroid plexus, are allowed to enter in the CSF but not in the brain parenchyma. Their model further suggests that these lymphocytes are probably skewed toward an immunomodulatory phenotype, characterized by the production of IL-4 and growth/survival factors. Even though leukocytes cannot reach brain parenchyma, their derived molecules produced in the barriers or in the CSF can affect parenchyma cellular and molecular mechanisms, such as modulation of local expression of BDNF and neurogenesis (Schwartz & Shechter 2010). These alterations may be reflected by altered cognitive functions.
15
Figure 3. CNS immunosurveillance by self-specific T lymphocytes is neuroprotective. Memory T cells enter
the cerebrospinal fluid (CSF) by transmigration from blood vessels into the stroma of the choroid plexus (CP) (1). CD4+
memory T cells are primed in the CP by antigen-presenting cells (APCs) presenting CNS-self-antigen (Ag) (2). On recognition of Ag, T lymphocytes cross the epithelial blood-CSF-barriers (BCSFB) into the CSF (3). Activated self-recognizing T lymphocytes patrol the SAS, in which the CSF circulates, in a process termed as immunosurveillance (4). Under physiological conditions, no infiltration to the CNS parenchyma occurs. IL-4 reaches the parenchyma through the CSF circulation, and induces secretion of neuroprotective substances (i.e. BDNF and IGF-1) by local microglia (5). Exposure to acute psychological stress induces a pro-inflammatory phenotype in resident microglia, characterized by secretion of reactive oxygen species (ROS), nitric oxide (NO), and increased levels of proinflammatory cytokines (i.e. IL-1β, TNF-α and IL-6) (6). Their model suggests that ROS exit the parenchyma to the CSF and serve as the ‘‘third signal’’ which facilitate T cell activation despite low antigen presentation (7). This stimulation occurs either by acting directly on T cells or by priming the APCs. T cells activated in response to increased toxicity are expected to secrete increased levels of IL-4, which then penetrates the parenchyma, and binds to IL4R on the cytotoxic microglia (8). Exposure of cytotoxic microglia to IL-4 causes downregulation of proinflammatory factor secretion, and induces expression of neuroprotective factors (BDNF, IGF-1), which support restoration of homeostasis (9) (adapted from (Schwartz & Shechter 2010; Ron-Harel et al. 2011)
16
RELATION BETWEEN AGE-RELATED COGNITIVE DEFICITS AND IMMUNITY
Functional features of brain aging are caused by cells becoming less able to respond to stress, neurons impaired ability to adapt to and rebound from potentially damaging alterations from the local environment and the endocrine milieu (Stranahan & Mattson 2012): that is, in others words, a deviation from the homeostasis. On this, recently, age related brain impairment has been attributed, at least in part, to the immune system aging (Ron-Harel & Schwartz 2009). Possibly, due to all the age-related peripheral immune alterations, aging results in a defective CNS immunesurveillance leading to a reduced ability to cope and restore brain homeostasis (Schwartz & Shechter 2010). Ron-Harel and colleagues suggested that age-related spatial memory loss could be reverted by boosting T-cell activation through homeostatic-driven proliferation. Once more, they aimed to demonstrate that age-attenuated immune response could be correlated with spatial and memory loss in old mice (Ron-Harel et al. 2008).
As mentioned, several studies suggest that neurogenesis is dependent on T cells, and along with the fact that in elderly there is a decrease in hippocampal neurogenesis (Galvan & Jin 2007), it was proposed that the reduced neurogenesis associated with aging might be an outcome of, among others factors, reduced immune based maintenance or an overpowering local inflammation in elderly (Ron-Harel & Schwartz 2009). Actually, the low-grade inflammation observed in elderly has been associated with their cognitive decline (Hakim et al. 2004; Fulop et al. 2011; Trollor et al. 2010; Dimopoulos et al. 2006). Furthermore, blood-borne factors characteristics of and old systemic environment are able to impair spatial learning and memory and also neurogenesis in young mice (Villeda et al. 2011). Villeda and colleagues demonstrated that using heterochronic parabiosis (old and young mice sharing circulatory system), blood-borne factors present in the systemic milieu promote adult neurogenesis in old mice and inhibit in young (Villeda et al. 2011). It was also shown that the exposition of a young mouse to plasma from an old mice decreased synaptic plasticity and spatial learning and memory. The impairment in cognition seemed to be caused by increased levels of CCL11 and, in fact, young mice injected with CCL11 present decreased adult neurogenesis and impaired learning and memory (Villeda et al. 2011). Interestingly, plasma and CSF levels of CCL11 in older individuals are also increased when compared with young individuals (Villeda et al. 2011).
17
Altogether these facts indicate that the decline in cognitive functions observed during aging can be in part attributed to changes on peripheral immune system, such as alterations on immune cells or circulatory signaling immune molecules.
19
21
The central hypothesis of this work is that distinct immunosenescence profiles might directly (cor)relate with differential cognitive abilities in older individuals. This project is relevant since it leads to the identification of an “immunological phenotype” correlated with patterns of cognitive aging, contributing to the increased knowledge concerning the factors associated with age-related cognitive decline.
Specifically, in a cohort of aged individuals with distinct cognitive performances we aimed to:
1. Analyze the immune cell populations from the adaptive immune system, focusing on T cells compartments and regulatory T cells, by flow cytometry.
2. Correlate the immune cell phenotype with the distinct cognitive performances and domains that were already evaluated in the same cohort.
23
25
3.1. PARTICIPANTS CHARACTERIZATION
The 119 participants enrolled in this project were recruited from a cohort (n=1051 individuals), clinically and cognitively characterized, originated in the context of the SWITCHBOX project (Santos et al., 2012). The participants from the initial cohort are older community-dwelling individuals living in the Minho Region of Portugal and are representative of the country’s population in terms of age, gender and formal education level. Participants with incapacity and/or inability to attend the clinical and neuropsychological sessions, who were diagnosed with dementia and/or inability to understand informed concept, with disorders of the central nervous system as well as overt thyroid pathology and infectious diseases were excluded.
The cohort was established in accordance with the principles expressed in the Declaration of Helsinki and the work approved by the national ethical committee (Comissão Nacional de Protecção de Dados) and by local ethics review boards. All the participants gave voluntary informed signed consent.
A team of trained psychologists assessed the cognitive and mood profile of the participants. Briefly, cognitive profile were established using a battery of neurocognitive and psychological tests selected to evaluate short-term verbal memory, verbal working memory, response inhibition/cognitive flexibility, verbal fluency, multiple trial verbal learning and memory, high level information processing speed, global cognitive status and mood. Using a principle component analysis the neurocognitive/psychological test variables were grouped in 3 dimensions: memory (MEM; composite dimension), general cognition and executive function (EXEC; composite dimension) and mood (GDS; single parameter). The values of each dimension were calculated based on the weight of each test and were transformed in zscores. All the statistical analysis of the cognitive evaluation followed the reported by Santos et al. (2012). From cluster analysis, individuals were divided into 4 groups (C1 to C4) taking into account their cognitive performance and mood state: C1 group members presenting the better cognitive performance whereas C4 the worst (C1>C2>C3>C4), and C1 and C3 presenting the better mood state whereas C2 and C4 a lowered (more depressed) mood state.
For this study participants from both “good” (C1+C2) and “poor” (C3+C4) cognitive groups were recruited. The study enrolled 119 participants (56 or 47% were women), 64 from the good cognitive performance groups and 55 from the poor cognitive performance groups. Descriptive information in terms of age and gender of the total participants and of the good and poor cognitive performance groups is indicated on Table 1.
26
Total Good Poor
Age Mean 65.86 64.27 67.71 SD 8.40 8.30 8.21 [51-60] 39 26 13 [61-70] 45 22 23 [71-80] 31 15 16 [81-87] 4 1 3 Gender Males 63 37 26 Females 56 27 29 Total 119 64 55 SD= Standard Deviation
Table 1. Sample characterization in terms of age and gender.
3.2. FLOW CYTOMETRY ANALYSIS
Blood was collected to EDTA-blood collection tubes and processed for multiparametric flow cytometry analysis on the day of collection. Blood samples collected in the same day were also sent for Hospital de Braga’s Laboratories to perform a leukogram.
TCELL COMPARTMENTS CHARACTERIZATION
One-hundred μL of whole blood was incubated for 15 min, at room temperature, with the following combination of monoclonal antibodies: V500-conjugated α-CD3 (clone UCHT1; from BD Biosciences, San Jose, CA, USA), APC-Cy7-conjugated α-CD4 (clone RPA-T4), Pacific Blue-conjugated α-CD8 (clone RPA-T8), FITC-Blue-conjugated α-CD45RA (clone HI100), PerCP-Cy5.5-conjugated α-CD45RO (clone UCHL1), Alexa Fluor 647-PerCP-Cy5.5-conjugated α-CD197/CCR7 (clone TG8/CCR7, all purchased from Biolegend, San Diego, CA, USA). Afterwards, erythrocytes were lysed upon incubation for 15 min, at room temperature, in FACS Lysis Buffer (BD Biosciences, San Jose, CA, USA) and washed on FACS buffer (3% BSA in PBS, 0.01 % Azida).
Lymphocytes were defined by low side scatter and low forward scatter, and within this population, the compartments of CD4+
T cells (CD3+CD4+) and CD8+ T cells (CD3+CD8+) were defined as naïve (CD45RA+CD45RO-CCR7+), CM (CD45RA-CD45RO+CCR7+), EM (CD45RA
-CD45RO+CCR7-) and LD (CD45RA+CD45RO-CCR7-). Analysis´s strategy is presented in Annexes
27
TREGS CHARACTERIZATION
Peripheral blood mononuclear cells (PBMCs) were obtained by gradient centrifugation using Histopaque 1077 (Sigma-Aldrich, St. Louis, MO, USA) for 30 min, at room temperature, according to the manufacturer's instructions. Cells were collected, washed twice with sterile PBS and counted using trypan blue exclusion dye. One million and a half of fresh PBMCs were cell surface stained upon incubation for 15 min, at room temperature, with V500-conjugated α-CD3 (clone UCHT1; from BD Biosciences, San Jose, CA, USA), APC-Cy7-conjugated α-CD4 (clone RPA-T4), FITC-conjugated α-CD45RA (clone HI100), PE-Cy7-conjugated α-CD127 (clone A019D5), Brilliant Violet 421-conjugated α-CD25 (clone BC96; all purchased from Biolegend, San Diego, CA, USA). Afterwards, PBMCs were washed with FACS buffer, fixed and permeabilized using Foxp3 permeabilization buffer for 30 min at 4°C (from eBioscience, San Diego, CA, USA) and stained with PE-conjugated α-FOXP3 (clone PCH101, eBioscience, San Diego, CA, USA) for 30 min at 4°C. At the end, samples were washed twice with eFluor NC flow cytometry staining buffer (from eBioscience, San Diego, CA, USA).
Regulatory T cells were defined within lymphocytes (low side and forward scatter) as CD3+CD4+CD127lowCD25+Foxp3+. The analysis strategy is presented in the Annexes (Figure 2).
FLOW CYTOMETRY DATA ANALYSIS
All samples were acquired on a BD LSR II flow cytometer using FACS DIVA software and data were analyzed using FlowJo Software (Tree Star, OR, USA).
3.3. STATISTICAL ANALYSIS
This study aimed to identify any adaptive immune system profile correlated with distinct cognitive performances in a senior population. To achieve the objective the following analysis were performed. Cell counts were accessed multiplying the percentage of each population among total cells by the leukocyte counts performed in the Hospital de Braga’s Laboratories. MEM, EXEC and GDS are present in zscores that were previously calculated based on the initial cohort by (Santos et al. 2012; unpublished data). To evaluate normal distribution of the variables, skewness and kurtosis values were calculated and approximate normal distribution was defined for variables with absolute values of skewness below 3 and kurtosis below 8 (Kline 2005). Levene's Test was used to evaluate equality of variances.
28
To compare adaptive immune cell populations (cell counts and percentages) between good and poor cognitive performance groups (descriptive statistics of variables are presented in Annexes Table 1-3) an independent-sample t-Test was performed for variables with normal distribution and a Mann-Whitney U Test for variables with non-normal distribution. Significance was considered for p-values below 0.05 and to quantify the strength of the differences Cohen´s d was calculated as a measure of effect size (0.2 is considered a small effect size, 0.5 a medium effect size and 0.8 a large effect size)(Kotrlik & Williams 2003).
To correlate adaptive immune cell populations (cell counts and percentages) with cognitive (MEM and EXEC) dimensions and mood (GDS) state a Pearson´s Correlation Coefficients Test was performed for variables with normal distribution and a Spearman´s Rank Correlation Coefficient Test for variables with non-normal distribution. The coefficient of determination (R2) was calculated as a measure of effect size (0.0196 is considered a small
effect size, 0.1300 is a medium effect size and 0.2600 a large effect size)(Kotrlik & Williams 2003).
Multiple linear logistic regression analysis was performed to identify if relevant adaptive immune cell populations (cell counts or percentages) could predict MEM, EXEC or GDS dimensions (dependent variables), controlling for gender and age (considering these two variables as independent variables together with immune cell populations). The variables included in the models as predictors were the ones that presented statistical significant correlations with MEM, EXEC or GDS. Variables with non-normal distribution and with Tolerance values below 0.4 (to avoid multicollinearity between variables) were excluded from the model.
The statistical procedures were performed in IBM SPSS Version 20 (IBM Corp, Armonk, NY, USA) and graph’s representation using GraphPad Prism version 6 (GraphPad Software, La Jolla California, USA).
29
31
4.1 . CHARACTERIZATION OF LEUKOCYTE PROFILE
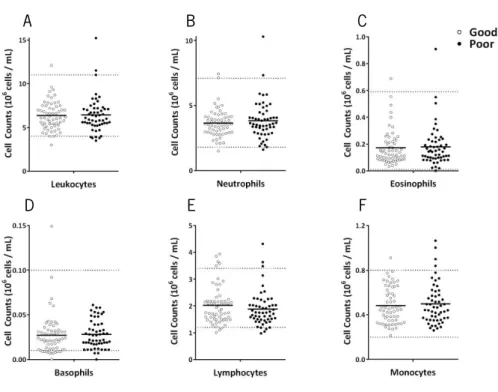
To characterize the white blood cells profile of the study participants, blood samples were collected, in the same day as the ones used to perform cytometry analysis, to assess counts of leukocytes (neutrophils, eosinophils, basophils, lymphocytes and monocytes). The vast majority of the participants present cell counts within normal range (Figure 4). No one was excluded from the analysis, even if presenting values outside the normal range in one of the cell populations.
Comparing good and poor cognitive performers, no statistical significant differences are found in the number of the general immune cell populations (leukocytes, t(112)=-0.207, p=0.836;
neutrophils, t(112)=-0.718, p=0.474; eosinophils, U(112)=1592, Z=-0.159, p=0.876; basophils,
U(112)=1458, Z=-0.920, p=0.358; lymphocytes, t(112)=0.949, p=0.345; monocytes, t(112)=-0.461,
p=0.646).
Figure 4. Distinct cognitive performers do not present differences in most general immune cell population counts. The large majority of the participants present leukocytes (A), neutrophils (B), eosinophils (C),
basophils (D), lymphocyte (E) and monocyte (F) counts within normal values (represented by horizontal dashed lines). No differences are observed between good (white) and poor (black) cognitive performers. Each dot represents one individual and the line the mean of the group.
A B C
32
4.2. ADAPTIVE IMMUNE CELL PROFILE: DIFFERENCES BETWEEN DISTINCT COGNITIVE PERFORMERS
Even though the distinct cognitive performers do not present differences in the lymphocyte counts, some cell types of the adaptive immune system have been shown to play a crucial role in cognitive function (Brynskikh et al. 2008; Derecki et al. 2010; Kipnis et al. 2004; Kipnis et al. 2012; Wolf et al. 2009; Ziv et al. 2006; Ziv & Schwartz 2008). Several studies, mainly in animal models, showed that a disruption of the homeostasis of the immune system impacts on the cognitive performance and the absence of T cells (namely CD4+) has been associated with
cognitive impairment (Wolf et al. 2009; Ron-Harel et al. 2008; Kipnis et al. 2004; Brynskikh et al. 2008).
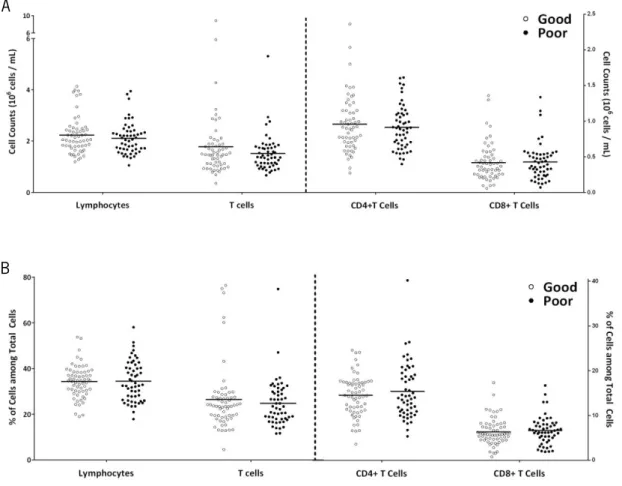
To identify whether lymphocytes and T cell profiles were associated with cognitive performance, cell counts and percentages were compared between good and poor cognitive performers (Figure 5).
Figure 5. Distinct cognitive performers do not present differences in lymphocytes and T cell counts and percentages. No differences are observed between good (white) and poor (black) cognitive performers in
lymphocytes, T cells, CD4+ T cells and CD8+ T cells counts (A), as well as in the percentages of these populations
among total cells (B). Each dot represents one individual and the line the mean of the group.
A
33
No statistical significant differences are observed between good and poor cognitive performers in lymphocytes and T cells counts (lymphocytes, t(110)=0.885, p=0.378; T cells,
U(110)=1430, Z=-0.778, p=0.437) or percentages of cells among total cells (will be here onward
referred as percentage of cells) (lymphocytes, t(101.1)=-0.088, p=0.930; T cells, U(115)=1684.5,
Z=-0.090, p=0.928) and also in CD4+ and CD8+ T cells (counts: CD4+ T cells, t
(110)=0.617, p=0.539;
CD8+ T cells, t
(110)=-0.196, p=0.845; percentage of cells: CD4+ T cells, t(95.6)=-0.842, p=0.402; CD8+
T cells, t(115)=-0.533, p=0.595).
One of the major alterations of the adaptive immune system that occurs with aging is the alteration of T cell compartments (Saule et al. 2006). Aiming to understand if any association with cognitive performance was presented, the different cell compartments among CD4+ (Figure
6) and CD8+ T cells (Figure 7) were analyzed between good and poor cognitive performers.
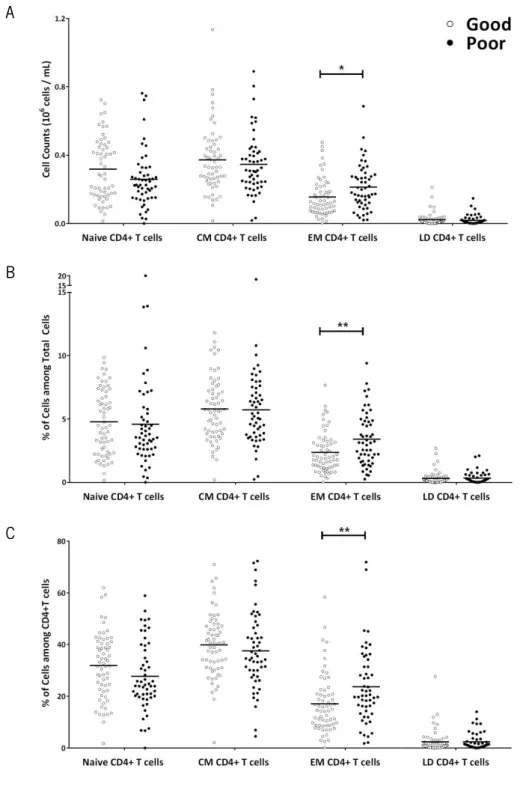
Among the CD4+ T cells (Figure 6), the most represented compartment is the CM
(M=38.84, SD=13.51), followed by naive (M=29.96, SD=13.03) and EM (M=20.12, SD=13.31); the least represented and almost inexistent is LD (M=2.38, SD=3.82). In comparison to the good performers, the poor cognitive performers present statistically significant higher levels of EM CD4+ T cells. The differences are observed either in cell counts (t
(110)=-2.51, p=0.014, d=0.48), in
percentages of cells (t(98.29)=-3.02, p=0.003, d=0.61) or in percentage of cells among CD4+ T Cells
(t(115)=-2.79, p=0.006, d=0.52). No differences are identified in other cell compartments (cell
counts: naive, t(109.9)=1.770, p=0.080; CM, t(110)=0.780, p=0.480; LD, U(110)=1545, Z=-0.108,
p=0.919; percentage of cells: naive, t(115)=0.335, p=0.739; CM, t(115)=0.120, p=0.905; LD,
U(115)=1545, Z=-0.853, p=0.394; percentage of cells among CD4+ T Cells: naive t
(115)=1.713,
p=0.089; CM, t(115)=0.907, p=0.366; LD, t(115)=0.006, p=0.995).
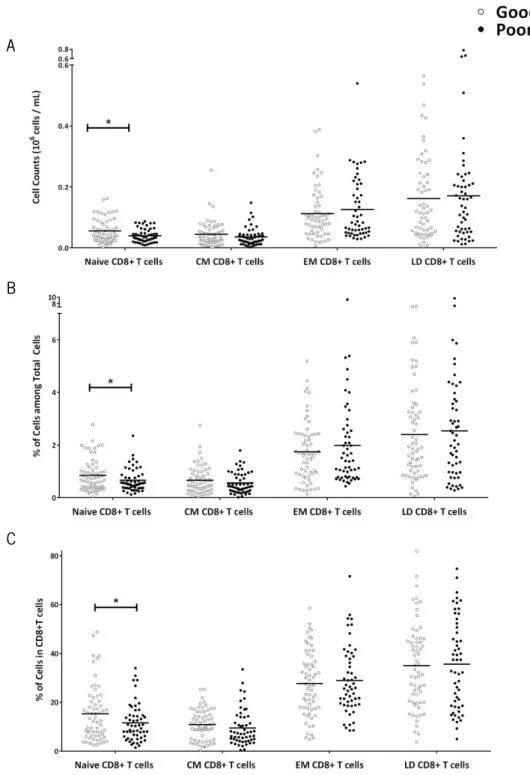
Among the CD8+ T cells (Figure 7), the compartment most represented is the LD
(M=35.29, SD=17.72), followed by EM (M=28.30, SD=13.51) and the two compartments least represented are naive (M=13.60, SD=9.92) and CM (M=10.25, SD=6.67). In comparison to the good performers, poor cognitive performers present statistically significant lower levels of naive CD8+ T cells. The differences are observed either in cell counts (t
(93.75)=2.60, p=0.011, d=0.54), in
percentages of cells (t(111.04)=1.98, p=0.05, d=0.38) and in percentage of cells among CD8+ T Cells
(t(109.97)=2.06, p=0.042, d=0.39). No differences are identified in other cell compartments (cell
counts: CM, U(110)=1375, Z=-1.096, p=0.273; EM, t(110)=-0.774, p=0.440; LD, t(110)=-0.332,
34
Figure 6. Poor Cognitive performers present higher levels of EM CD4+ T cells. Poor cognitive performers
(black) present statistically significant more EM CD4+ T cells than good performers (white), and no differences are
observed in other cell compartments of CD4+ T cells (naive, CM and LD cells) (A). The same differences are observed
regarding percentages of cells among total cells (B), as well as percentages of the different cell compartments among CD4+ T cells (C). Each dot represents one individual and the line the mean of the group (*p<0.05; **p<0.01).
A
B
35
Figure 7. Poor Cognitive performers present lower levels of Naive CD8+ T cells. Poor cognitive
performers (black) present statistical significant less naive CD8+ T cells than good performers (white), and no
differences are observed in other cell compartments of CD8+ T cells (CM, EM and LD cells) (A). The same differences
are observed regarding percentages of cells among total cells (B), as well as percentages of the different cell compartments among CD8+ T cells (C). Each dot represents one individual and the line the mean of the group
(*p<0.05).
A
B
36
0.396, p=0.693; percentage of cells among CD8+ T cells: CM, t
(115)=1.047, p=0.297; EM, t(115)
=-0.482, p=0.630; LD, t(115)=-0.193, p=0.847).
CD4+ T cells are characterized by the presence of several cell subsets (such as Th1, Th2,
Th9, Th17, follicular helper T cells (Tfh), regulatory type 1 cells (Tr1) and Treg) with different differentiation processes and functions (Luckheeram et al. 2012). Tregs are an extremely important population due to its function on the control of autoimmunity and immune responses (Sakaguchi et al. 2008; Fulop et al. 2011; Lefebvre & Haynes 2012). Moreover, some reports suggest that this cell type increase with age (Orsini et al. 2012; Gregg et al. 2005; Lefebvre & Haynes 2012). Since Tregs need to be maintained in the right proportion in respect to other type of cells, particularly other CD4+ T cell populations, a Treg increased has been suggested to
contribute to the impaired immunity observed in aged individuals (Fulop et al. 2011; Lefebvre & Haynes 2012). Even though there are no studies addressing the impact of Tregs on cognitive performance, interestingly, studies using mice with self-reactive T cells (CNS-specific T cells) indicate that these have a better cognitive performance when compared with mice possessing mainly T cells directed to ovalbumin (Ziv et al. 2006).
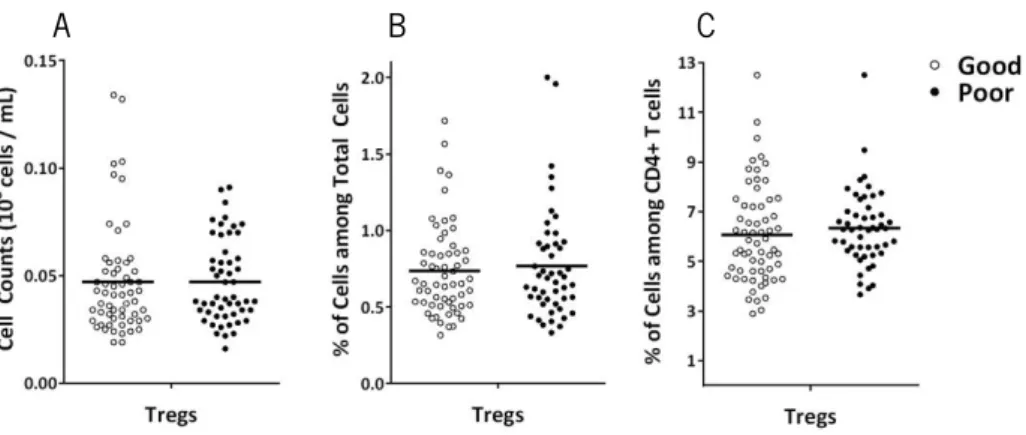
Comparing the Tregs between the good and poor cognitive performers (Figure 8), no differences are observed in counts (t(106)=0.046, p=0.963), neither in percentages of cells (t(106)
=-0.507, p=0.613) nor in percentages of cells among CD4+ T Cells ( t
(111.0)=-0.836, p=0.405).
Figure 8. Distinct cognitive performers do not present differences in Tregs. No statistical differences are
observed between good (white) and poor (black) cognitive performers in Tregs counts (A), Tregs percentages among total cells (B) and Tregs percentages among CD4+ T cells (C). Each dot represents one individual and the line the
mean of the group.
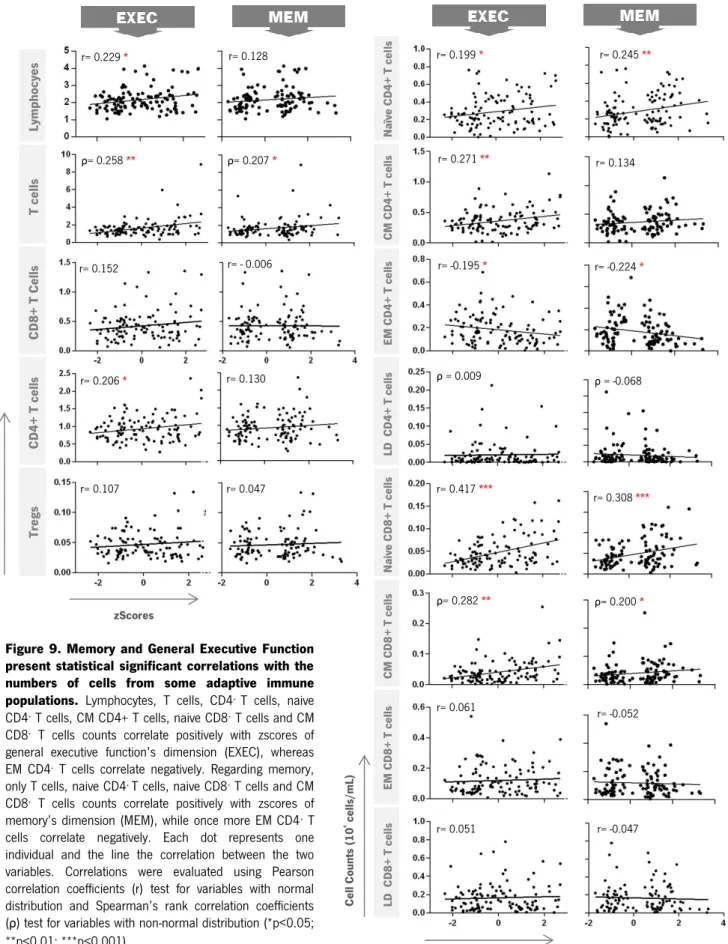
37 Tr egs CD 4+ T c el ls CD8 + T C el ls T ce lls L ymph oc ye s LD CD 8+ T c el ls E M C D8 + T ce lls C M C D8 + T ce lls Na iv e CD8+ T c el ls L D C D4 + T ce lls EM CD4 + T ce lls C M CD 4+ T c el ls Na ïv e CD 4+ T c el ls Ce ll Co unt s (10 6 c el ls /mL ) zScores r= 0.229 * ρ= 0.258 ** r= 0.152 r= 0.206 * r= 0.107 r= 0.047 r= 0.130 r= - 0.006 ρ= 0.207 * r= 0.128 r= 0.199 * r= 0.271 ** r= 0.245 ** r= 0.134 r= -0.195 * r= -0.224 * ρ = 0.009 ρ = -0.068 r= 0.417 *** r= 0.308 *** ρ= 0.282 ** ρ= 0.200 * r= 0.061 r= -0.052 r= 0.051 r= -0.047 Ce ll Co unt s (10 6 c el ls /mL ) zScores
4.3. CORRELATIONS OF THE ADAPTIVE IMMUNE CELL POPULATIONS WITH MEMORY AND GENERAL EXECUTIVE FUNCTION
Figure 9. Memory and General Executive Function present statistical significant correlations with the numbers of cells from some adaptive immune populations. Lymphocytes, T cells, CD4+ T cells, naive
CD4+ T cells, CM CD4+ T cells, naive CD8+ T cells and CM
CD8+ T cells counts correlate positively with zscores of
general executive function’s dimension (EXEC), whereas EM CD4+ T cells correlate negatively. Regarding memory,
only T cells, naive CD4+ T cells, naive CD8+ T cells and CM
CD8+ T cells counts correlate positively with zscores of
memory’s dimension (MEM), while once more EM CD4+ T
cells correlate negatively. Each dot represents one individual and the line the correlation between the two variables. Correlations were evaluated using Pearson correlation coefficients (r) test for variables with normal distribution and Spearman’s rank correlation coefficients (ρ) test for variables with non-normal distribution (*p<0.05; **p<0.01; ***p<0.001).