Pedro Miguel Peixoto da Silva
outubro de 2015
Analysis of an edible coating of chitosan
as an alternative to glazing of frozen salmon
Trabalho realizado sob a orientação do
Professor Doutor Engenheiro António Augusto
Martins de Oliveira Soares Vicente
e do
Engenheiro Nuno Miguel Ferreira Soares
Dissertação de Mestrado
Mestrado Integrado em Engenharia Biológica
Ramo de Tecnologia Química e Alimentar
unique. It is not easy, but if you accept your misfortune and handle it right, your perceived failure can become a catalyst for profound
re-invention. (…) Whether you fear it or not, disappointment will come. The beauty is that through disappointment you can gain clarity, and with clarity comes conviction and true originality.” Conan O’Brien
A todos que contribuíram para a realização deste trabalho, direta ou indiretamente, gostaria de expressar os meus sinceros agradecimentos.
Ao Professor António Vicente por me ter dado a oportunidade de participar neste projeto, pela ajuda e disponibilidade e pelo seu constante otimismo.
Ao Engenheiro Nuno Soares pela oportunidade de participar neste projeto, pelos ensinamentos, apoio e presença constante.
À empresa Vanibru, Comércio de produtos alimentares, Lda. por ter disponibilizado as instalações e os equipamentos necessários à realização do trabalho.
À Escola Superior de Tecnologia e Gestão, do Instituto Politécnico de Viana do Castelo, em particular à Unidade de Investigação, Desenvolvimento, Inovação em Ciência e Tecnologia Alimentar, pela cedência do seu painel sensorial, sem o qual teria sido impossível realizar este trabalho.
A todos os colegas, professores e funcionários do Centro de Engenharia Biológica que de uma forma ou de outra ofereceram as condições necessárias para a realização deste trabalho.
Gostaria de agradecer em especial ao Laboratório de Indústria e Processo, cuja paciência, companheirismo e ensinamentos foram absolutamente fundamentais para a conclusão deste estágio e trabalho.
vii
Análise de um revestimento edível de quitosano como alternativa para vidragem de salmão congelado
A natureza perecível do peixe, aliada ao aumento no seu consumo, tem levado à necessidade de melhoria das técnicas de preservação. A utilização de revestimentos de quitosano oferece vantagens em relação às técnicas tradicionais de conservação, no entanto existe a necessidade de avaliar o seu efeito nas propriedades sensoriais do salmão.
Neste trabalho as propriedades protetoras de uma solução de quitosano a 1.5 % foram estudadas e comparadas com as de amostras vidradas com água, e sem revestimento, sob stress térmico, com temperaturas a variar entre -15 ⁰C e -5 ⁰C, durante 70 dias; os parâmetros avaliados incluem os valores de pH, contagem de microrganismos a 30⁰ C, Azoto Volátil Total, assim como cor e perda de revestimento. O efeito da solução de quitosano nas propriedades sensoriais, de salmão Atlântico (Salmo salar) também foi estudado, recorrendo a um colorímetro, um texturómetro e um painel sensorial treinado ao longo de seis meses. Os resultados mostram que sob stress térmico as amostras revestidas com quitosano obtiveram valores semelhantes aos obtidos com as amostras vidradas com água no que diz respeito a cor, valores de pH e Azoto Volátil Total, ao passo que oferecem melhores resultados em valores de contagem de microrganismos a 30 ⁰C e de perda de revestimento, mostrando que o quitosano pode ser uma melhor opção protetora que a vidragem.
Realizou-se uma análise sensorial para estudar e comparar os efeitos dos diferentes revestimentos nas propriedades organoléticas de amostras de salmão e os resultados mostraram que não existiram diferenças significativas entre os diferentes revestimentos no que diz respeito à cor e à textura. A análise sensorial realizada por um painel treinado demonstrou que o quitosano é uma melhor escolha após seis meses de conservação em amostras congeladas, enquanto para amostras descongeladas e cozidas não se verificaram diferenças significativas entre amostras vidradas com água e revestidas com quitosano, sendo que ambas apresentaram melhores resultados do que amostras sem revestimento. Houve um particular cuidado em determinar se teria ocorrido difusão de sabor dos revestimentos para as amostras de salmão, tendo a análise estatística dos resultados do painel treinado mostrado que não existiu nenhuma relação entre o tipo de revestimento e o sabor da amostra, indiciando que nenhuma difusão de sabor ocorreu.
ix
Analysis of an edible coating of chitosan as an alternative to glazing of frozen salmon
The perishable nature of fish, coupled with an increase in fish consumption in recent years, has led to the improvement of fish preservation techniques. Chitosan coatings offer several advantages over more traditional freezing techniques, however there is a need to assess their effect on the sensory properties of salmon.
In this work the protective properties of a chitosan solution at 1.5 % (w/v) were studied and compared to those of uncoated and water glazed samples, under thermal stress conditions, with temperature varying between -15 ⁰C and -5 ⁰C, during 70 days. Assessed parameters included pH, Total Volatile Basic Nitrogen (TVB-N), Total Viable Count (TVC) values, as well as coating loss and color parameters. The effect of the chitosan solution on the sensory properties, especially flavor, of Atlantic salmon (Salmo salar) was also studied through the use of a colorimeter, a texturometer and a trained sensory panel over six months of storage.
Results show that under thermal stress conditions the chitosan coated samples presented similar values regarding color, pH and TVB-N values while offering better results in terms of TVC and coating loss values, proving chitosan a better protective option than water glazing.
Sensory analysis was conducted to study and compare the effects of different coatings, and the results show that no significant differences were found between different coatings regarding color and texture. Sensory analysis by a trained panel of judges demonstrated that chitosan was a better choice after six months in frozen samples, while in thawed and cooked samples no significant differences were present between chitosan coated and water glazed samples, while both were better than uncoated samples, after six months of storage. In particular flavor was assessed in order to determine if flavor diffusion from the chitosan coating had occurred, and statistical analysis of the results of the trained panel of judges showed no relation between coating type and sample flavor, indicating that no flavor diffusion had occurred.
xi Agradecimentos ... v Resumo ... vii Abstract ... ix List of Nomenclature ... xv List of Symbols ... xv
List of Figures ... xvii
Figures in Appendices ... xxi
List of Tables ... xxiii
Introduction ... 1
Part I – State of the Art ... 3
Chapter 1 . Fish ... 5
1.1. Fish Industry and consumption ... 5
1.1.1 Legislation ... 8
1.2. Post Mortem changes ... 8
1.2.1. Sensory changes ... 8
1.2.2. Microbiological changes ... 9
1.3. Preservation of fish ... 9
1.3.1. Freezing ... 9
1.3.2. Glazing ... 10
Chapter 2 . Fish Quality ... 13
2.1. Non-sensory methods ... 15
2.1.1. Microbiological methods ... 15
2.1.2. Chemical methods ... 15
2.1.3. Physical methods... 17
xii
2.2.2. Training of judges ... 24
Chapter 3 . Edible Packaging ... 27
3.1. Edible coatings and films ... 27
3.1.1. Chitin and Chitosan ... 30
Chapter 4 . Diffusion ... 41
4.1. Fickian Diffusion ... 42
4.2. Non-Fickian Diffusion ... 42
4.3. Diffusion in Polymers and gels ... 43
4.3.1. Diffusion in rubbery polymers ... 43
4.3.2. Diffusion in glassy polymers ... 44
4.4. Diffusion theories and physical models ... 44
4.4.1. Obstruction effects ... 44
4.4.2. Hydrodynamic theories ... 45
4.4.3. Free volume theory ... 46
4.4.4. Arrhenius’ theory ... 47
Part II – Experimental Work ... 49
Chapter 5 . Materials and Methods ... 51
5.1. Salmon Preparation ... 51
5.2. Preparation of coating ... 51
5.3. Preparation of the samples ... 51
5.3.1 Preparation of the samples with a chitosan coating ... 51
5.3.2 Preparation of the samples with water glazing ... 52
5.3.3 Preparation of the control samples ... 52
5.4. Storage and transport of the samples ... 52
xiii
5.5.3 Coating and glazing loss ... 53
5.5.4 Weight loss ... 54 5.5.5 Sensory analysis ... 54 5.5.6 Determination of TVC ... 55 5.5.7 Determination of TVB-N ... 57 5.5.8 Determination of color ... 58 5.5.9 Determination of texture ... 59 5.5.10 Determination of pH ... 61 5.6. Statistical analyses ... 61
Chapter 6 . Results and Discussion ... 63
6.1. Thermal stress samples analysis ... 63
6.1.1 Glazing and Coating uptake ... 63
6.1.2 Temperature profile ... 64 6.1.3 TVC ... 64 6.1.4 TVB-N ... 65 6.1.5 pH value ... 67 6.1.6 Color ... 68 6.1.7 Coating loss ... 71 6.1.8 Weight loss ... 73 6.1.9 Microscopic photos ... 74
6.2. General samples used in sensory analysis... 77
6.2.1 Percentage of glazing and coating uptake ... 77
6.2.2 TVC ... 78
xiv
6.3.1 Sensory analysis ... 80
6.3.2 Statistical analysis ... 81
6.4. Analysis of samples after thawing process ... 83
6.4.1 Sensory analysis ... 83
6.4.2 Statistical analysis ... 85
6.4.3 Texture ... 87
6.4.4 Color ... 92
6.5. Analysis of cooked samples ... 94
6.5.1 Sensory analysis ... 94
6.5.2 Statistical analysis ... 95
6.5.3 Texture ... 98
6.5.4 Color ... 103
Chapter 7 . Conclusions and Future Work ... 107
Bibliography ... 109
Appendixes ... 119
Appendix A – Sensory evaluation sheet for frozen salmon samples ... 119
Appendix B – Sensory evaluation sheet for thawed salmon samples ... 121
Appendix C – Sensory evaluation sheet for cooked salmon samples ... 123
Appendix D – Graphic representation of the color parameters L*, a* and b*, of the control, uncoated, water glazed, and chitosan coated samples for the thermal stress test ... 125
Appendix E – Graphic representation of the color parameters L*, a* and b*, of the water glazed and chitosan coated samples used in the sensory analysis ... 127
xv
Abbreviations
CSIRO - Commonwealth Scientific and Industrial Research Organization DD - Degree of Deacetylation
EC - European Comission
EEC - European Economic Community EU - European Union
FAO
-
Department of Food and Agriculture Organization of the United Nations FDA - Food and Drug AdministrationGRAS - Generally Recognized as Safe
MIC - Minimum Growth Inhibitory Concentration MRD - Maximum Recovery Diluent
Mw - Molecular Weight
OECD - Organisation for Economic Co-operation and Development Op+I - Olympus pro plus
PCA - Principal Component Analysis QDA - Quantitative Descriptive Analysis QI - Quality index
QIM - Quality Index Method
TFRU - Tasmanian Food Research Unit TVB-N - Total Volatile Basic Nitrogen TVC - Total viable count
TPA - Texture Profile Analysis
List of Symbols
xvii
FIGURE 1-1WORLD CAPTURE FISHERIES AND AQUACULTURE PRODUCTION (ADAPTED FROM (FAO,2014)). ... 5
FIGURE 1-2WORLD FISH UTILIZATION AND SUPPLY (ADAPTED FROM (FAO,2014)) ... 6
FIGURE 1-3FISHERY PRODUCTION IN LIVE WEIGHT EQUIVALENT AQUACULTURE CAPTURE FOR FOOD ... 7
FIGURE 2-1METHODS USED FOR FISH FRESHNESS AND QUALITY ASSESSMENT (ADAPTED FROM (ALASALVAR ET AL.,2010). 14
FIGURE 2-2FLAVOR PROFILES OF SEVERAL COMPONENTS OF A FISH OIL (ADAPTED FROM HUSS,H.H.(1995)). ... 22
FIGURE 3-1TYPES OF BIOBASED POLYMERS USED FOR BIOPACKAGING CATEGORIZED BY TYPE OF MATERIAL FROM WHICH THEY
ARE DERIVED (ADAPTED FROM (SRINIVASA &THARANATHAN,2007)). ... 28
FIGURE 3-2PATENTS SUBMISSION TRENDS RELATED TO EDIBLE COATINGS AND FILMS (ADAPTED FROM (ARANCA,2013)). .. 30
FIGURE 3-3STRUCTURE OF CHITIN (ADAPTED FROM (SHIEKH ET AL.,2013)) ... 31
FIGURE 3-4STEPS FOR THE ISOLATION OF CHITIN (ADAPTED FROM (SHIEKH ET AL.,2013)) ... 31
FIGURE 3-5CHEMICAL STRUCTURE OF CHITOSAN (ADAPTED FROM (SHIEKH ET AL.,2013)) ... 31
FIGURE 3-6ALKALINE DEACETYLATION PROCESS, TRANSFORMING CHITIN TO CHITOSAN (ADAPTED FROM (RAAFAT &SAHL,
2009)) ... 32
FIGURE 3-7OVERVIEW OF SOME BIOLOGICAL PROPERTIES OF CHITOSAN (ADAPTED FROM (KIM,2014)). ... 36
FIGURE 3-8APPLICATIONS OF CHITOSAN (ADAPTED FROM (SRINIVASA &THARANATHAN,2007)). ... 38
FIGURE 5-1EXAMPLE OF SERIAL DILUTION FROM AN INITIAL SAMPLE (ADAPTED FROM (MADIGAN,CLARK,STAHL,&
MARTINKO,2010)). ... 56
FIGURE 5-2REPRESENTATION OF A CONWAY CELL, WITH A SIDE AND TOP VIEW OF THE CELL (ADAPTED FROM
HTTP://WWW.UFRGS.BR/IMUNOVET/MOLECULAR_IMMUNOLOGY/INVITROCELLFREE.HTML AND
HTTP://WWW.INCHEM.ORG/DOCUMENTS/ANTIDOTE/ANTIDOTE/ANT02.HTM) ... 57
FIGURE 5-3GENERIC EXAMPLE OF A TPA(ADAPTED FROM (TEXTURE TECHNOLOGIES CORPORATION,2015B)). ... 60
FIGURE 6-1GLAZING AND COATING UPTAKE (%) FOR SALMON SAMPLES GLAZED WITH WATER AND COATED WITH 1.5%
CHITOSAN.EACH BAR REPRESENTS THE MEAN ± STANDARD DEVIATION OF TWENTY REPLICATIONS. ... 63
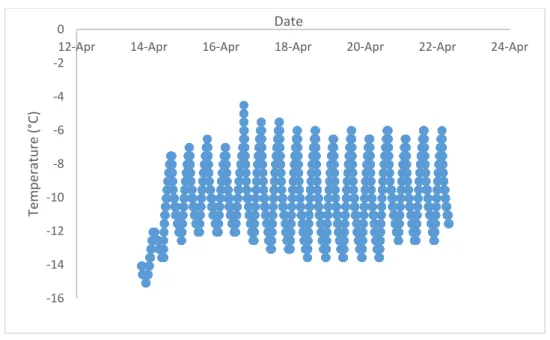
FIGURE 6-2TEMPERATURE PROFILE FOR THE FIRST TWO WEEKS INSIDE THE FREEZING CHAMBER DURING THE THERMAL STRESS
TEST. ... 64
FIGURE 6-3TVB-N VALUES FOR SALMON SAMPLES DURING 70 DAYS WEEKS OF STORAGE BETWEEN -15⁰C AND -5⁰C;
STANDARD DEVIATION CORRESPONDS TO FOUR REPLICATIONS; DIFFERENT SMALL LETTERS IN THE SAME SAMPLE TYPE,
AND DIFFERENT CAPITAL LETTERS IN THE SAME TIME MOMENT INDICATE A STATISTICALLY SIGNIFICANT DIFFERENCE
(TUKEY HSD TEST, P <0.05). ... 66
FIGURE 6-4 PH VALUES FOR SALMON SAMPLES DURING 70 DAYS OF STORAGE BETWEEN -15⁰C AND -5⁰C; STANDARD
DEVIATION CORRESPONDS TO THREE REPLICATIONS; DIFFERENT SMALL LETTERS IN THE SAME SAMPLE TYPE, AND
DIFFERENT CAPITAL LETTERS IN THE SAME TIME MOMENT INDICATE A STATISTICALLY SIGNIFICANT DIFFERENCE (TUKEY
HSD TEST, P <0.05). ... 67
FIGURE 6-5VISUAL REPRESENTATION, IN RGB, OF THE COLOR PARAMETERS L*A*B* FOR UNCOATED SALMON SAMPLES
DURING 70 DAYS OF STORAGE BETWEEN -15⁰C AND -5⁰C;FROM LEFT TO RIGHT IS POSSIBLE TO SEE FROM THE INITIAL
xviii
DURING 70 DAYS OF STORAGE BETWEEN -15⁰C AND -5⁰C;FROM LEFT TO RIGHT IS POSSIBLE TO SEE FROM THE INITIAL
MOMENT TO THE LAST ONE. ... 69
FIGURE 6-7VISUAL REPRESENTATION, IN RGB, OF THE COLOR PARAMETERS L*A*B* FOR CHITOSAN COATED SALMON
SAMPLES DURING 70 DAYS OF STORAGE BETWEEN -15⁰C AND -5⁰C;FROM LEFT TO RIGHT IS POSSIBLE TO SEE FROM
THE INITIAL MOMENT TO THE LAST ONE. ... 69
FIGURE 6-8∆E*AB VALUES FOR SALMON SAMPLES DURING 70 DAYS OF STORAGE BETWEEN -15⁰C AND -5⁰C; STANDARD
DEVIATION CORRESPONDS TO EIGHTEEN REPLICATIONS; DIFFERENT SMALL LETTERS IN THE SAME SAMPLE TYPE, AND
DIFFERENT CAPITAL LETTERS IN THE SAME TIME MOMENT INDICATE A STATISTICALLY SIGNIFICANT DIFFERENCE (TUKEY
HSD TEST, P <0.05). ... 70
FIGURE 6-9WATER GLAZING AND CHITOSAN COATING LOSSES OF SALMON SAMPLES DURING 70 DAYS STORAGE BETWEEN -15
⁰C AND -5⁰C; STANDARD DEVIATION CORRESPONDS TO FOUR REPLICATIONS; DIFFERENT SMALL LETTERS IN THE SAME
SAMPLE TYPE, AND DIFFERENT CAPITAL LETTERS IN THE SAME TIME MOMENT INDICATE A STATISTICALLY SIGNIFICANT
DIFFERENCE (TUKEY HSD TEST, P <0.05)... 72
FIGURE 6-10WEIGHT LOSS (%) OF SALMON SAMPLES FROM THE CONTROL GROUP DURING 70 DAYS OF STORAGE BETWEEN
-15⁰C AND -5⁰C.EACH BAR REPRESENTS THE MEAN ± STANDARD DEVIATION OF THREE REPLICATIONS.DIFFERENT
LETTERS INDICATE A STATISTICALLY SIGNIFICANT DIFFERENCE (TUKEY HSD TEST, P <0.05). ... 74
FIGURE 6-11WATER GLAZED SAMPLES, BEFORE (TOP PHOTO) AND AFTER MEASUREMENTS (BOTTOM PHOTO). ... 76
FIGURE 6-12CHITOSAN COATED SAMPLES, BEFORE (TOP PHOTO) AND AFTER MEASUREMENTS (BOTTOM PHOTO). ... 76
FIGURE 6-13GLAZING AND COATING UPTAKE (%) FOR SALMON SAMPLES GLAZED WITH WATER AND COATED WITH 1.5%
CHITOSAN USED FOR SENSORY ANALYSIS.EACH BAR REPRESENTS THE MEAN ± STANDARD DEVIATION OF ONE HUNDRED
AND FIVE REPLICATIONS. ... 77
FIGURE 6-14TVB-N VALUES FOR SALMON SAMPLES DURING SIX MONTHS OF STORAGE AT -20⁰C; STANDARD DEVIATION
CORRESPONDS TO FOUR REPLICATIONS; DIFFERENT SMALL LETTERS IN THE SAME SAMPLE TYPE, AND DIFFERENT CAPITAL
LETTERS IN THE SAME TIME MOMENT INDICATE A STATISTICALLY SIGNIFICANT DIFFERENCE (TUKEY HSD TEST, P <0.05).
... 79
FIGURE 6-15SENSORY PROFILE OF UNCOATED, WATER GLAZED, AND CHITOSAN COATED FROZEN SALMON SAMPLES, AT THE
BEGINNING OF STORAGE (TOP LEFT), AFTER TWO MONTHS OF STORAGE (TOP RIGHT), FOUR MONTHS OF STORAGE
(BOTTOM LEFT) AND SIX MONTHS OF STORAGE (BOTTOM RIGHT) AT -20⁰C. ... 80
FIGURE 6-16VARIABLE PROJECTION AFTER PCA ANALYSIS FOR THE FROZEN SALMON SAMPLES. ... 81
FIGURE 6-17CASE PROJECTION AFTER PCA ANALYSIS FOR THE FROZEN SALMON SAMPLES. ... 82
FIGURE 6-18SENSORY PROFILE OF UNCOATED, WATER GLAZED, CHITOSAN COATED, WATER THAWED AND CHITOSAN THAWED,
SALMON SAMPLES AFTER THAWING, AT THE BEGINNING OF STORAGE (TOP LEFT), AFTER TWO MONTHS OF STORAGE
(TOP RIGHT), FOUR MONTHS OF STORAGE (BOTTOM LEFT) AND SIX MONTHS OF STORAGE (BOTTOM RIGHT) AT -20⁰C.
... 84
FIGURE 6-19VARIABLE PROJECTION AFTER PCA ANALYSIS FOR THE THAWED SALMON SAMPLES. ... 85
xix
DIFFERENT CAPITAL LETTERS IN THE SAME TIME MOMENT INDICATE A STATISTICALLY SIGNIFICANT DIFFERENCE (TUKEY
HSD TEST, P <0.05). ... 88
FIGURE 6-22COHESIVENESS VALUES FOR THAWED SALMON SAMPLES DURING SIX MONTHS OF STORAGE AT -20⁰C;
STANDARD DEVIATION CORRESPONDS TO FOUR REPLICATIONS; DIFFERENT SMALL LETTERS IN THE SAME SAMPLE TYPE,
AND DIFFERENT CAPITAL LETTERS IN THE SAME TIME MOMENT INDICATE A STATISTICALLY SIGNIFICANT DIFFERENCE
(TUKEY HSD TEST, P <0.05). ... 89
FIGURE 6-23SPRINGINESS VALUES FOR THAWED SALMON SAMPLES DURING SIX MONTHS OF STORAGE AT -20⁰C; STANDARD
DEVIATION CORRESPONDS TO FOUR REPLICATIONS; DIFFERENT SMALL LETTERS IN THE SAME SAMPLE TYPE, AND
DIFFERENT CAPITAL LETTERS IN THE SAME TIME MOMENT INDICATE A STATISTICALLY SIGNIFICANT DIFFERENCE (TUKEY
HSD TEST, P <0.05). ... 90
FIGURE 6-24CHEWINESS VALUES FOR THAWED SALMON SAMPLES DURING SIX MONTHS OF STORAGE AT -20⁰C; STANDARD
DEVIATION CORRESPONDS TO FOUR REPLICATIONS; DIFFERENT SMALL LETTERS IN THE SAME SAMPLE TYPE, AND
DIFFERENT CAPITAL LETTERS IN THE SAME TIME MOMENT INDICATE A STATISTICALLY SIGNIFICANT DIFFERENCE (TUKEY
HSD TEST, P <0.05). ... 91
FIGURE 6-25VISUAL REPRESENTATION, IN RGB, OF THE COLOR PARAMETERS L*A*B* FOR UNCOOKED WATER GLAZED
SALMON SAMPLES DURING SIX MONTHS OF STORAGE AT -20⁰C;FROM LEFT TO RIGHT IS POSSIBLE TO SEE FROM THE
INITIAL MOMENT TO THE LAST ONE. ... 92
FIGURE 6-26VISUAL REPRESENTATION, IN RGB, OF THE COLOR PARAMETERS L*A*B* FOR UNCOOKED CHITOSAN COATED
SALMON SAMPLES DURING SIX MONTHS OF STORAGE AT -20⁰C;FROM LEFT TO RIGHT IS POSSIBLE TO SEE FROM THE
INITIAL MOMENT TO THE LAST ONE. ... 92
FIGURE 6-27∆E*AB VALUES FOR THAWED SALMON SAMPLES DURING SIX MONTHS OF STORAGE AT -20⁰C; STANDARD
DEVIATION CORRESPONDS TO EIGHTEEN REPLICATIONS; DIFFERENT SMALL LETTERS IN THE SAME SAMPLE TYPE, AND
DIFFERENT CAPITAL LETTERS IN THE SAME TIME MOMENT INDICATE A STATISTICALLY SIGNIFICANT DIFFERENCE (TUKEY
HSD TEST, P <0.05). ... 93
FIGURE 6-28SENSORY PROFILE OF UNCOATED, WATER GLAZED, AND CHITOSAN COATED FROZEN SALMON SAMPLES, AT THE
BEGINNING OF STORAGE (TOP LEFT), AFTER TWO MONTHS OF STORAGE (TOP RIGHT), FOUR MONTHS OF STORAGE
(BOTTOM LEFT) AND SIX MONTHS OF STORAGE (BOTTOM RIGHT) AT -20⁰C. ... 94
FIGURE 6-29VARIABLE PROJECTION AFTER PCA ANALYSIS FOR THE COOKED SALMON SAMPLES. ... 96
FIGURE 6-30CASE PROJECTION AFTER PCA ANALYSIS FOR THE COOKED SALMON SAMPLES. ... 97
FIGURE 6-31HARDNESS VALUES FOR COOKED SALMON SAMPLES DURING SIX MONTHS OF STORAGE AT -20⁰C; STANDARD
DEVIATION CORRESPONDS TO FOUR REPLICATIONS; DIFFERENT SMALL LETTERS IN THE SAME SAMPLE TYPE, AND
DIFFERENT CAPITAL LETTERS IN THE SAME TIME MOMENT INDICATE A STATISTICALLY SIGNIFICANT DIFFERENCE (TUKEY
HSD TEST, P <0.05). ... 99
FIGURE 6-32COHESIVENESS VALUES FOR COOKED SALMON SAMPLES DURING SIX MONTHS OF STORAGE AT -20⁰C; STANDARD
xx
HSD TEST, P <0.05). ... 100
FIGURE 6-33SPRINGINESS VALUES FOR COOKED SALMON SAMPLES DURING SIX MONTHS OF STORAGE AT -20⁰C; STANDARD
DEVIATION CORRESPONDS TO FOUR REPLICATIONS; DIFFERENT SMALL LETTERS IN THE SAME SAMPLE TYPE, AND
DIFFERENT CAPITAL LETTERS IN THE SAME TIME MOMENT INDICATE A STATISTICALLY SIGNIFICANT DIFFERENCE (TUKEY
HSD TEST, P <0.05). ... 101
FIGURE 6-34CHEWINESS VALUES FOR COOKED SALMON SAMPLES DURING SIX MONTHS OF STORAGE AT -20⁰C; STANDARD
DEVIATION CORRESPONDS TO FOUR REPLICATIONS; DIFFERENT SMALL LETTERS IN THE SAME SAMPLE TYPE, AND
DIFFERENT CAPITAL LETTERS IN THE SAME TIME MOMENT INDICATE A STATISTICALLY SIGNIFICANT DIFFERENCE (TUKEY
HSD TEST, P <0.05). ... 102
FIGURE 6-35VISUAL REPRESENTATION, IN RGB, OF THE COLOR PARAMETERS L*A*B* FOR COOKED WATER GLAZED SALMON
SAMPLES DURING SIX MONTHS OF STORAGE AT -20⁰C;FROM LEFT TO RIGHT IS POSSIBLE TO SEE FROM THE INITIAL
MOMENT TO THE LAST ONE. ... 103
FIGURE 6-36VISUAL REPRESENTATION, IN RGB, OF THE COLOR PARAMETERS L*A*B* FOR COOKED CHITOSAN COATED
SALMON SAMPLES DURING SIX MONTHS OF STORAGE AT -20⁰C;FROM LEFT TO RIGHT IS POSSIBLE TO SEE FROM THE
INITIAL MOMENT TO THE LAST ONE. ... 103
FIGURE 6-37∆E*AB VALUES FOR COOKED SALMON SAMPLES DURING SIX MONTHS OF STORAGE AT -20⁰C; STANDARD
DEVIATION CORRESPONDS TO EIGHTEEN REPLICATIONS; DIFFERENT SMALL LETTERS IN THE SAME SAMPLE TYPE, AND
DIFFERENT CAPITAL LETTERS IN THE SAME TIME MOMENT INDICATE A STATISTICALLY SIGNIFICANT DIFFERENCE (TUKEY
xxi
FIGURE A.2SENSORY EVALUATION SHEET FOR THAWED SALMON SAMPLES. ... 121
FIGURE A.3SENSORY EVALUATION SHEET FOR COOKED SALMON SAMPLES. ... 123
FIGURE A.4VALUES OF THE COLOR PARAMETER L* FOR UNCOATED, WATER GLAZED, AND CHITOSAN COATED SALMON SAMPLES DURING
70 DAY STORAGE BETWEEN -15⁰C AND -5⁰C; STANDARD DEVIATION CORRESPONDS TO EIGHTEEN REPLICATIONS; DIFFERENT
SMALL LETTERS IN THE SAME SAMPLE TYPE, AND DIFFERENT CAPITAL LETTERS IN THE SAME TIME MOMENT INDICATE A
STATISTICALLY SIGNIFICANT DIFFERENCE (TUKEY HSD TEST, P <0.05). ... 125
FIGURE A.5VALUES OF THE COLOR PARAMETER A* FOR UNCOATED, WATER GLAZED, AND CHITOSAN COATED SALMON
SAMPLES DURING 70 DAY STORAGE BETWEEN -15⁰C AND -5⁰C; STANDARD DEVIATION CORRESPONDS TO EIGHTEEN
REPLICATIONS; DIFFERENT SMALL LETTERS IN THE SAME SAMPLE TYPE, AND DIFFERENT CAPITAL LETTERS IN THE SAME
TIME MOMENT INDICATE A STATISTICALLY SIGNIFICANT DIFFERENCE (TUKEY HSD TEST, P <0.05). ... 125
FIGURE A.6VALUES OF THE COLOR PARAMETER B* FOR UNCOATED, WATER GLAZED, AND CHITOSAN COATED SALMON SAMPLES DURING
70 DAY STORAGE BETWEEN -15⁰C AND -5⁰C; STANDARD DEVIATION CORRESPONDS TO EIGHTEEN REPLICATIONS; DIFFERENT
SMALL LETTERS IN THE SAME SAMPLE TYPE, AND DIFFERENT CAPITAL LETTERS IN THE SAME TIME MOMENT INDICATE A
STATISTICALLY SIGNIFICANT DIFFERENCE (TUKEY HSD TEST, P <0.05). ... 126
FIGURE A.7VALUES OF THE COLOR PARAMETER L* FOR THAWED WATER GLAZED AND CHITOSAN COATED SALMON SAMPLES DURING SIX
MONTHS OF STORAGE AT -20⁰C; STANDARD DEVIATION CORRESPONDS TO EIGHTEEN REPLICATIONS; DIFFERENT SMALL LETTERS
IN THE SAME SAMPLE TYPE, AND DIFFERENT CAPITAL LETTERS IN THE SAME TIME MOMENT INDICATE A STATISTICALLY
SIGNIFICANT DIFFERENCE (TUKEY HSD TEST, P <0.05). ... 127
FIGURE A.8VALUES OF THE COLOR PARAMETER A* FOR THAWED WATER GLAZED AND CHITOSAN COATED SALMON SAMPLES DURING SIX
MONTHS OF STORAGE AT -20⁰C; STANDARD DEVIATION CORRESPONDS TO EIGHTEEN REPLICATIONS; DIFFERENT SMALL LETTERS
IN THE SAME SAMPLE TYPE, AND DIFFERENT CAPITAL LETTERS IN THE SAME TIME MOMENT INDICATE A STATISTICALLY
SIGNIFICANT DIFFERENCE (TUKEY HSD TEST, P <0.05). ... 127
FIGURE A.9VALUES OF THE COLOR PARAMETER B* FOR THAWED WATER GLAZED AND CHITOSAN COATED SALMON SAMPLES DURING SIX
MONTHS OF STORAGE AT -20⁰C; STANDARD DEVIATION CORRESPONDS TO EIGHTEEN REPLICATIONS; DIFFERENT SMALL LETTERS
IN THE SAME SAMPLE TYPE, AND DIFFERENT CAPITAL LETTERS IN THE SAME TIME MOMENT INDICATE A STATISTICALLY
SIGNIFICANT DIFFERENCE (TUKEY HSD TEST, P <0.05). ... 128
FIGURE A.10VALUES OF THE COLOR PARAMETER L* FOR COOKED WATER GLAZED AND CHITOSAN COATED SALMON SAMPLES DURING
SIX MONTHS OF STORAGE AT -20⁰C; STANDARD DEVIATION CORRESPONDS TO EIGHTEEN REPLICATIONS; DIFFERENT SMALL
LETTERS IN THE SAME SAMPLE TYPE, AND DIFFERENT CAPITAL LETTERS IN THE SAME TIME MOMENT INDICATE A
STATISTICALLY SIGNIFICANT DIFFERENCE (TUKEY HSD TEST, P <0.05). ... 128
FIGURE A.11VALUES OF THE COLOR PARAMETER A* FOR COOKED WATER GLAZED AND CHITOSAN COATED SALMON SAMPLES DURING
SIX MONTHS OF STORAGE AT -20⁰C; STANDARD DEVIATION CORRESPONDS TO EIGHTEEN REPLICATIONS; DIFFERENT SMALL
LETTERS IN THE SAME SAMPLE TYPE, AND DIFFERENT CAPITAL LETTERS IN THE SAME TIME MOMENT INDICATE A
xxii
SIX MONTHS OF STORAGE AT -20⁰C; STANDARD DEVIATION CORRESPONDS TO EIGHTEEN REPLICATIONS; DIFFERENT SMALL
LETTERS IN THE SAME SAMPLE TYPE, AND DIFFERENT CAPITAL LETTERS IN THE SAME TIME MOMENT INDICATE A
xxiii
TABLE 1-1WORLD FISHERIES AND AQUACULTURE PRODUCTION AND UTILIZATION (ADAPTED FROM (FAO,2014)) ... 6
TABLE 2-1FISH CATEGORIES AND RESPECTIVE TVB-N LIMIT (ADAPTED FROM (OFFICIAL JOURNAL OF THE EUROPEAN
COMMUNITIES,1995)) ... 16
TABLE 2-2.SOME OF THE PARAMETERS OBTAINED IN A TPA AND THEIR MEANING (ADAPTED FROM (TEXTURE TECHNOLOGIES
CORPORATION,2015A)) ... 19
TABLE 2-3ADVANTAGES AND DISADVANTAGES OF USING A PANEL OF JUDGES FOR SENSORY ASSESSMENT (ADAPTED FROM
(CAMOSOFTWARE AS,2015)) ... 25
TABLE 3-1SPECIFIC REQUIREMENTS FOR COATINGS AND FILMS (ADAPTED FROM (DEBEAUFORT ET AL.,1998)) ... 29
TABLE 3-2MIC OF NATIVE CHITOSAN AGAINST FUNGI (ADAPTED FROM (RABEA ET AL.,2003)) ... 33
TABLE 3-3MIC OF NATIVE CHITOSAN AGAINST FUNGI (ADAPTED FROM (RABEA ET AL.,2003)) ... 34
TABLE 3-4RELATIONSHIP BETWEEN CHITOSAN BIOLOGICAL ACTIVITIES AND THEIR CHARACTERISTICS (ADAPTED FROM (KIM,
2014)) ... 36
TABLE 5-1SETTINGS FOR THE TESTS PERFORMED WITH THE THAWED SAMPLES ... 61
TABLE 6-1TVC VALUES FOR FROZEN SALMON SAMPLES UNCOATED, GLAZED WITH WATER AND COATED WITH CHITOSAN
DURING 70 DAYS OF STORAGE BETWEEN -15⁰C AND -5⁰C; STANDARD DEVIATION CORRESPONDS TO FOUR
REPLICATIONS ... 65
TABLE 6-2WATER GLAZING AND CHITOSAN COATING THICKNESS MEASUREMENTS OF SALMON SAMPLES BEFORE AND AFTER
70 DAYS OF STORAGE BETWEEN -15⁰C AND -5⁰C; STANDARD DEVIATION CORRESPONDS TO TEN REPLICATIONS;
DIFFERENT SMALL LETTERS IN THE SAME SAMPLE TYPE, AND DIFFERENT CAPITAL LETTERS IN THE SAME TIME MOMENT
INDICATE A STATISTICALLY SIGNIFICANT DIFFERENCE (TUKEY HSD TEST, P <0.05). ... 75
TABLE 6-3TVC VALUES FOR FROZEN UNCOATED, GLAZED WITH WATER AND COATED WITH CHITOSAN SALMON SAMPLES
DURING 6 MONTHS OF STORAGE AT -20⁰C; STANDARD DEVIATION CORRESPONDS TO FOUR REPLICATIONS ... 78
TABLE 6-4VARIABLE CONTRIBUTION WITHIN REDUCED FACTORS AFTER PCA ANALYSIS FOR THE FROZEN SALMON SAMPLES . 82
TABLE 6-5EIGENVALUES OF FROZEN SALMON SAMPLES ... 83
TABLE 6-6VARIABLE CONTRIBUTION WITHIN REDUCED FACTORS AFTER PCA ANALYSIS FOR THE THAWED SALMON SAMPLES 86
TABLE 6-7EIGENVALUES OF THE THAWED SALMON SAMPLES ... 87
TABLE 6-8VARIABLE CONTRIBUTION WITHIN REDUCED FACTORS AFTER PCA ANALYSIS FOR THE COOKED SALMON SAMPLES . 96
1
Introduction
In today’s society, the search for better and more valuable products, as well as a growing concern relating to the health implications of the consumers’ diet has led to changes in the frozen fish industry.
Fish attracts the consumers attention as a source of important components in a nutritional and healthy diet (Rodriguez-Turienzo et al., 2011), which leads to an increase in fish consumption. Taking in consideration that fish is a very perishable product improving its preservation is a very important issue in the fish industry. The most used method in the preservation of fish is freezing. However, even glazing has its limitations and the search for improved performance has led to the proposal to use a chitosan coating in order to improve microbiological safety and extend the shelf-life of fish (Soares, Oliveira, & Vicente, 2015). However it is necessary to know if the use of a chitosan coating has indeed an effect that can be perceived at the time of consumption. In this context this work intends to analyze the effects, from microbiological to sensory effects of a chitosan coating in frozen salmon at the moment of consumption. This thesis is organized in two parts, Part I – State of the Art and Part II – Experimental Work. Part I is composed by four chapters, and Part II is constituted by an additional three chapters. Chapter 1 provides an overview on the importance of fish in our daily life and diet, and on the growing industry. This chapter also reflects on the changes happening in the industry, and also refers to the current legislation, the importance of fish preservation and its main methods. The concept of fish quality and our perception of it, as well as the methods that allow us to assess it, are presented in Chapter 2. Chapter 3 introduces the new methods for fish preservation, such as edible packaging, films and coatings, where several compounds with the ability to be used in edible packaging, films or coatings are presented, with a greater focus on chitosan, the compound of choice for this work and its physicochemical and biomedical characteristics that make it a solution for the preservation of fish in the frozen fish industry. Chapter 4 addresses the question of flavor diffusion from the chitosan coatings.
2
Part II is initiated with Chapter 5, which introduces the methods used in this work, such as the preparation of salmon samples for coating and glazing, the determination of the values of TVC, TVB-N, glazing percentages, coating loss, pH, texture and color parameters, as well as microscopic and sensory analyses. In Chapter 6 the results of the performed tests are presented and discussed, and Chapter 7 shows the main conclusions of this thesis and suggests future work and enhancements.
5
Chapter 1. Fish
1.1. Fish Industry and consumption
The consumption of fish has been steadily increasing over the last few years, due to its nutritional characteristics as well as for its benefits to the health of the consumers.
According to the latest publication of State of the World Fisheries and Aquaculture (SOFIA), from the department of Food and Agriculture Organization of the United Nations (FAO), the total amount of world fisheries has been steadily increasing over the past few decades, as shown in Figure 1-1, with the use of fish for food purposes increasing at an average annual rate of 3.2 % (FAO, 2014).
Figure 1-1 World capture fisheries and aquaculture production (adapted from (FAO, 2014)).
The consumption of fish per capita increased from an average of 9.9 kg in 1960, to 19.2 kg in 2012, as shown in Table 1-1 (FAO, 2014).
6
Table 1-1 World fisheries and aquaculture production and utilization (adapted from (FAO, 2014))
2007 2008 (millions of tonnes) 2009 2010 2011 2012 Production Capture Inland 10.1 10.3 10.5 11.3 11.1 11.6 Marine 80.7 79.9 79.6 77.8 82.6 79.7 Total Capture 90.8 90.1 90.1 89.1 93.7 91.3 Aquaculture Inland 29.9 32.4 34.3 36.8 38.7 41.9 Marine 20.0 20.5 21.4 22.3 23.3 24.7 Total Aquaculture 49.9 52.9 55.7 59.0 62.0 66.6
Total World fisheries 140.7 143.1 145.8 148.1 155.7 158.0
Utilization
Human consumption 117.3 120.9 123.7 128.2 131.2 136.2
Non-food uses 23.4 22.2 22.1 19.9 24.5 21.7
Population (billions) 6.7 6.8 6.8 6.9 7.0 7.1
Per capita food fish supply (kg) 17.6 17.9 18.1 18.5 18.7 19.2
Table 1-1 and Figure 1-2 also show that most of the capture is marine while aquaculture is carried out mostly inland. It is also showed that fish utilization is mostly for human consumption and has been increasing over the last few years, as well as the per capita food fish supply, reaching a new high in the year of 2012 (FAO, 2014).
Figure 1-2 World fish utilization and supply (adapted from (FAO, 2014))
However, fish besides being a healthy food product is also as a source of proteins. A daily portion of 150 g of fish can provide about 50 % to 60 % of the protein daily needs for an adult. In 2010, fish was responsible for 16.7 % of the world population consumption of animal protein and of 6.5 % of all consumed protein. Furthermore, fish provided more than 2.9 billion of people with almost 20 % of their animal protein intake,
7 and 4.3 billion of people with around 15 % of their animal protein intake. Fish proteins can represent an essential nutritional component in some densely populated countries, where the total levels of protein consumption can be low, which demonstrates the great importance that this industry has in society, both in developed and developing countries (FAO, 2014).
It is also possible to verify in Table 1-1 and in Figure 1-2, that while the world capture of fish has remained constant, the production in aquiculture has been increasing over the last few years, which leads to an overall increase in total production of fish (FAO, 2014).
According to the 2014 OECD-FAO Agricultural Outlook report, fish and fishery products are expected to continue to be highly traded, but overall trade is projected to grow at a slightly slower rate than it did the past, mainly due to higher transportation costs, slower output growth and a decreased demand in selected importing countries (OECD/FAO, 2014)
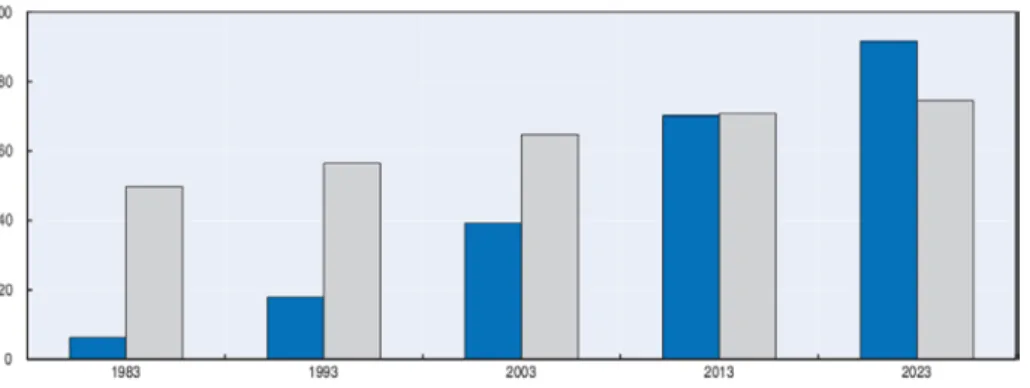
According to forecasts for the time period between 2014 and 2023, an increase by 17 % in total world fisheries production is expected, despite the recent instability of prices. This increase in production will be mainly caused by aquiculture production, which is predicted to reach approximately 49 % of the total world fisheries by 2023. While currently aquaculture production and capture fisheries are equal in terms of human consumption volume, aquaculture production has already surpass in 2014 capture fisheries in terms of human consumption, and by 2023 the difference is expected to be quite significant, as shown in Figure 1-3 (OECD/FAO, 2014).
8
1.1.1 Legislation
Fresh fish is among the most perishable foods due to some intrinsic characteristics of fish, such as its lipid content and its consequent oxidation, due to microbiological changes that occur in the fish, and also due to external factors such as temperature, exposure time before preservation methods are applied, handling, physical condition and fish size (Huss, 1995).
In order to respect food legislation and be fit for human consumption the fish product has to comply with certain microbiological levels. The European Regulation EC Nº1441/2007 defines the microbiological standard regarding foodstuffs. However, the only standard directly applicable to frozen fish regards the presence of histamine, which is limited to 200 mg/kg of fish; nevertheless it is common in the frozen fish industry to assume limits regarding fresh fish in its control, such as the standard regarding Salmonella, or the one regarding E. coli (Official Journal of the European Union, 2007). The Codex Alimentarius defines several other standards such as microbiological ones, presence of additives and method of preparation (Codex Alimentarius, 1966, 2012)
Thereby the improvement in preservation techniques in order to bring the fish product in a safely manner to the consumer, while maintaining its organoleptic characteristics, are a major concern of this industry.
1.2. Post Mortem changes
1.2.1. Sensory changes
Sensory changes can be defined as those sensed with the senses, such as appearance, odor, texture and flavor (Huss, 1995).
The first sensory changes of fish during storage are related with appearance and texture. The taste of the species is usually developed after the first couple of days during storage in ice (Huss, 1995).
A characteristic pattern of the deterioration of fish stored in ice can be divided into four phases, which can be seen below (Huss, 1995).
9 • Phase 1: The fish is very fresh and has a sweet, seaweedy and delicate taste.
The taste can be very slightly metallic;
• Phase 2: There is a loss of the characteristic odor and taste. The flesh becomes neutral but has no off-flavors. The texture is still pleasant;
• Phase 3: There is sign of spoilage and a variety of volatile, unpleasant-smelling substances are produced depending on the fish species and type of spoilage. • Phase 4: The fish can be characterized as spoiled and putrid.
1.2.2. Microbiological changes
In live and newly caught fish, microorganisms can only be found on the surface, and in the intestines. The flesh is sterile as the immune system of the fish prevents the bacteria from growing in the flesh. When the fish dies, the immune system collapses and bacteria are allowed to proliferate freely. During storage, bacteria invade the flesh by moving between the muscle fibers (Huss, 1995).
Because microbiological growth is the main cause of fish spoilage, factors such as temperature, moisture, and oxygen must be controlled in order to delay fish spoilage (Johnston, Nicholson, Roger, & Stroud, 1994).
1.3. Preservation of fish
Fresh fish is one of the most perishable foodstuffs. Fish deterioration is a common result of microbial growth or oxidation, and can be prevented by using methods such as freezing. The increase of world population and the need to store and transport fish are factors that intensify this problem and make its preservation, in order to maintain its nutritional proprieties, flavor, color, texture and extend its shelf life, one of the industry greatest concerns (Ghaly, Dave, Budge, & Brooks, 2010).
Fish preservation can be accomplished by several methods. In the fishing industry the most widely used are freezing and glazing.
1.3.1. Freezing
Freezing represents the main method of fish processing for human consumption. Freezing inhibits enzymatic activities, which allows to slow down the growth of microorganisms, reducing the microbial metabolism responsible for the deterioration
10
(González-Méndez, Alemán-Escobedo, Zamorano-García, & Camou-Arriola, 2004; Nielsen & Jessen, 2007)
The fish products are constituted by a great percentage of water, up to 80 %, most of which is transformed to ice during the freezing process, which allows to decrease the water activity (aW), and if the process is conducted correctly it allows to guarantee a shelf life of over a year (Johnston et al., 1994). However the freezing process does not guarantee that the final product quality after one year of storage is the same that the initial product quality, because freezing cannot inhibit completely the chemical and microbial reactions, such as lipid oxidation, protein denaturation, as well as surface dehydration resulting in fish deterioration during prolonged storage, resulting in undesirable flavors, rancidity, dehydration and autolysis and microbial spoilage (Gonçalves & Gindri Junior, 2009; Rodriguez-Turienzo et al., 2011; Sathivel, Liu, Huang, & Prinyawiwatkul, 2007)
The extent of loss of quality depends on many factors, including freezing and thawing speed, storage temperature, temperature fluctuations, overuse of freezing-thawing processes during storage, transportation, exposure and consumption. It should also be noted that freezing does not improve the quality of the product; the final quality depends essentially on the quality of the product at the moment of freezing and of the freezing conditions, storage and distribution (Gonçalves & Gindri Junior, 2009).
The Council directive 89/208/EEC regulates the freezing process and establishes that the temperature for quick-frozen food products should be maintained below -18 ⁰C, as this is the temperature that inhibits microbiological activity capable of deteriorating the quality of food products. However some temperature fluctuations are inevitable in handling and storage of the product, prior to the sale to the consumer, so fluctuations up to 3 ⁰C are accepted during transportation (Ghaly et al., 2010; Jiang & Lee, 2004; Official Journal of the European Communities, 1989).
1.3.2. Glazing
In the last few years the demand for frozen fish has been growing, as opposed to fresh fish. One of the main reasons is the efficiency of the preservation of the frozen fish. However, the traditional storage process of frozen fish can lead to a progressive
11 deterioration of its intrinsic and sensory characteristics (Vanhaecke, Verbeke, & De Brabander, 2010). Glazing is largely used in the fish industry to protect fish from the deterioration of these characteristics, and can be defined as the application of a layer of ice in frozen products surface by means of a dipping process, or by spraying in a water bath (Zoldos et al., 2011). Glazing is still considered the less expensive protection technology, having thus became a widely used process in the fish industry; Nevertheless new alternitives have arisen such as packaging materials that are impermeable to humidity and oxygen and can provide an effective protection during the storage period (Noomhorm & Vongsawasdi, 2004).
During frozen storage, sea products may suffer from dehydration and surface drying, in result of contact with very cold temperatures (freeze burn). Glazing will delay the dehydration of the surface of the product, as it will be the glazing to be sublimated instead of the water of the fish tissue; glazing will also reduce the oxidation rate, through air exclusion from the surface of the product, also serving as a protective barrier regarding temperature fluctuation. The amount of glazing, and consequently the thickness of the glazing, obtained depends on factors such as the size and shape of the fish product, the water and product temperatures and also with the glazing time. (Gonçalves & Gindri Junior, 2009; Johnston et al., 1994; Vanhaecke et al., 2010)
It is intended that the entire product surface is completely and uniformly glazed, typically with a percentage of glazing between 4 % and 10 %, although it may vary between 2 % and 20 % depending on the product in question (Vanhaecke et al., 2010).
The amount of glazing to be used in a fish product, as mentioned before, does not have a specific legislation, and it can be a very important factor for guaranteeing consumer satisfaction, for assessing its protective function, and also for economic reasons. Thus, a low percentage of glazing (below 6 %) may not assure the protection of the fish, and can lead to a diminished quality of the final product. From an economic perspective, an excessive percentage of glazing (over 12 %) can guarantee higher profits for the sellers, since the consumers will be paying water for the price of fish, although some efforts are being made in this area in the European Community. In any of these circumstances the consumer is always the most affected party (Vanhaecke et al., 2010).
13
Chapter 2. Fish Quality
Raw seafood is a highly perishable product. In order to maximize the value of fish, regarding both taste and economic value, freshness quality must be maintained (Sea Fish, 2011).
Quality is defined as the degree to which a set of inherent characteristics fulfill specified requirements (ISO/IEC, 2005). Regarding fish products, it involves aspects associated with gastronomic delights, purity, nutrition, safety, consistency, and product excellence. In international fish trade, two of the most important aspects taken in consideration are safety and sensory quality (regarding the level of spoilage) (FAO, 2005).
Freshness is one of the most important parameters for the quality of the final product. Freshness can be translated by some sensory, (bio)chemical, physical and microbiological parameters (Olafsdóttir et al., 1997).
In the majority of cases "quality" refers to the visual appearance and freshness or the deterioration which the fish has endured. It can also involve safety characteristics such as lack of harmful bacteria, parasites or chemicals present in the fish. It is important to remember that "quality'' involves different things to different people involving a certain degree of subjectivity (Huss, H. H, 1995).
The principal methods for the assessment of fresh fish quality can be split into two categories: sensory and instrumental (or non-sensory). Considering that the consumer is the final evaluator of quality, most chemical or instrumental methods should be linked to a sensory evaluation before being used in the laboratory. Nevertheless, sensory methods should be executed scientifically under carefully controlled conditions so that the effects of test environment or personal bias can be reduced (Huss, H. H, 1995). The instrumental methods comprise chemical, physical and microbiological methods (FAO, 2005).
The several methods for the assessment of fish quality can be seen in Figure 2-1 (Alasalvar, Grigor, & Ali, 2010).
14
15
2.1.
Non-sensory methods
The need for processing in order to perform a sensory evaluation, using instrumental methods, led to the search for alternative non-sensory instrumental methods, such as chemical, physical, and microbiological methods (Alasalvar et al., 2010).
2.1.1. Microbiological methods
The activity of microorganisms is the main factor limiting the shelf life of fresh fish. The purpose of microbiological exams of fish products is to assess the possible presence of bacteria or organisms of public health importance and to give an impression of the hygienic quality of the fish including temperature abuse and hygiene during handling and processing (FAO, 2005; Huss, H. H, 1995)
2.1.1.1. Total Viable Counts (TVC)
The total viable count represents, the total number of bacteria that are capable of forming visible colonies on a culture media at a given temperature (Huss, H. H, 1995).
An estimate of the total viable counts is used as an acceptability index in standards, guidelines and specifications (ISO, 2013; Olafsdóttir et al., 1997).
If a count is performed after systematic sampling and a detailed knowledge of the handling of the fish before sampling, temperature conditions and packaging, the results of the count can provide a comparative measure of the overall degree of bacterial contamination and the hygiene utilized (Huss, H. H, 1995).
Higher incubation temperatures (above 30 °C) are considered inappropriate when performing an examination to seafood products held at chill temperatures (Huss, H. H, 1995).
2.1.2. Chemical methods
The interest in the use of chemical methods for the assessment of fish quality is tied to the ability to establish quantitative standards. The establishment of tolerance levels of chemical spoilage indicators helps eliminate the necessity of making decisions regarding product quality based on personal opinions. In general, sensory methods are
16
great for assessing products of very good or poor quality. On the other hand, chemical methods may best be applied regarding products of marginal quality (Huss, H. H, 1995).
Chemical methods rely on the measurement of metabolites produced during fish storage or distribution to obtain a quantitative fish index, so the chemical compound to be analyzed and measured should increase or decrease with the level of microbial spoilage or autolysis (FAO, 2005; Huss, H. H, 1995). One of the most widely used methods is the Total Volatile Basic Nitrogen (TVB-N).
2.1.2.1. Total Volatile Basic Nitrogen
A TVB-N test measures the content of trimethylamine, dimethylamine, ammonia and other basic nitrogenous compounds that generally associated with fish spoilage (FAO, 2005; Huss, H. H, 1995).
Despite TVB-N analyses being considered simple to execute, they have the disadvantage of only reflecting in the later stages of fish spoilage, and are normally unreliable for measurements in the first few days of storage. This methods also presents the disadvantage of not giving any information about the type of spoilage (Huss, H. H, 1995).
The Directive 95/149/EC establishes limits for TVB-N values, while also imposing the methods of analysis. Some of this limits can be seen in Table 2-1 (Official Journal of the European Communities, 1995).
Table 2-1 Fish categories and respective TVB-N limit (adapted from (Official Journal of the European Communities,
1995))
Fish category nitrogen/100 g of fish) TVB-N limit (mg Sebastes sp. 25 Helicolenus dactylopterus Sebastichthys capensis Pleuronectidae (except Hippoglossus sp.) 30 Salmo salar 35 Merluccidae Gadidae
17
2.1.3. Physical methods
The use of physical methods generally involves the measurement of fish pH, its texture and/or color (FAO, 2005).
2.1.3.1. Color
Color is one of the major attributes that impact the consumer perception of quality. The degree of acceptability of a product is conditioned by how much the color deviates from the expected range for food acceptance by the consumer (Francis, 1995; HunterLab, 2008).
A color space is a useful conceptual tool that helps to understand the color capabilities of a particular device or digital file. There are several color spaces, such as CIE xyz (1931), CIE L*a*b*, and CIE L u'v' (1976).
Color space (CIE L*a*b*)
The L*a*b* color space (also referred to as the CIELAB space) is one of the uniform color spaces defined by the CIE in 1976 (Minolta, 2007).
The structure of the L*a*b* color space derives from the theory that a color cannot be both green and red at the same time, neither it can be blue and yellow at the same time. This way, single values are used to describe the red/green and the yellow/blue attributes. When a color is expressed in CIE L*a*b*, L* stands for lightness, a* and b* are the chromatically coordinates. +a* represents red direction, while -a* is the green direction, +b* is the yellow direction, and -b* represents the blue direction (Minolta, 2007; X-Rite, 2004).
Color differences
Color can be measured numerically trough the help of a colorimeter in an easy and accurate manner, complying with international standards.
In the CIE L*a*b* color space, color difference are expressed through a single value, ∆E*ab, that provides the value of the difference between colors, but does not gives any information regarding how the colors are different from one another. ∆E*ab for the CIE L*a*b* color space can be calculated through Equation 2-1.
18
∆E*ab = �(∆L)2+ (∆a*)2+ (∆b*)2
In which the parameters ∆L*, ∆a*, ∆b* regard the difference in the L*, a* and b* values between two different colors (Minolta, 2007).
The color of a product can be critical to its acceptability by the consumers. Considering that, gauging the difference between two samples is very important. However not all differences can be seen by the normal consumer.
∆E*ab values lesser than 1 are normally invisible to the naked eye, while values between 1 and 2 represent a small difference that may be detected by a trained observer. Values greater than 2 and less than 3.5 represent medium differences that can be obvious even to untrained observers. Values above 3.5 are very obvious to all observers (Cruse, 2015; EFI, n.d.).
2.1.3.2. pH
Knowledge about the pH of fish can give important information about the fish condition. Measurements are performed with a pH-meter that can be placed directly into the fish muscle or into a suspension of fish muscle and distilled water (Huss, H. H, 1995).
Normal pH values for salmon samples are usually between a minimum limit of 6.0 and a maximum limit of 6.5. At a normal condition the salmon’s pH is close to a neutrl value, but as the post mortem changes occur, the decomposition of nitrogenous compounds leads to the increase in pH of the fish fillet. This increase in pH has an altering effect on the quality of the product during storage; especially, the sensorial characteristics such as odor, color, and texture which are affected negatively (Kilincceker, Dogan, & Kucukoner, 2009).
2.1.3.3. Texture
Texture is an important property of fish muscle. Fish muscle can suffer changes either resulting from frozen storage or resulting from autolytic degradation. Texture can be monitored organoleptically but there was a need for the development of an unbiased rheological test which could truthfully reflect the subjective assessment of a well-trained
19 panel of judges (Huss, H. H, 1995). The initial developments in the creation of a procedure to measure the texture of foods, were made by Friedman, Whitney and Szczesniak, at the General Foods Corporation, in 1963, when they published a procedure for texture measurement. This method was later adapted and improved by Dr. Malcom Bourne in 1968, and more changes have been made since then, leading to the current state of the Texture Profile Analysis (TPA) test (Rosenthal, 2010).
TPA has become a widely used double compression test that helps to determine the textural properties of foods. In this test, samples are compressed twice using a texture analyzer to provide information into how samples behave when chewed. Due to the procedure, this test as also become known as the two bite test, as it tries to mimic the mouth biting on food. One of the great advantages of this test is that it can measure multiple parameters with just one experiment, such as the ones seen in Table 2-2 (Rosenthal, 2010; Texture Technologies Corporation, 2015a).
Table 2-2. Some of the parameters obtained in a TPA and their meaning (adapted from (Texture Technologies
Corporation, 2015a))
Parameter Meaning
Hardness Hardness is the value of the peak force that occurs during the first compression Fracturability Fracturability occurs when the TPA plot has its first significant peak during the first compression Cohesiveness The ability of a product to withstand a second deformation regarding its resistance under the first deformation. Springiness Represents how well a product physically springs back after it has been deformed during the first compression
These parameters have evolved and changed during the last few decades, incorporating suggestions from consumers, and aiming to produce more reliable results and data on the textural properties of foods.
2.2.
Sensory Analysis
Sensory assessment of fish freshness is still one of the most important assessment methods used by the seafood industry. It is mostly utilized in the determination of product specification or standards in quality control. Thus, sensory assessments are gaining importance in market development and are regularly correlated with
non-20
sensory methods such as chemical, microbial, and physical assessment techniques (Green, 2010).
Sensory assessment of fish quality can be defined as the scientific discipline used to evoke, measure, analyze and interpret reactions to characteristics of food as perceived through the use of one or more of the five senses to judge (FAO, 2005; Huss, 1995).
Most of the sensory characteristics of fish can only be measured reliably by humans. Nonetheless, developments are being made in the research and development of instruments that can measure individual quality changes (Huss, 1995).
In sensory analysis the characteristics of appearance, odor, flavor and texture are assessed using the human senses. In the scientific approach, the process can be separated into three distinct steps. The first one consists of the detection of a stimulus by the human senses; the second one consists of an evaluation and interpretation by a mental process; and lastly the third step consists of the response of the assessor to the stimuli (Huss, H. H, 1995).
The use of sensory assessment arises from the necessities such as to define quality control parameters, and conduct market research. Its possible do divide the sensory assessment in to an objective assessment and a subjective assessment (Torry Research Station, 2001).
Objective sensory assessment is utilized for two main objectives. The first one is frequently met when it is necessary to describe specific aspects of quality that are significant. The second one is the use of an objective assessment to create a distinction between two or more products (Torry Research Station, 2001).
Subjective assessment is utilized in product development and market research, and is largely used to discover what the normal consumers thinks about fish products. Thus this type of assessment is more often used in the industry and it is a vital part of it (Torry Research Station, 2001).
It is quite important to be conscious of the differences that exist between different individuals, and their sensitivity and perceptions relating to different products characteristics when selecting and training judges for sensory analysis. Interpretation of
21 the stimulus and the respective response should be trained very carefully in order to guarantee an objective response (Huss, 1995).
2.2.1. Sensory methods
There are two principal kinds of sensory testing methods, objective and subjective, which are used to assess fish freshness. Objective tests are subdivided in descriptive and discriminative sensory methods (Green, 2010; Huss, 1995).
Discriminative tests are applied in determining whether a difference exists between samples, while descriptive tests are utilized to determine the type and the intensity of the differences. The subjective test method is a test that is based on measurements of the preference or acceptance of the product by the consumer and they are especially important in market research studies (Huss, H. H, 1995).
2.2.1.1. Discriminative tests
Discriminative tests used in the sensory evaluation of fish include tests such as triangle and ranking tests. The triangle test is one of the most used tests in the sensory assessment of fish, it is implemented and described in ISO 4120:2004 (ISO, 2004). Triangle testes allow determining if a significant difference exists between two samples. Judges are given three coded samples, and are asked to determine which one differs from the other two (Huss, H. H, 1995).
In a ranking test, several samples are given to the panel of judges, and they are asked to organize them. Normally this test is quicker and is often applied in preliminary screening (Huss, H. H, 1995).
2.2.1.2. Descriptive tests
Descriptive tests used in the sensory evaluation of fish include methods such as structured scaling and profiling. Structured scaling provides the panel of judges with an actual scale, which presents several degrees of intensity. A few descriptive attributes are selected frequently centered on work from a fully trained descriptive panel. Descriptive words should be carefully selected, and the panel of judges trained so that they approve the used terms and objective terms are preferred and should be selected instead of subjective terms (Huss, H. H, 1995).
22
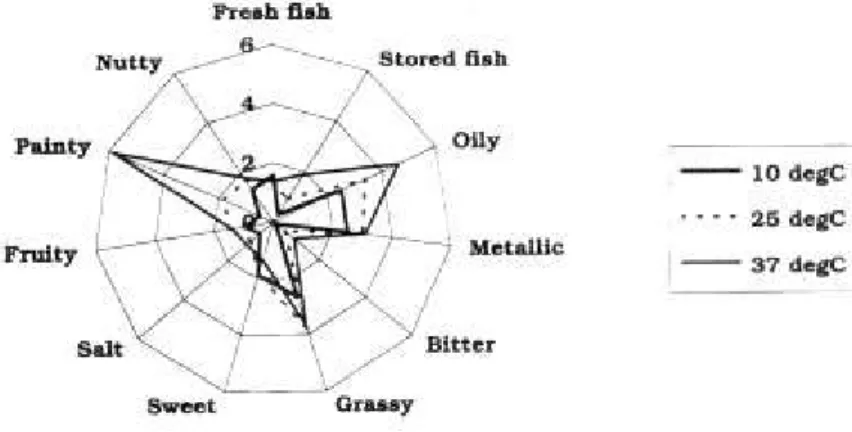
Profiling allows for a complete description of the product being assessed, and it is an excellent way to describe a product, using for example flavor profiling. Quantitative Descriptive Analysis (QDA) allows obtaining a detailed description of all flavor characteristics present in the product assessed in a qualitative and quantitative way. Judges are given a wide selection of reference samples and use the samples in order to define a terminology that accurately describes the product in question
The use of advanced multivariate analysis allows for a statistic analysis and allows to possibly correlate single attributes to a change in the sensory properties of a product. The results can be seen in a "spiders web", which is possible to see in Figure 2-2 (Huss, H. H, 1995).
Figure 2-2 Flavor profiles of several components of a fish oil (adapted from Huss, H. H. (1995)).
2.2.1.3. Scoring methods
During the last half of century several schemes for sensory assessment of fish have been developed. The first modern and detailed method is considered to be developed by Torry Research Station in the United Kingdom (Huss, H. H, 1995), while more recent methods include the European Union Scheme and the QIM method.
i) Torry Scale
The fundamental idea behind the development of the Torry scale was that each quality parameter can be considered independent of the other parameters. After the development of this method, the sensory analysis changed, starting to collect a group of distinctive features that would be expressed in a score (Huss, H. H, 1995).
23 Scores vary between 10 and 3. Scores under a 3 are considered needless, considering that at that point the fish is not fit for human consumption. An average score of 5.5 can be used to function as the limit for acceptability towards consumption. The spoilage attributes can be detected in both the thawed and the cooked fish and adequate scoring systems exist for both forms (Green, 2010).
ii) European Union Scheme
Nowadays in Europe, the method generally used for quality assessment is the EU scheme, which was introduced in the council decision No. 103/76 January 1976 (Huss, H. H, 1995; Official Journal of the European Communities, 1976). This method was updated in 1996, by the council regulation (EC) No. 2406/96, that established the EU scheme used by fish inspectors today (Green, 2010; Official Journal of the European Communities, 1996).
This scheme provides three quality levels: E (Extra), which is the highest quality; A, which is considered an acceptable quality; and B, which is the threshold level beyond which fish is not admitted for human consumption (Green, 2010).
There are still, however, some inconsistencies as this scheme does not take in account the differences between species only making use of general parameters, and mixes both subjective and objective sensory methods (Green, 2010; Huss, H. H, 1995).
Studies show that the more recent QIM scheme is more trustworthy in sensory assessment when compared to the EU grading scheme (Green, 2010).
iii) QIM Method
The QIM method was created and developed at the Tasmanian Food Research Unit (TFRU) of the Commonwealth Scientific and Industrial Research Organization (CSIRO), in Australia between the late 1970s and early 1980s. The QIM scheme answers some of the natural restrictions in the EU grading scheme (Green, 2010).
The implementation of QIM method is based on parameters such as accuracy, precision, and robustness within different user groups and also accounts for the ability to adapt to changing circumstances in order to meet future requirements. Its ease of
24
use, cost, and probability of adoption in several countries are other important characteristics (Green, 2010).
The QIM method does not measure quality itself or freshness but instead it measures the degree or rate of deterioration or change in the important criteria that are used to describe these qualities. The sum of these changes or deteriorations can then be construed into corresponding days of storage and remaining shelf-life (Green, 2010). Taking in consideration that all fish have their own characteristic spoilage patterns and sensory characteristics, QIM schemes are developed for individual species. Each characteristic is scored from 0 to 3 demerit points by assessors, with low scores indicating the best quality, and higher scores indicating a higher degree of deterioration. The description of how to asses each parameter is written in guidelines (Green, 2010; Huss, H. H, 1995).
The sum of all characteristics is called QIM index points. The value of the QIM index points increases linearly with the increase in storage time in ice of a given fish. Through the use of the QIM system, a linear relationship between the quality index (QI) and storage time on ice can be created, making it easier to gauge the remaining shelf-life of fish (Green, 2010).
2.2.2. Training of judges
Training of judges for sensory assessment is needed in almost all sensory methods. A laboratory panel must consist of 8 to 10 members, and the training and testing of panel members should be held regularly (Huss, H. H, 1995).
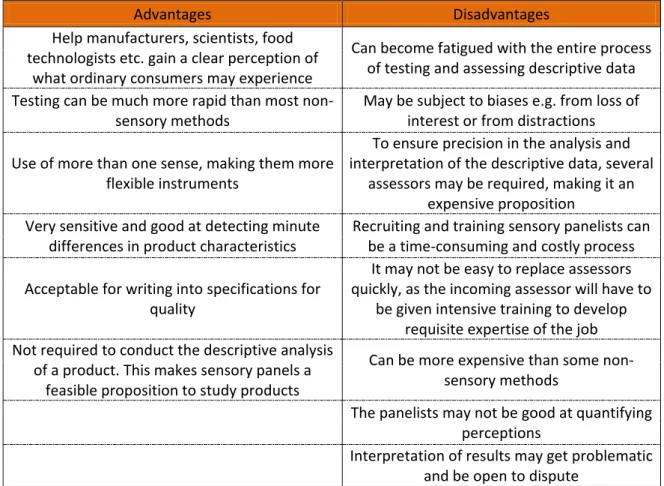
Some of the advantages and disadvantages of using a panel of judges for sensory assessment can be seen in Table 2-3 (CAMO Software AS, 2015).
25
Table 2-3 Advantages and disadvantages of using a panel of judges for sensory assessment (adapted from (CAMO
Software AS, 2015))
Advantages Disadvantages
Help manufacturers, scientists, food technologists etc. gain a clear perception of
what ordinary consumers may experience
Can become fatigued with the entire process of testing and assessing descriptive data Testing can be much more rapid than most
non-sensory methods May be subject to biases e.g. from loss of interest or from distractions Use of more than one sense, making them more
flexible instruments
To ensure precision in the analysis and interpretation of the descriptive data, several
assessors may be required, making it an expensive proposition
Very sensitive and good at detecting minute
differences in product characteristics Recruiting and training sensory panelists can be a time-consuming and costly process Acceptable for writing into specifications for
quality
It may not be easy to replace assessors quickly, as the incoming assessor will have to
be given intensive training to develop requisite expertise of the job Not required to conduct the descriptive analysis
of a product. This makes sensory panels a feasible proposition to study products
Can be more expensive than some non-sensory methods
The panelists may not be good at quantifying perceptions
Interpretation of results may get problematic and be open to dispute
27
Chapter 3. Edible Packaging
The quality of food product is dependent on the organoleptic, nutritional, and hygienic characteristics, but these change and evolve during storage time. Most of these changes are mainly related to interactions between foods and surrounding media, or migrations that can occur between the different components in a composite food (Debeaufort, Quezada-Gallo, & Voilley, 1998)
Several physical and chemical processes, such as sterilization or high pressure, have been developed in order to try to stabilize foods and thus allow to better preserve and maintain food quality. Nonetheless, the use of a performing package is needed in the ultimate step of the preservation process (Debeaufort et al., 1998).
3.1. Edible coatings and films
An edible coating or film can be defined as primary packaging prepared from edible components. In this type of packaging a thin layer of edible material can be directly applied to a food or formed into a film and used as a food wrap without altering the original ingredients or the processing method. Edible coatings and films can be used to improve gas and moisture barriers, as well as mechanical properties, sensory perceptions, and microbial protection while extending the shelf life of several products (Pascall & Lin, 2012).
Edible coatings and films can be produced using several biodegradable polymers, such as lipids, proteins, resins and polysaccharides, with or without the addition of plasticizers or surfactants (Pinheiro et al., 2010). They can be classified according to the components that they are made of, or also regarding the type of material from which they are derived. In the latter case they can be divided in three main categories, which can be seen in Figure 3-1 (Srinivasa & Tharanathan, 2007).
28
Figure 3-1 Types of biobased polymers used for biopackaging categorized by type of material from which they are
derived (adapted from (Srinivasa & Tharanathan, 2007)).
The three most used polymeric ingredients to produce edible films and coatings are polysaccharides, proteins, and lipids. It is also possible to combine two or all of these ingredients in order to produce composite edible films and coatings. Of these polymeric ingredients, chitosan, a polysaccharide, has the most interest for this study. Polysaccharide based edible films or coatings are hydrophilic and are able to have a good oxygen barrier however they present a poor moisture barrier (Pascall & Lin, 2012).
The production and the use of composite films should be done in a way that helps to minimize the disadvantages of the individual components, and at the same time takes advantage of the strength in their properties (Pascall & Lin, 2012).
The behaviour and functionality of edible coatings and films are highly dependable of their mechanical and transport properties. These properties are dependable of parameters such as the coating or film composition, their method of formation and application (Pinheiro et al., 2010).
Edible packaging has several properties that allow protecting products in different ways. Some of those properties are barrier, carrier and enhancement properties.