M
ESTRADO
ECONOMIA INTERNACIONAL E ESTUDOS EUROPEUS
T
RABALHO
F
INAL DE
M
ESTRADO
D
ISSERTAÇÃO
FINANCIAL
LITERACY,
FINANCIAL
BEHAVIOUR
AND
OVER-INDEBTEDNESS:
A
STUDY
OF
THE
FINANCIAL
CAPABILITY
SURVEY
IN
THE
UNITED
STATES
ELISABETE
MARIA
CRUZ
SANTOS
GROSSO
M
ESTRADO
ECONOMIA INTERNACIONAL E ESTUDOS EUROPEUS
T
RABALHO
F
INAL DE
M
ESTRADO
D
ISSERTAÇÃO
FINANCIAL
LITERACY,
FINANCIAL
BEHAVIOUR
AND
OVER-INDEBTEDNESS:
A
STUDY
OF
THE
FINANCIAL
CAPABILITY
SURVEY
IN
THE
UNITED
STATES
ELISABETE
MARIA
CRUZ
SANTOS
GROSSO
ORIENTAÇÃO:
PROFESSORA DOUTORA MARGARIDA ABREU
JÚRI:
PROFESSOR DOUTOR JOAQUIM RAMOS SILVA
PROFESSORA DOUTORA PAULA CRISTINA DE ALBUQUERQUE
PROFESSORA DOUTORA MARGARIDA ABREU
Abstract
This work analyses the impact of financial literacy and financial behaviour of individuals on the likelihood of over-indebtedness, controlling for socioeconomic factors, the type of mortgage and the event of a negative income shock. Using the data from the 2009 National Financial Capability Study of the United States, I consider three self-reported measures of over-indebtedness: financial distress, arrears and foreclosure. A financial literacy index is constructed using questions on the compounding of interest rate, inflation, bonds and stocks, mortgage payment and risk diversification. The financial behaviour index is based on questions concerning individuals’ financial choices related with budget management, savings, bank accounts, credit, insurance and financial advice. In addition to the impact of socioeconomic factors, I conclude that financial literacy is important for the prevention of over-indebtedness although financial behaviour emerges as having a stronger impact. I also find that individuals with an adjusted-rate mortgage and the individuals who have experienced a negative income shock are more likely to become over-indebted.
JEL Classification: C25, D12, D14
Resumo
Este trabalho analisa o impacto da literacia financeira e do comportamento financeiro dos indivíduos na prevenção de situações de sobre-endividamento, tendo em conta fatores socioeconómicos, o tipo de crédito hipotecário e a ocorrência de uma queda abrupta no rendimento. Utilizando os dados do inquérito à literacia financeira, conduzido nos EUA em 2009, são consideradas três medidas de sobre-endividamento: stress financeiro, atraso
no pagamento das prestações e execução hipotecária. Com base nas questões sobre juros compostos, inflação, obrigações e ações, reembolso do crédito e diversificação do risco é construído um índice de literacia financeira. Da mesma forma, o índice de comportamento financeiro baseia-se em questões sobre as escolhas financeiras dos indivíduos relacionadas com a gestão do orçamento, poupança, contas bancárias, crédito, seguros e aconselhamento financeiro. Para além do impacto de fatores socioeconómicos, concluo que a literacia financeira é importante para a prevenção do sobre-endividamento, embora o comportamento financeiro dos indivíduos tenha um impacto ainda mais forte. Concluo ainda que os indivíduos que detenham um crédito hipotecário com taxa de juro variável e os indivíduos que tenham sofrido uma forte queda no rendimento têm maior probabilidade de vir a tornar-se sobre-endividados.
JEL Classification: C25, D12, D14
Agradecimentos
Começo por agradecer à Professora Doutora Margarida Abreu que prontamente aceitou orientar-me neste trabalho. A sua disponibilidade e perspicácia foram um importante contributo para a concretização deste trabalho.
A realização deste trabalho contou ainda com o precioso apoio da minha família, amigos e colegas de trabalho.
Agradeço, em particular, à Rita Bessone Basto que, desde logo, me incentivou a abraçar o tema da literacia financeira e que acompanhou a realizaçao deste trabalho.
Agradeço também à Sara Areia, ao João Moleiro, à Inês Claro e ao Diogo Costa pelas revisões e comentários.
Contents
1 Introduction ... 8
2 Literature review ... 10
2.1 Financial literacy: concept and measurement ... 10
2.2 Over-indebtedness: concept and causes ... 14
2.3 Financial literacy and individual financial decisions ... 19
3 Data ... 23
3.1 State-by-state survey in the United States ... 23
3.2 Characteristics of the sample ... 24
4 Model and methodology ... 25
4.1 Financial literacy measure ... 25
4.2 Financial behaviour measure ... 28
4.3 Over-indebtedness measure ... 31
4.4 Econometric model ... 34
5 Results ... 36
5.1 Socioeconomic characteristics and type of mortgage ... 36
5.2 Negative income shock ... 38
5.3 Financial literacy ... 39
5.4 Financial behaviour ... 39
6 Conclusion ... 41
7 References ... 43
1 Introduction
In the aftermath of the financial crisis, financial literacy has been increasingly recognised as an important individual life skill and has gained prominence in both academic research and policy analysis. The unsustainability of social security systems in many industrialized countries implies a transfer of risk and responsibility from state to individuals in the provision of retirement and health care. The greater complexity of financial products hinders their evaluation and comparison by individuals at a time where their participation in financial markets is increased. In addition, the high expansion of credit preceding the outbreak of the crisis proved to be unsustainable for many people, mainly in the US mortgage credit segment, leading to excessive indebtedness. Currently, many individuals find themselves struggling to keep up with payments because of bad financial choices from taking out mortgages and revolving credit that they could not afford, with terms and conditions that were not fully understood, to spending beyond their means.
individuals. Therefore, I also analyse if the likelihood of becoming over-indebted is determined by individuals’ financial behaviour, assessed by the financial choices that individuals make in different contexts such as, saving for retirement, using credit cards or looking for advice.
I use the data from the National Financial Capability Study, carried out in the United States in 2009, to undertake my analysis. The survey was designed to shed light on the causes of the financial crisis looking at the financial capability of individuals measured in terms of how well people make ends meet, plan ahead, choose and manage financial products, and possess the skills and knowledge to make financial decisions. The survey also collected detailed data on socioeconomic characteristics of respondents. I use this rich set of questions to construct a financial literacy index and a financial behaviour index and to assess three levels of over-indebtedness: experiencing financial distress, being in arrears and being involved in a foreclosure procedure. I find that financial literacy positively contributes to the prevention of over-indebtedness. Furthermore, financial behaviour emerges as having a stronger impact than financial literacy on the likelihood of over-indebtedness and the results are statistically significant for the three measures.
2 Literature review
2.1 Financial literacy: concept and measurement
Measuring the financial literacy level of the population is important in order to identify potential needs and gaps, as well as identifying groups at risk. Yet, researchers and organizations have defined and measured financial literacy in many different ways. The most cited definition was introduced by Schagen (1997): “Financial literacy is the ability to make informed judgements and to take effective decisions regarding the use and
management of money. Financial literacy is therefore a combination of a person’s skills,
knowledge, attitudes and ultimately their behaviours in relation to money.” Since then many conceptualizations have arisen. Based on an extensive review of research studies, Remund (2010) suggest a conceptual definition for financial literacy as “a measure of the degree to which one understands key financial concepts and possesses the ability and
confidence to manage personal finances through appropriate, short-term decision-making
and sound, long-range financial planning, while mindful of life events and changing
economic conditions” (ibid. pp. 284). Building on the definition adopted by The President’s Advisory Council on Financial Literacy (PACFL (2008)), Hung et al. (2009) define financial literacy as follows: “knowledge of basic economic and financial concepts, as well as the ability to use that knowledge and other financial skills to manage financial
resources effectively for a lifetime of financial well-being” (ibid. page 12).
“financial education”1, Atkinson and Messy (2011) define financial literacy as “a combination of awareness, knowledge, skills, attitude and behaviours necessary to make
sound financial decisions and ultimately achieve individual financial well-being”. As a broader concept that also highlights action and behaviour of the individual, the United Kingdom, Canada and the United States have adopted the term “financial capability”2 which comprehend three areas: (1) knowledge and understanding, (2) skills, and (3) confidence and attitudes (Kempson, Collard and Moore (2005)). Actually, both concepts – financial literacy and financial capability – cover decision-making, practical skills and behaviour as well as knowledge and understanding (O'Connell (2007)).
In addition to theoretical concepts some research focus on operational definitions as they convert conceptual definitions into measurable criteria. Across studies, both performance tests (knowledge-based) and self-reported methods (perceived knowledge) have been employed to measure financial literacy (Huston, 2010). Without being exhaustive the following references provide examples of how financial literacy has been measured.
Hilgert, Hogarth and Beverly (2003) measured financial knowledge using a quiz containing 28 questions, covering budget management, credit, savings, investment, mortgages and a broad category of other financial topics3. The authors also assess
1 “Financial education is the process by which financial consumers/investors improve their understanding of financial
products and concepts and, through information, instruction and/or objective advice, develop the skills and confidence to become more aware of financial risks and opportunities, to make informed choices, to know where to go for help, and to take other effective actions to improve their financial well-being”.
2 Financial capability is also mentioned by Johnson and Sherraden (2007) as a broader concept that also considers the
relevance of outside institutions and regulations. Financial capability calls for individuals to develop financial knowledge and skills but also to gain access to financial instruments and institutions.
3 Financial knowledge score is calculated as a percentage of correct answers. Overall, households correctly answered
individuals’ financial behaviour using 18 financial-management questions. Moore (2003) adopted a similar approach using 12 financial questions4. Performing a factor analysis van Rooij, Lusardi and Alessie (2007) construct a basic financial literacy index (using 5 questions) and an advanced financial literacy index (using 11 questions)5. In a different approach, Abreu and Mendes (2010) consider three distinct aspects of financial literacy: specific financial knowledge about the financial market, educational level (used as a proxy for their ability to use gathered information) and the sources of background information commonly used. Financial literacy has also been widely measured using the three simple questions on compounding of interest rates, inflation and risk diversification originally designed by Lusardi and Mitchell (2006)6 for the U.S. Health and Retirement Study. These questions have been used as a benchmark allowing for comparison across studies7.
4 Financial knowledge score is calculated as the sum of the number of questions answered correctly. The financial score
ranges from zero to 12, with a mean score for all respondents of 8.04, corresponding to 67% of respondents giving correct answers.
5 The mean of correct answers is 3.94 for basic financial literacy and 5.93 for advance literacy. Details available in
Appendix A of the paper van Rooij, Lusardi and Alessie (2007).
6 The questions are: 1) Suppose you had $100 in a savings account and the interest rate was 2% per year. After 5 years,
how much do you think you would have in the account if you left the money to grow: more than $102, exactly $102, less than $102? 2) Imagine that the interest rate on your savings account was 1% per year and inflation was 2% per year. After 1 year, would you be able to buy more than, exactly the same as, or less than today with the money in this account? 3) Do you think that the following statement is true or false? “Buying a single company stock usually provides a safer return than a stock mutual fund.
7 These questions have been added to the US National Longitudinal Survey of Youth, the 2005 Dutch Household
It is worth noting that a handful of countries have so far collected data on financial literacy. The United Kingdom (FSA (2006)) was among the first to design a financial capability survey, in 2005, and similar initiatives have been undertaken in the United States (FINRA (2009)), New Zealand (ANZ-Retirement Commission (2009)), Australia (ANZ (2011)), Ireland (Keeney and O’Donnell (2009)), Canada (McKay (2011)), the Netherlands (van Rooij et al. (2009)) and Portugal (Banco de Portugal (2011)). Despite the rich set of information therein the different content and methodologies discourage international comparison which could provide a useful insight on the best practices. The lack of international comparison prompted the OECD and its International Network for Financial Education (INFE) to develop and implement a financial literacy questionnaire (Atkinson and Messy (2011), (2012)) which has been used in 14 countries8. Within this pilot study financial literacy is measured considering its three components: knowledge; behaviour and attitudes. Financial knowledge is tested using eight questions related with simple and compound interest, risk and return and inflation9. Financial behaviour is evaluated using several questions related with money management, saving, planning, choosing products and borrowing10. Financial attitude is assessed using questions
8 Of these, Armenia, Czech Republic, Estonia, Germany, Hungary, Ireland, Malaysia, Norway, Peru, Poland, South
Africa and the UK originally agreed to pilot the survey in late 2010. Albania and the British Virgin Islands used the questionnaire in 2011, following the agreed methodology.
9 Based on those questions a financial knowledge score is computed by adding up the number of correct answers and
range between zero and eight. The average financial knowledge score range from 4.6 in South Africa and 6.1 in Hungary.
10 For each question (or the combination of two questions) a value of 1 is given to answers that indicate a positive
focusing on attitudes towards money and planning for the future11. In order to assess overall levels of financial literacy the authors propose a financial literacy score that correspond to the sum of the scores for knowledge, behaviour and attitudes12.
In all different approaches there is a tendency to measure financial literacy through objective tests of financial concepts rather than by asking respondents to provide a self-assessment of their understanding of financial issues. In fact, when using both methods to assess financial literacy results show a discrepancy between what individuals believe they know and what they actually know, with the self-assessment often higher than the actual understanding (OECD (2005), Lusardi and Mitchell (2009)). The measured used in this study (detailed in chapter 4.1) also follows this approach as the questions used to construct the financial literacy index are aimed at evaluating objective knowledge.
2.2 Over-indebtedness: concept and causes
Contrary to conventional wisdom, consumer indebtedness is not, by itself, a bad thing since it allows people to pay for current expenses using future income. Indeed, the standard theoretical framework used to model consumption, saving and indebtedness decisions13 posits that consumers borrow against future earnings during their early working life when income is low and save during their most productive working years to provide for the decline in income after retirement. This theoretical framework is based on
11 The financial attitude score is computed by adding up the responses (in a qualitative scale from 1 to five) and then
dividing by three. The average combined score range from 3.7 (Albania and Peru) to 2.3 (Armenia).
12 The average financial literacy score range from 12.4 (Armenia, South Africa and Poland) to 15.1 (Malaysia, Hungary,
Germany and British Virgin Islands) and has a mean value of 13.7.
13 Life-Cycle theory developed by Modigliani and Brumberg (1954) and the Permanent Income Hypothesis by Friedman
a set of assumptions about the behaviour of the representative consumer and the institutional setting, such as the consumer being a rational and forward looking, and unrestricted access to credit.
However, substantial evidence suggests that households are not always fully rational when making financial decisions (Campbell (2006)) and that individuals suffer “exponential growth bias” (Stango and Zinman (2009)), that is the tendency to underestimate an interest rate given other loan terms and to underestimate a future value given other investment terms. Moreover, even in relatively simple formulations of the model, the consumer must be very knowledgeable to predict future labour earnings, pensions, social security, interest rates, inflation rates, mortality, and health shocks (Lusardi and Mitchell (2009)). Thus, individuals may make financial decisions that are not welfare maximizing, in particular related to debt, putting themselves at risk of experiencing financial difficulties.
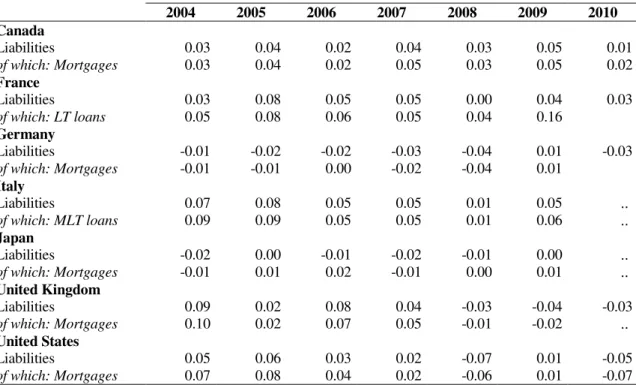
In fact, the growing levels of household’s debt across OECD countries have become increasingly worrisome. For the United Kingdom and the United States, data shows an increase in household debt (as a percentage of disposable income) until 2007, when the subprime crisis erupted in the United States (Figure 1). In particular, the mortgage debt (as a percentage of total household liabilities) increased in a faster pace than total liabilities (Table 1). These levels of indebtedness impose strains on household finances. Indeed, data from the Eurobarometer survey (conducted in December 2011)14 revealed that 18 per cent of the households reported they had run out of money to pay for essential goods and services at some stage during the last 12 months, and a similar proportion
(21%) expressed difficulties in keeping up with household bills and credit commitments. In the United States, in the 2009 Panel Survey of Consumer Finances15, 6 per cent of the households reported having been sixty or more days late on a required debt payment over the previous year.
Despite the concern with the excess levels of indebtedness there is no agreed definition of ‘over-indebtedness’, on how to measure it or on where to draw the line between normal and over-indebtedness (European Commission (2008) and Disney et al. (2008)). Many different data and indicators have been used by researchers to quantify or identify over-indebtedness situations. Those can be classified in two groups: aggregate measures to quantify the size of the phenomenon (e.g. debt-to-disposable income; debt servicing-to-disposable income, etc.) and individual measures to identify the socioeconomic profile of individuals in debt (individual’s ability to make ends meet; payment arrears, etc.) (Vandone (2009)).
Considering a structural and life-cycle-based approach the German Federal Ministry, cited by Haas (2006), defines over-indebtedness as follows: “A household is regarded to be over-indebted when its income, in spite of a reduction of the living standard, is
insufficient to discharge all payment obligations over a longer period of time” (ibid. page 4). In addition, Anderloni and Vandone (2010) affirm that “over-indebtedness is a phenomenon that occurs when an individual’s level of debt cannot be sustained in
relation to current earnings and any additional resources raised from the sale – at fair
conditions - of real or financial assets” (ibid. page 113).
In a cross-country study provided by Betti et al. (2007) a subjective approach has been adopted. Over-indebted households are identified as those that expressed difficulty or serious difficulty in making debt payments as recorded in household surveys. Conversely, Disney et al. (2008) consider that a criterion of ‘over-indebtedness’ based on current or prospective arrears is the most appropriate. Hence, an individual who has failed to meet a required payment on an outstanding credit commitment is deemed to be ‘over-indebted’. They further explain that self-reported problems are not always associated with specific adverse financial circumstances or evidence of arrears, but partly linked to perceptions and expectations of individuals.
Concerning the causes of over-indebtedness, literature (Banque de France (1996) and Vandone (2009)) typically identifies two types of over-indebtedness: “passive” and “active”. The first is due to the existence of exogenous factors such as job loss, divorce or separation, illness or macroeconomic shocks variables. These factors can eliminate or reduce an income source and thus impact repayment capacity. The second is caused by over-borrowing, following decisions of an individual to borrow up to a level that is unsustainable, in the belief of improved future economic and financial conditions. The distinction between active and passive over-indebtedness is not clear-cut as poor financial management skills and lack of basic financial knowledge lead individuals to under-estimate the probability of experiencing adverse shocks that strongly impact household income (Frade, Lopes, Jesus and Ferreira (2008)).
due to (i) over-borrowing – individuals do not understand the true cost of credit; (ii) under-insurance – individuals fails to adequately insure themselves against adverse events (e.g. unemployment, illness, etc.) and (iii) relative price shocks – individuals fail to adjust their consumption patterns following a reduction in real income. Income shocks are typically unforeseen and difficult to anticipate and might move individuals from a stable financial situation in which they are able to pay bills and meet credit commitments to one in which they fall in arrears. For the second group three principal sources of income shocks are identified: unemployment, divorce and illness. The final set accounts for macroeconomic shocks which includes interest rates changes (in particular, reflecting individual-specific changes in circumstances or repayment behaviour) and restrictions on credit, leading to tied refinance conditions.
Other studies relate over-indebtedness to specific socioeconomic characteristics, concluding that having children, being a single parent, being separated or divorced, having low income, being unemployed, living in rented accommodation and having a mortgage, increase the likelihood of over-indebtedness. Over-indebtedness has also been linked to gender, with men being less likely to experience arrears, and to age, with younger people being more at risk because they are less reluctant to use credit to finance their expenditure. Yet, empirical studies indicate that the increased probability of being over-indebted among young people is relatively small. Other factors like ill-health, ethnicity and personality traits also influence the probability of experiencing financial difficulties (European Commission (2008); Disney et al. (2008), Fondeville et al. (2010)).
2.3 Financial literacy and individual financial decisions
Even though the relation between financial literacy and financial behaviour deserves further investigation there are some evidences of correlation and causality between knowledge and behaviour in personal finance. Hilgert, Hogarth, and Beverly (2003) look at this connection for four financial areas – budget management, credit, savings, and investment – and find strong links between financial knowledge and financial practices. Atkinson and Messy (2012) also find a positive relationship between knowledge and behaviour – higher knowledge scores are associated with higher behaviour scores. Even though, no conclusive evidence is provided that financial literacy leads to sound individual financial decisions. Notwithstanding, Courchane and Zorn (2005) develop a three-step recursive model regression analysis linking financial knowledge to financial behaviour, and then linking financial behaviour to credit outcomes. The authors find that knowledge is a key explanatory variable for behaviour, while behaviour, in turn, is a significant determinant of credit outcomes, providing strong evidence that the causal connection runs from knowledge to behaviour.
The literature shows that basic knowledge is tied to more efficient financial behaviour such as planning and saving for retirement (Lusardi and Mitchell (2006), van Rooij et al. (2011)), accumulating wealth (Stango and Zinman (2009)), investing in the stock market (Christelis, Jappelli and Padula (2010), van Rooij et al. (2007)) and diversifying portfolio (Abreu and Mendes, (2010)).
to have costly mortgages since they don’t understand interest rates, loans or how loan works. Moreover, lower financial literacy explains the difference in mortgage experiences with lenders and the occurrence of engaging in loans with less beneficial or more financially harmful terms. Consistent with those findings the ‘Miles Review’ (Miles (2004)) revealed that borrowers have a poor understanding of mortgages and interest rates since many do not pay much attention to the likely level of future interest rates in choosing between variable and fixed rates and many pay overwhelming attention to the current variable interest rate.
Considering mortgage decisions, Campbell (2006) concludes that households choose between fixed rate mortgages (FRM) and adjustable rate mortgages (ARM)16 irrationally and that many households do not take advantage of beneficial mortgage refinance opportunities (e.g. in generally declining interest rates environment). Bucks and Pence (2008) find that borrowers with ARM are not aware of various aspects of their contract terms and tend to underestimate how much their interest rate can increase in one shot and over a lifetime. This lack is explained by difficulties in gathering and processing the information – either because these borrowers have lower cognitive abilities or lower levels of financial literacy. Additionally, Fornero, Monticone and Trucchi (2011) find that individuals with higher financial literacy are more likely to choose an FRM, which is interpreted as the effect of the greater awareness of more financially knowledgeable households of the income risk embedded in ARM.
16 With an ARM borrowers may benefit from a lower initial payment but are exposed to more risk because the mortgage
Despite the link between financial literacy and borrowing decisions much less research has been done on financial literacy and over-indebtedness. The paper of Lusardi and Tufano (2009) finds a significant association between debt literacy17 and self-assessed over-indebtedness: those with lower levels of debt literacy tend to judge their debt as excessive or report that they are unsure about the appropriateness of their debt position. Gathergood and Disney (2011) present new evidence for the United Kingdom on Lusardi and Tufano (2009) work and find that less financially literate households are more likely to report credit arrears or difficulty in paying their debts. Recent research also suggests that financial literacy reduces the probability of delays in mortgage payments (Fornero, Monticone and Trucchi (2011)) and leads to lower delinquency rates (Agarwal et al. (2010)). As well, using a sample of subprime borrowers, Gerardi et al. (2010) find a significant and quantitatively large association between numerical ability – one aspect of financial literacy – and mortgage delinquency. Moreover, using the data from the UK Financial Capability Survey, McCarthy (2011) examine the relationship between over-indebtedness and financial literacy, alongside with personal traits of individuals, and find that individuals with higher levels of financial literacy are less likely to experiences financial distress, either in less or more extreme forms such as running out of money and going into arrears. In the same way, Gathergood (2011) empirically examines how financial literacy relates to over-indebtedness using the data from UK DebtTrack survey18. The author considers three measures of over-indebtedness: i) one month
17 Debt literacy refers to the ability to make simple decisions regarding debt contracts and applying basic knowledge
about interest compounding to everyday financial choices.
18 The DebtTrack survey is a quarterly repeated cross-section survey of a representative sample of UK households
delinquency on at least one credit item; ii) three months delinquency on at least one credit item and iii) a self-reported measure of over-indebtedness; and concludes that individuals with higher financial literacy levels are less likely to experience over-indebtedness. However, the results suggest that financial literacy is not associated with more severe levels of debts and that self-reported measures may be a less reliable indicator of debt.
Financial literacy has also been referred as an important preventive measure that seeks to achieve more responsible borrowing19 by individuals and to prevent the causes of over-indebtedness (Vandone (2009) and European Commission (2008)). This is also the view of the OECD (2009) which considers that higher levels of financial literacy of individuals should contribute to prevent over-indebtedness bearing in mind that the promotion of financial literacy seeks to improve individuals’ knowledge, understanding, skills and confidence needed to adequately appraise credit options; to improve their capacity to take informed decisions and to look for financial advice if needed; and to develop money management and financial planning abilities, taking into account their possible future income and life cycle.
19 In accordance with the European Commission (2009) “Responsible lending means that credit products are appropriate
3 Data
3.1 State-by-state survey in the United States
The dataset consist of the National Financial Capability Study (FINRA, 2009) commissioned by the Financial Industry Regulatory Authority - Investor Education Foundation and conducted in consultation with the U.S. Treasury Department and the PACFL20. I use the state-by-state online survey which was fielded between June-October, 200921. The data was collected through an online survey of 28,146 respondents, aged 18 years or older, with approximately 500 interviewed in each of the 50 states plus the District of Columbia22.
The survey was design to shed light on the causes of the financial crisis looking at the financial capability of individuals measured in terms of how well people make ends meet, plan ahead, choose and manage financial products, and possess the skills and knowledge to make financial decisions.
The bulk of the survey questions are focused on eight financial topics. The first section covers habits and attitudes in managing household budget such as willingness to take risks, household spending relative to income, availability of a “rainy day” fund, saving for retirement or college education and whether a large drop in income was experienced in the past year. The second section addresses the use of financial counselling related to debt, savings and investment, insurance and tax planning. The third section is devoted
20 The study consists of three inter-linked surveys: (1) a national sample of 1,500 U.S. respondents; (2) a state-by-state
analysis of more than 28,000 respondents; and, (3) a survey of 800 military personnel and spouses.
21 Data retrieved from http://www.finrafoundation.org/programs/capability/index.htm in January, 2012.
primarily to banking and financial matters. The fourth section focuses on retirement accounts and pensions. The fifth section primarily asks questions about homeownership, mortgage, monthly mortgage payments, and any experiences with arrears or foreclosure. The sixth section focuses on credit cards and the seventh section addresses consumer loans. The eighth section covers insurance topics. The survey also comprises a final group of questions that were designed to probe the financial knowledge of the respondents.
The survey also includes a set of socioeconomic questions about gender, age, race, education, marital status, living arrangements, income, employment status, number of children, who in the household is most knowledgeable about savings, investing, and debt, and who in the household usually pays the bills.
3.2 Characteristics of the sample
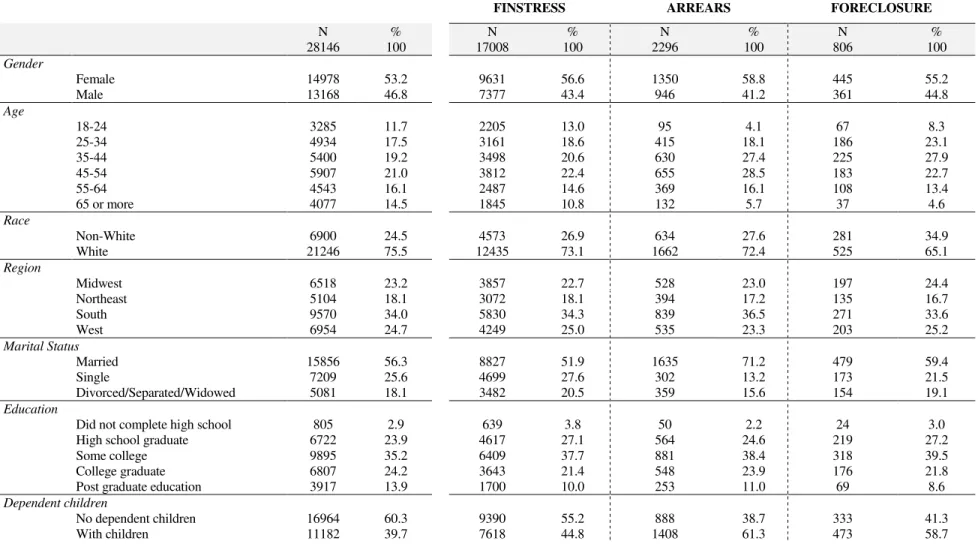
Summary statistics of the sample are provided in Table 2. The whole sample is comprised of 28,246 respondents. Most respondents are women (53%), with 45-54 years old (21%), white race (excluding Hispanic) (76%) living in the South region of the US (34%), married (56%) and without dependent children (60%). Almost half of respondents (48%) work for an employer and 19 per cent have an annual income that range between 50,000$ and 75,000$. As for education, most respondents attended some college (35%), 24 per cent are college graduate and only 3 per cent did not complete high school. Most respondents are married (56%) and have no dependent children (60%).
4 Model and methodology
The goal of my work is to identify the main factors that might drive individuals into over-indebtedness. I consider three measures of over-indebtedness: experiencing financial distress, being in arrears and being involved in a foreclosure procedure. A key area is whether the financial literacy level of individuals affects their ability to manage their finances with success and avoid financial difficulties. I understand financial literacy as financial knowledge which is consistent with the definition of financial literacy suggested by Hung et al (2009). Yet, according to most definitions, financial literacy goes beyond financial knowledge. Thus, I also analyse the impact of financial behaviour on the likelihood of becoming over-indebted. The methodology to quantify financial literacy, financial behaviour and over-indebtedness is described in the following sections.
4.1 Financial literacy measure
I use the set of five financial literacy questions comprised in the survey to evaluate the financial knowledge of individuals and to construct a measure of financial literacy. This approach is quiet common to the one adopted by Atkinson and Messy (2011). The wording of the question and answer options used in the survey is the following23:
(1) Suppose you had $100 in a savings account and the interest rate was 2% per year.
After 5 years how much do you think you would have in the account if you left the
money to grow: (a) more than $102*; (b) Exactly $102; (c) less than $102; (d)
don’t know; (e) prefer not to say.
(2) Imagine that the interest rate on your savings account was 1% per year and
inflation was 2% per year. After 1 year, how much would you be able to buy with
the money in the account? (a) more than today; (b) exactly the same; (c) less than
today*; (d) don’t know; (e) prefer not to say.
(3) If interest rates rise, what will typically happen to bond prices? (a) they will rise;
(b) they will fall*; (c) they will remain the same; (d) there is no relationship
between bond prices and the interest rate; (e) don’t know; (f) prefer not to say.
(4) A 15-year mortgage typically requires higher monthly payments than a 30-year
mortgage, but the total interest paid over the life of the loan will be less. (a) true*;
(b) false; (c) don’t know; (d) prefer not to say.
(5) Buying a single company’s stock usually provides a safer return than a stock
mutual fund. (a) true; (b) false*; (c) don’t know; (d) prefer not to say.
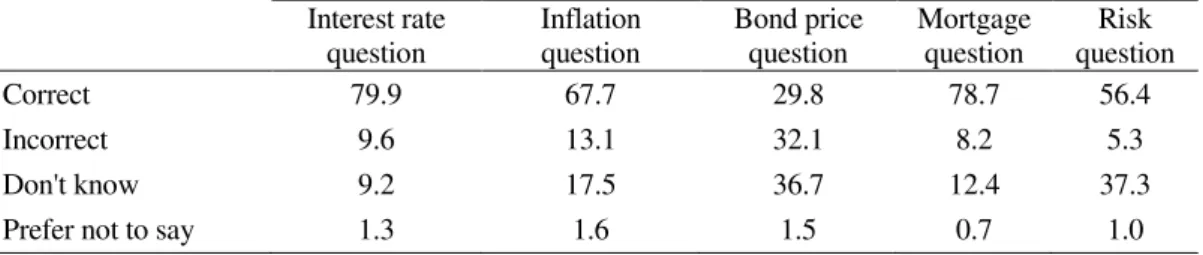
The first question measures numeracy, or the capacity to do a simple calculation of compounding interest rates. The second question assesses the understanding of inflation, in the context of a simple financial decision. The third question concerns the relationship between the price and yield of a fixed income asset; as it may be the most complex question of the set, it was designed to differentiate among levels of financial knowledge. The fourth question measures the understanding of mortgages and mortgage payments, an important question given the experience on subprime mortgages and the financial crisis. Finally, the fifth question gauges knowledge of risk diversification; it is intended to jointly test knowledge about “stocks” and “stock mutual funds,” and that of risk diversification.
worst performance is on the ‘bond price question’ where 32 per cent of respondents failed and 37 per cent admitted not knowing the answer, followed by the ‘risk question’, where 37 per cent of respondents also admit not knowing the answer (Figure 2). When considering all the questions (Table 4) only 17 per cent of respondents were able to answer all the questions correctly. On average respondents correctly answered 3 questions.
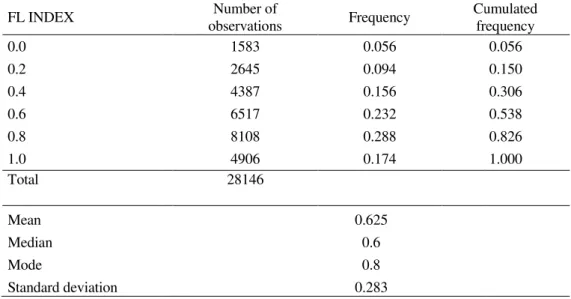
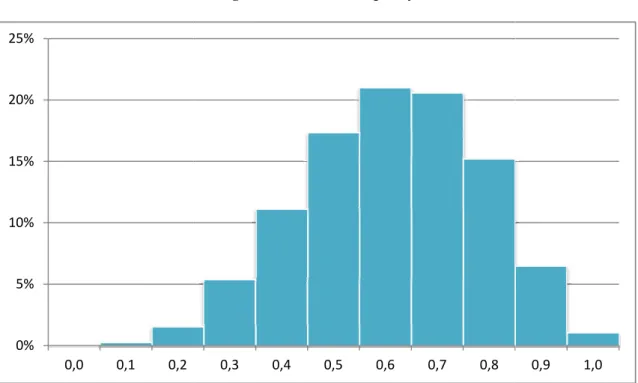
Based on this financial literacy quiz I construct a financial literacy index – “FL INDEX” – which is defined as the percentage of questions correctly answered. The “don’t know” and “prefer not to say” were categorized as wrong answers. The FL INDEX can take distinct values of 0, 0.2, 0.4, 0.6, 0.8 and 1 (Table 5). Consistent with the results above, the mean value of the FL INDEX across all respondents in the study is 0.625 which correspond to slightly more than 3 questions correctly answered on average. The median value is 0.6 and standard deviation is 0.283. As depicted in Figure 3, 29 per cent of respondents show a FL INDEX of 0.8 which corresponds to 4 correct answers.
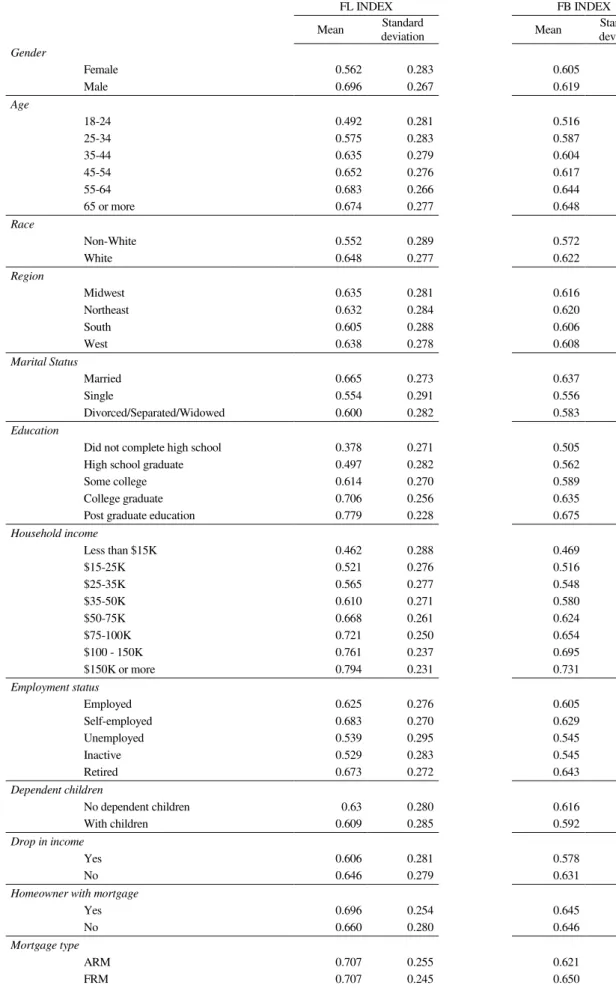
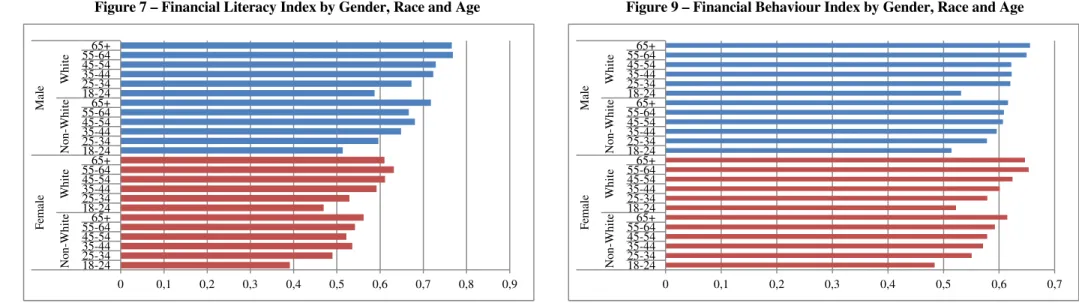
The FL INDEX varies quiet substantially across socioeconomic characteristics of respondents (Table 6). Financial literacy is lower among women, non-white and younger people (Figure 7). There is evidence of a positive relationship between income and education and financial literacy where higher income and education levels are associated with a higher FL INDEX (Figure 8). Unemployed and inactive24 respondents show lower levels of financial literacy than employed or retired respondents. Within the working class category, the self-employed show higher financial literacy levels. The respondents with a home mortgage have a higher FL INDEX than those without mortgage. There is however
no difference according to the type of mortgage (fixed-rate or adjustable-rate mortgage). As for the event of an unexpected financial shock, respondents that had a large drop in income in past 12 months have a lower level of financial literacy. This evidence is somewhat worrisome since financial skills are required for adequately deal with an unexpected reduction in income.
4.2 Financial behaviour measure
In order to measure financial behaviour I have selected eight questions from the survey that concern individuals’ financial choices in different contexts, namely related with budget management, savings, credit, insurance and financial advice. This approach has been recently used by Atkinson and Messy (2012). The wording of the question and answer choices is the following 25:
(1) Over the past year, would you say your household’s spending was less than, more
than, or about equal to your household’s income? (…) (a) spending less than
income*; (b) spending more than income; (c) spending about equal to income*;
(d) don’t know; (e) prefer not to say.
(2) Do you or your spouse/partner overdraw your checking account occasionally? (a)
yes; (b) No*; (d) don’t know; (e) prefer not to say.
(3) Have you ever tried to figure out how much you need to save for retirement?
(non-retired respondent) or before you (non-retired, did you try to figure out how much you
needed to save for retirement? (retired respondent). (a) yes*; (b) no; (d) don’t
know; (e) prefer not to say.
25 Answers that indicate a “positive financial behaviour” are noted by an asterisk. Respondents could indicate they did
(4) Have you set aside emergency or rainy day funds that would cover your expenses
for 3 months, in case of sickness, job loss, economic downturn, or other
emergencies: (a) yes*; b) no; (d) don’t know; (e) prefer not to say.
(5) In the past 12 months, which of the following describes your experience with
credit cards? I always paid my credit cards in full: (a) yes*; (b) no; (d) don’t
know; (e) prefer not to say.
(6) Please indicate if (…) in the past 5 years (…) you have taken out a short term
"payday" loan26? (a) Yes; (b) No*; (d) don’t know; (e) prefer not to say.
(7) Are you covered by health insurance? (a) yes*; (b) no; (d) don’t know; (e) prefer
not to say.
(8) In the last 5 years, have you asked for any advice from a financial professional
about i) savings or investments; ii) taking out a mortgage or a loan? (a) yes*; (b)
no; (d) don’t know; (e) prefer not to say.
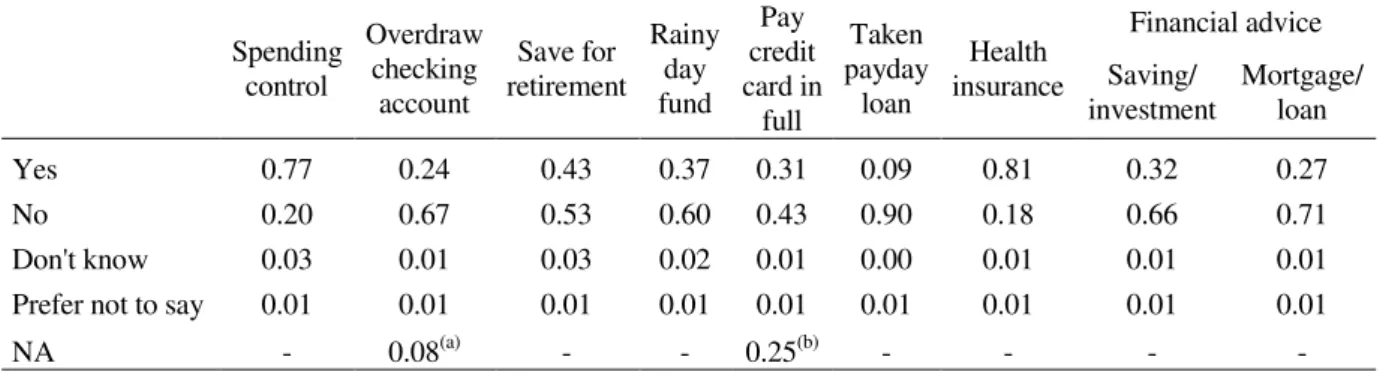
The responses to these questions are presented in Table 7. The first two questions analyse how individuals balance monthly income and expenses. One fifth of the respondents reported that their spending, in the past year, exceeded income (question 1) and nearly one-quarter (24%) reported overdrawing their checking account occasionally (question 2). Planning ahead is important for retirement preparedness or to make provisions to buffer against adverse shocks. Answers to the third questions show that more than half of the respondents (53%) had not tried to calculate how much they need to save for retirement. Additionally, 60 per cent of respondents have not set aside an emergency or ‘rainy day fund’ (question (4)). Concerning credit behaviour, 43 per cent of the respondents do not pay their credit card balance in full, which implies interest payment (question 5). As for the use of alternative forms of borrowing, such as taking a “payday loan”, 9 per cent of
26 “Payday” loans are small-dollar, short-term, unsecured loans that borrowers promise to repay out of their next
respondents have used this kind of high-cost borrowing method (question (6)). In relation to insurance coverage, 18 per cent of respondents reported not being covered by a health insurance (question 7). Finally, question 8 refers to financial counselling where most people assume not having asked for a professional advice neither on savings and investments (66%) or loan and mortgages (71%). As showed in Figure 6 respondents tend to behave worse concerning savings (for retirement and for an emergency fund) and the payment of credit cards balances. There is also a disregard in relation to financial advice.
Based on the questions above I construct a financial behaviour index – “FB INDEX” – by scoring the respondents answers. In the first question the answer “spending less than income” takes a value of 2, the answer “spending about equal to income “ takes a value of 1 and the answer “spending more than income “ is scored with zero. For questions (3), (4), (5), (7) e (8) a “yes” takes a value of 1 and a “no” is scored with zero. For questions (2) and (6) a “no” takes a value of 1 and a “yes” is scored with zero. For all questions the answers “don’t’ know” and “prefer not to say” were dropped and for question (2) and (5) the NA cases were also excluded. Only the respondents that answered all questions were considered, so overall 9,713 individuals were excluded from the total sample of 28,246 respondents.
The FB INDEX corresponds to the sum of points obtained in each question divided by ten and can take distinct values of 0, 0.1, 0.2, 0.3, 0.4, 0.5, 0.6, 0.7, 0.8, 0.9 and 1. The FB INDEX has a mean of 0.611 and standard deviation of 0.172. Both median and mode take a value of 0.6 (Table 8 and Figure 5).
There is also evidence of a positive relationship between financial behaviour and income and education where higher income and education levels are associated with a higher FB INDEX (Figure 10). The retired respondents show a higher FB INDEX, followed by those who are employed. There is no substantial difference on the FB INDEX between the respondents with and without a home mortgage. Still, those with a fixed-rate show a higher FB INDEX compare to those with an adjustable-rate mortgage. Lastly, those who experienced an unexpected drop in income exhibit a poorer financial behaviour.
4.3 Over-indebtedness measure
The survey includes questions designed to assess if an individual has experienced financial distress or more severe financial difficulties. Consistent with the over-indebtedness definitions reviewed in chapter 2, I have used different questions to outline three measures of over-indebtedness. Considering that an individual might be regarded as over-indebted when his income is insufficient to discharge all payment obligations (Haas (2006)) the first measure refers to the experience of financial distress and it is based on the responses to the following question:
(1) In a typical month, how difficult is it for you to cover your expenses and pay all
your bills? (a) very difficult*; (b) somewhat difficult*; (c) not at all difficult; (d)
don’t know; (e) prefer not to say.
(2) How many times have you been late with your mortgage payments in the last 2
years? (a) never; (b) once*; (c) more than once*; (d) don’t know; (e) prefer not to
say.
(3) Have you been involved in a foreclosure process on your home in the last 2 years?
(a) yes*; (b) no; (c) don’t know; (d) prefer not to say.
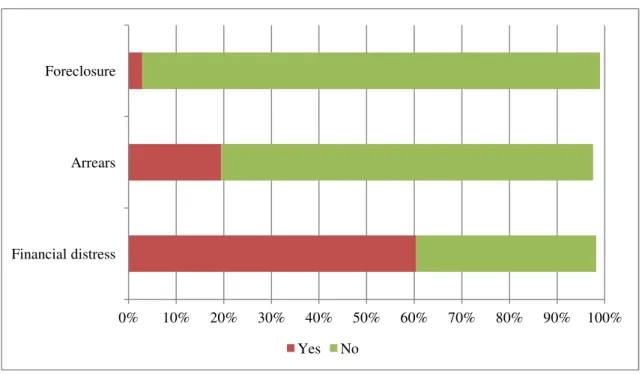
The responses to the above three questions are reported in Table 9. Most individuals (60%) expressed difficulty in covering monthly expenses and making debt payments and 17 per cent reported that it was very difficult to do so. In relation to mortgage payment, 19 per cent of borrowers reported having been late with their mortgage payments at least once in the last two years, and 12 per cent of respondents missed payments more than once. Overall, 3 per cent of respondents reported having been involved in a foreclosure process in the last two years27. As showed in Figure 6, financial distress is the most common situation across respondents, followed by the event of arrears (noting that only respondents with mortgage are considered) and the involvement in a foreclosure process.
Using the responses to question (1), I create a variable called “FINSTRESS” which is equal to one for respondents reporting difficulties in covering expenses and paying bills (very or somewhat difficult) and equal to zero for those who report no difficulties. The respondents that answered “don’t know” and “prefer not to say” were excluded. Next, I use the responses to question (2) and create a variable named “ARREARS” which is equal to one for respondents answering “once” or “more than once” and equal to zero for those who have never been late. The respondents with no mortgage and the “don’t know” and “prefer not to say” cases were excluded. Lastly, I use the responses to question (3) and create a variable called “FORECLOSURE” which is equal to one for all respondents
answering “yes” and equal to zero for those who said “no”. The “don’t know” and “prefer not to say” cases were excluded. A summary of statistics of the three over-indebtedness measures is presented in Table 10.
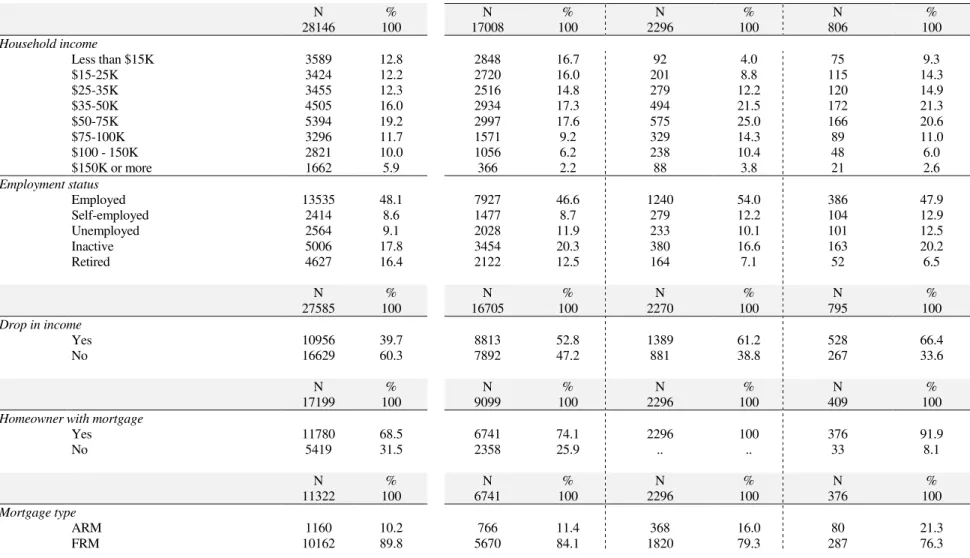
The over-indebted respondents have a similar socioeconomic profile (Table 2): white female from the South, married, who attended some college, employed (working for an employer in full-time or part-time) and with a fixed-rate mortgage. The respondents that have been involved in foreclosure procedure are on average younger than those who have experienced financial distress or those who have been in arrears. Most over-indebted respondents are middle-class (annual income between $35,000 and $75,000). Having children is also a differentiating factor where most respondents in financial distress do not have financially dependent children contrary to those in arrears or involved in a foreclosure process. Moreover, the typical over-indebted respondent has experienced a large drop in income.
4.4 Econometric model
Next I seek to model the relationship between financial literacy and financial behaviour and over-indebtedness controlling for socioeconomic characteristics of respondents, the type of mortgage and the event of a negative income shock. The variables considered (described in Table 12) are: gender; age (18-34, 35-54 and 55 years old or more); race (white or non-white), region (Midwest, Northeast, South and West); having children; marital status (divorce, separated, windowed or widower, married and single); education (college or no-college); income level (below $25,000, between $25,000 and $50,000, between $50,000 and $100,000; and more than $100,000); employment status (working for an employer in full-time or part-time; self-employed; unemployed; inactive - full-time student, homemaker, permanently sick, disabled, or unable to work - and retired). I also include the type of mortgage (adjustable rate or fixed rate mortgage) and the experience of a large drop in income.
Hence, I specify the following probit model28 for each over-indebtedness measure:
= 1| , , , = ′ + + + (Equation 1)
The dependent variable is the probability of a respondent being over-indebted taking a value of one (Yi=1) if the respondent i) is on financial distress; ii) has been in arrears and iii) has been involved in a foreclosure process; and zero otherwise. The endogenous
28Specifying a Linear Probability Model, estimated by OLS, would produce predicted probabilities that are less than zero
or greater than one. The common solution is to specify a logit or probit model, which constrains the estimated probabilities to be between zero and one. These models assume that there is a latent, unobserved variable y* determined
by y*= β0+X'β+ε , and assumes that y is one if y*> 0, and y is zero if ≤0. The error term ε are assumed to be independent
variable DI is a 1/0 dummy indicator variable for the event of drop in income, FL is the financial literacy index, FB is the financial behaviour index, X is a vector of control variables including socioeconomic variables and type of mortgage and F () is the cumulative distribution function of the standard normal distribution.
5 Results
The results of the probit estimation for each of the over-indebtedness measures are presented in Table 13, where the marginal effects for the probit regressions are reported29. The Wald chi2 test results and the Pseudo R2 are also shown. The probit regressions were re-estimated with robust standard errors given that the likelihood-ratio tests of
heteroskedasticity (LR test in Table 13) suggest the existence of heteroskedasticity.
5.1 Socioeconomic characteristics and type of mortgage
I begin by examining the role of socioeconomic characteristics and type of mortgage in the probability of over-indebtedness distinguishing between the experience of financial distress, being in arrears and getting involved in a foreclosure procedure. The results presented in columns (1) of Table 13 show, as expected, that men are less likely than women to become over-indebted although the results are not statistically significant for foreclosure. Surprisingly, respondents with 35-54 years old and 55 years old or more are 6 per cent more likely than the youngest to experience financial distress.
Respondents with 35-54 years old are also 2 per cent more likely of falling in arrears while results are not significant for respondents with 55 or more years old. The opposite happens with foreclosure where older respondents are 1 per cent less likely than the younger to experience a foreclosure process - it seems that the older people try harder to preserve their home. White race respondents are less likely than non-white (including
29 Probit estimations were computed in STATA. Marginal effects are reported instead of coefficients since those have
cases: respondents with an ARM are 10 per cent more likely to experience financial distress, 13 per cent more likely to fall in arrears and 3 per cent more likely to deal with foreclosure than respondents with an FRM. These results are not a surprise since individuals with ARM may have to deal with unexpected increases in mortgage instalments.
5.2 Negative income shock
The effects of a large drop in income in the past 12 months on the likelihood of over-indebtedness are reported in columns (2) of Table 13. As expected, a negative shock in income greatly increases the probability of over-indebtedness: respondents who had a drop in income are 30 per cent more likely to report financial distress, 14 per cent more likely to fall behind mortgage payments and 3 per cent more likely to deal with foreclosure.
5.3 Financial literacy
Financial literacy also matters for the prevention of over-indebtedness as shown by the results reported in columns (3) of Table 13. Controlling for socioeconomic factors, type of mortgage and the event of a negative income shock already discussed, I find it that the financial knowledge level of individuals, measured by the FL INDEX, substantially reduces the probability of over-indebtedness. The results show that financial literacy decreases the probability of experiencing financial distress by 11 per cent, decreases the probability of falling in arrears by 9 per cent and decreases the probability of getting involved in a foreclosure process by 2 per cent.
The introduction of the FL INDEX does not change the significance of variables30 and introduces only very minor changes in the parameters values, which is an indicator of the robustness of the model.
5.4 Financial behaviour
Finally, in columns (4) I assess the impact of having a positive financial behaviour on the incidence of over-indebtedness. Controlling for socioeconomic factors, type of mortgage, the event of a negative income shock and financial literacy, I find, as expected, that having a positive financial behaviour highly reduces the probability of over-indebtedness. The results show that a higher FB INDEX decreases the probability of getting involved in a foreclosure process by 4 per cent, decreases the probability of falling in arrears by 39 per cent and decreases the probability of experiencing financial distress by 95 per cent31.
30 Noting that male are now 1 per cent more likely than female to get involved in a foreclosure process.
31 The FB INDEX includes a question related with the spending behaviour of individuals where those who spend more
6 Conclusion
The growing number of over-indebted households has become increasingly worrisome, not only because of the implications for the individuals involved but also because of the impact of this phenomenon on the financial system and on the welfare of society as a whole. My work examines the main factors that drive people into over-indebtedness focusing on financial literacy and financial behaviour of individuals.
Using the data from the National Financial Capability Study carried out in the United States in 2009, I analyse the impact of financial literacy and financial behaviour on the likelihood of over-indebtedness. Based on the survey questions, I have defined three measures of over-indebtedness – financial distress, arrears and foreclosure -, and constructed a financial literacy index and a financial behaviour index. I conclude that experiencing financial distress is the most common situation followed by falling in arrears and the involvement in a foreclosure procedure, and that over-indebted individuals have typically lower financial literacy levels and poorer levels of financial behaviour.
Considering socioeconomic factors, I find it that male and younger people are less likely of experiencing financial distress and that male are less likely of being in arrears although male are more likely of getting involved in a foreclosure process. I show that people with children and lower income are more likely to become over-indebted as are individuals with an adjusted rate mortgage. Those results are robust when controlled for i) a large drop in income; ii) financial literacy and iii) financial behaviour.
becoming over-indebted. However, financial behaviour emerges as having a greater impact. This is an important result as individuals who engage in positive financial behaviours, such as spending less than income, set a ‘rainy day’ fund, use credit wisely and look for financial advice, are less likely to experience severe financial difficulties.
7 References
Abreu, M. and Mendes, V. (2010), “Financial literacy and portfolio diversification”,
Quantitative Finance, Volume 10, Issue 5.
Agarwal, S.; Amromin, G.; Ben-David, I.; Souphala, C. and Evanoff, D. (2010), “Learning to Cope: Voluntary Financial Education Programs and the Housing Crisis”, American Economic Review, American Economic Association, vol. 100(2), pages 495-500, May.
Anderloni, L. and Vandone, D. (2010),” Risk of overindebtedness and behavioural factors” in RISK TOLERANCE IN FINANCIAL DECISION MAKING, C. Lucarelli, G. Brighetti, eds., Palgrave Macmillan.
ANZ-Retirement Commission (2009), ”Financial Knowledge Survey”. Available at
http://www.financialliteracy.org.nz/sites/default/files/webfm/Research/r-fksurvey-2009.pdf
ANZ (2011), “Survey of Adult Financial Literacy in Australia”. Availabe at
http://www.anz.com/resources/f/9/f9fc9800493e8ac695c3d7fc8cff90cd/2011-Adult-Financial-Literacy-full.pdf.pdf?CACHEID=f9fc9800493e8ac695c3d7fc8cff90cd
Atkinson, A. and Messy, F-A. (2011), “Assessing Financial Literacy in 12 Countries - An OECD Pilot Exercise” Netspar Discussion Paper 01/2011-014.
Atkinson, A. and Messy, F-A. (2012), “Measuring financial literacy: Results of the OECD/International Network on Financial Education (INFE) Pilot Study”, OECD Working Papers on Finance, Insurance and Private Pensions, n.º 15, OECD Publishing.
Banco de Portugal (2011), “Survey on the Financial Literacy of the Portuguese Population (2010) – Final Report”.
Banque de France (1996), “Traitement du surrendettement: nouvelles perspectives”, bulltin 2 trimestre, Supplement Etudes.
Bucks, B. and Pence, K. (2008), “Do borrowers know their mortgage terms?”, Journal of Urban Economics, 64(2), 218-233.
Campbell, J. (2006), “Household Finance,” Journal of Finance 61, 1553-1604.
Christelis, D., Tullio J. and Padula, M. (2010), “Cognitive abilities and portfolio choice,”
European Economic Review 54, pp. 18-38.
Courchane, M. and Zorn, P. (2005), “Consumer Literacy & Credit Worthiness”, Prepared for Federal Reserve System’s Community Affairs Research Conference.
Disney, R., Bridges, S. and Gathergood, J. (2008), “Drivers of Over-indebtedness”. Centre for Policy Evaluation.
European Commission (2008), “Towards a Common Operational European Definition of Over-Indebtedness”, Report of the Directorate-General for Employment, Social Affairs and Equal Opportunities.
European Commission (2009), “Public Consultation on Responsible Lending and Borrowing in the EU”, Internal Market and Services DG.
FSA (2006) “Levels of Financial Capability in the UK: Results of a baseline survey”, Consumer Research 47.
FINRA (2009), “National Financial Capability Study”. Available at
http://www.finrafoundation.org/programs/capability/index.htm
Fondeville, N., Őzdemir, E. and Ward, T. (2010), “Over-indebtedness: New evidence
from the EU-SILC special module”, Research note n.º 4. European Commission, Directorate-General for Employment, Social Affairs and Equal Opportunities. Fornero, E., Monticone, C. and Trucchi, S. (2011), “The Effect of Financial Literacy on
Mortgage Choices” Netspar Discussion Paper No. 09/2011-085.
Friedman, M. (1957), “The Permanent Income Hypothesis”, in A THEORY OF THE CONSUMPTION FUNCTION, Princeton: Princeton University, ISBN: 0-691-04182-2, , pp. 20 - 37
Gathergood, J. (2011), “Self-Control, Financial Literacy and Consumer over-Indebtedness”. Journal of Economic Psychology, Volume 33, Issue 3, June 2012, pp. 590–602.
Gathergood, J. and Disney, R. (2011), “Financial Literacy and Indebtedness: New Evidence for UK Consumers“, Discussion Papers 11/05, University of Nottingham, Centre for Finance, Credit and Macroeconomics (CFCM).
Gerardi, K.; Goette, L. and Meier, S. (2010), “Financial Literacy and Subprime Mortgage Delinquency: Evidence from a Survey Matched to Administrative Data”, Federal Reserve Bank of Atlanta Working Paper Series n. 2010-10.
Haas, O. J. (2006) “Over-indebtedness in Germany”, Employment Section, Social Finance Program Working Paper n.º 44, International Labour Office.
Hilgert, M. A., Hogarth, J. and Beverly, S. (2003), “Household Financial Management: The Connection between Knowledge and Behavior,” Federal Reserve Bulletin, Board of Governors of the Federal Reserve System (U.S.), issue Jul, 309-322. Hung, A. Parker, A. M. and Yoong, J. (2009) “Defining and Measuring Financial
Literacy” RAND Working Paper Series WR-708.
Huston, S. J. (2010), “Measuring Financial Literacy”, Journal of Consumer Affairs, Vol. 44: n. º 2, pp. 296–316.
Johnson, E. and Sherraden, M. S. (2007),”From Financial Literacy to Financial Capability Among Youth”, Journal of Sociology and Social Welfare, volume XXXIV, n.3. Keeney, M. J. and O’Donnell, N. (2009), "Financial Capability: New Evidence for
Kempson, E., Collard, S. and Moore, N. (2005) “Measuring financial capability: an exploratory study”. Financial Services Authority, Consumer Research Report 37. Lusardi, A. and Mitchell, O. S. (2006), “Financial Literacy and Planning: Implications for
Retirement Wellbeing,” Working Paper, Pension Research Council, Wharton School, University of Pennsylvania.
Lusardi, A. and Mitchell, O. S. (2009), “How ordinary consumers make complex economic decisions: financial literacy and retirement readiness”, NBER Working Paper n.15350.
Lusardi, A. and Mitchell, O. S. (2011) “Financial Literacy around the World: An Overview” NBER Working Paper n.17107.
Lusardi, A. and Tufano, P. (2009), “Debt literacy, financial experiences and overindebtedness”, NBER Working Paper n.14808.
Mandell, L. and Klein, L. S. (2009) “The Impact of Financial Literacy Education on Subsequent Financial Behavior”, Journal of Financial Counseling and Planning
Volume 20, Issue 1.
McCarthy, Y. (2011), “Behavioural characteristics and financial distress”, European Central Bank Working Paper Series n. 1303.
McKay, S. (2011), “Understanding Financial Capability in Canada: Analysis of the Canadian Financial Capability Survey”. Research paper prepared for the Task Force on Financial Literacy, February 9, 2011
Miles, D. (2004), "The UK Mortgage Market: Taking a Longer-Term View". Final Report and Recommendations, HM Treasury ISBN: 1-84532-004-2.
Moore, D. (2003), “Survey of Financial Literacy in Washington State: Knowledge, Behavior, Attitudes, and Experiences” Commissioned by Washington State Department of Financial Institutions, Technical Report 03-39.
O'Connell, A. (2007), “Measuring the effectiveness of financial education”, mimeo prepared for the Commission for Financial Literacy and Retirement Income.
OECD (2005), “Improving Financial Literacy: Analysis of Issues and Policies”, ISBN 92-64-012567.
OECD (2009), “Financial Literacy and Consumer Protection: Overlooked Aspects of the Crisis”, OECD Recommendation on Good Practices on Financial Education and Awareness Relating to Credit.
PACFL (2008), “President’s Advisory Council on Financial Literacy: Annual Report to the President 2008”.
Remund, D. L. (2010), “Financial Literacy Explicated: The Case for a Clearer Definition in an Increasingly Complex Economy”. Journal of Consumer Affairs, 44(2), 276-295.
Schagen, S. (1997) “The Evaluation of NatWest Face 2 Face with Finance”, National Foundation for Educational Research (cited in ANZ (2011) “Survey of Adult Financial Literacy in Australia”).
Stango, V. and Zinman, J. (2009), “Exponential Growth Bias and Household Finance”.
Journal of Finance 64(6): 2807-2849.
StataCorp. (2009) Stata: Release 11. Statistical Software. College Station, TX: StataCorp LP.
van Rooij, M, Lusardi, A. and Alessie, R. (2009), “Financial Literacy and Retirement Planning in the Netherlands”, DNB Working Papers 231, Netherlands Central Bank, Research Department.
van Rooij, M., Lusardi, A. and Alessie, R. (2011), “Financial Literacy, Retirement Planning, and Household Wealth”, NBER Working Papers n.17339.
Vandone, D. (2009), CONSUMER CREDIT IN EUROPE: RISKS AND OPPORTUNITIES OF A DYNAMIC INDUSTRY, Springer-Verlag, ISBN 978-3-7908-2100-0.