IMPACT OF ENVIRONMENTAL CONDITIONS ON THE PERFORMANCE
OF OPEN MULTIDECK DISPLAY CASE EVAPORATORS
G. G. HEIDINGER
(a), S. M. NASCIMENTO
(b), P. D. GASPAR
(c)(a) (b)
EletrofrioRefrigeração Ltda, R João Chede, 1599, Cidade Industrial, Curitiba - PR, 81170-220, Brazil
+55 (41) 2105-6097, (a) [email protected], (b)[email protected]
(c)
University of Beira Interior, Engineering Faculty, Dept. of Electromechanical Engineering, Covilhã, 6201-001, Portugal
+351 275 329 972, (c)[email protected]
ABSTRACT
This paper reports the results of experimental tests performed according to ISO 23953 in an open multideck display case with dual air curtain in order to evaluate the impact of environmental conditions on the performance of its evaporator. Experimental laboratory tests were performed on two climate classes usually found in Brazilian food stores (n.º 3: 25ºC and 60% and n.º 6: 27ºC and 70%). In either test the maximum product temperature was maintained between 4 and 5°C. The experimental results comparison shows the quantitative variation of the frost formation rate on the evaporator coil (+37%) and how this phenomenon affects the distribution and magnitude of air flow, pressure drop, inlet and outlet temperatures and the components of the total sensible (+10%) and latent (+46%) heat loads. The analysis of experimental data provides valuable information to the evaporator design based on in-store environmental conditions.
1. INTRODUCTION
Knowing that 28% of the energy consumed in large supermarkets is attributed to compressors of refrigeration systems (ASHRAE, 2010), any study aiming to minimize this cost is of great value and importance. Concerning the refrigerated display cases, the energy consumption is strongly connected to the environmental conditions of the store in which they are placed. The higher the temperature and absolute humidity of the ambient air, the greater the sensible and latent heat loads which the cooling system must remove. The increase of air humidity in the refrigerated space increases the condensation rate and the frost formation on the heat exchanger, which in turn requires a greater frequency of daily defrosting. This condition increases the heat load due the need to recover the preservation temperature of food products after defrosting. Additionally, it promotes the temperature instability of the exposed products.
In general terms, refrigerated display cases are designed to operate in air-conditioned supermarkets. The international industry considers summer climatic conditions to be air temperature at 25ºC with 60% of relative humidity (ISO 23953:2005 climate class n.º 3). This climate condition is considered standard for homologation of this type of equipment (critical summer conditions). In Brazil, not all stores have air conditioning, and more adverse air temperature and humidity conditions frequently occur. Thus, in these situations, an air temperature of 27°C with 70% of relative humidity (ISO 23953:2005 climate class n.º 6) is usually considered. Tassou & Datta (1999), Gas Research Institute (2000), Gaspar et al. (2007) and Mousset & Libsig (2011) quantified the energy savings and improved performance in refrigerated display cases operating in environmental conditions which are less demanding than climate class n.º 3, mainly taking into consideration lower levels of air humidity which cause to a smaller rate of frost formation on the evaporators, and a subsequent reduction in the latent cooling load. Kosar & Dumitrescu (2005) conducted a review related with the influence of ambient air humidity on refrigerated display cases. After comparing the results of five authors, they concluded that a reduction of air humidity from 55% to 35% in a typical supermarket could save thousands of kWh in energy spent on anti-condensation systems, electrical defrosting and compressors. This information is of great importance to the present study, although no studies were found which quantified the performance of refrigerated display cases operating under severe operating conditions (Climate class n.º 6).
So, this article describes the experimental procedures for tests conducted on this climate class, and presents data suited for the design of heat exchangers, due to their relevant role in improving the performance of
refrigerated display cases operating in adverse climate conditions while always ensuring safe temperature levels of shelf products, as required by food safety standards.
2. EXPERIMENTAL PROCEDURE
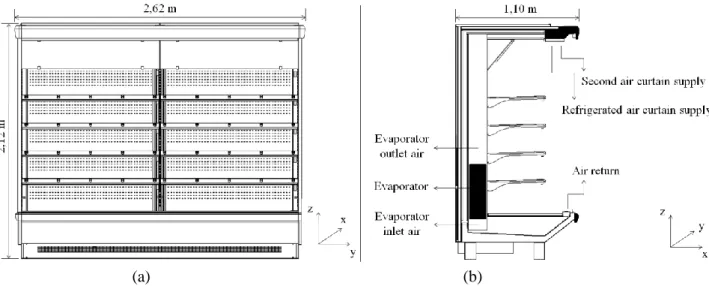
Tests were conducted in an environmental test chamber (Figure 1) constructed according to ISO 23953 (2005). The cooling equipment selected for the experiments is an open vertical refrigerated display case (1.10m×2.62m×2.12m) with a dual air curtain (Figure 2 and Figure 3) used for displaying meat products, which temperature should be maintained between -1 °C and 5 °C (ISO 23953-2:2005 class M1).
Figure 1 - Environmental test chamber.
(a) (b)
Figure 2 - Open vertical refrigerated display case with dual air curtain.
Each test period lasted 24 hours. Data acquisition related to air temperature, relative humidity, velocity and pressure drop was conducted at 1-minute intervals in order to analyse variations of these values over time. To measure physical parameters on the R22 refrigerant side, data was collected according to the recommendations provided by ISO 23953 (2005). To measure physical quantities on the air side, sensors were positioned at 5 equidistant points from the air inlet and outlet along the length (y) of the evaporator (Figure 2b). Thus, the evaporator was divided into 5 virtual control volumes (CV), so that air temperature, humidity and velocity in each CV are considered constants (Figure 3b). With this procedure, it was possible to determine the air distribution in the evaporator, and which zones are more or less likely to form frost.
The mass of water condensed during defrosting was manually collected and measured during each test period. The outlet mass flow of the liquid coolant which passed through the evaporator during each operating period was monitored by a Coriolis flow monitor.
The manufacturer of the refrigerated display case recommends, for ideal operation, the evaporation temperature to be -10 ºC, ensuring products temperature within the prescribed limited range between -1 ºC and 5 ºC. Initially, the refrigerated display case defrosts 10 times per day, and each defrost period lasts 12 minutes. The defrosting control system consists of stopping the cooling system while maintaining the fans in operation in order to defrost the ice on the evaporator surface by the passage of ambient-temperature air. For testing purposes, there is no controller limiting the compressor work, whether a thermostat that ceases its operation depending on temperature, or some other mechanism which turns off the compressor during the operating period. The compressor is only turned off when the defrosting process begins.
The climatic conditions of the room vary according to the climatic class desired for the test. In more pleasant climates, the product temperatures are lower, and in warmer and more humid climates, the product temperatures increase. In order to make a fair comparison, the maximum temperature of the warmest product was maintained between 4 ºC and 5 ºC regardless the climatic condition. It was possible to make this adjustment by simply increasing or decreasing the usable overheating of the refrigerant fluid. In this way, there was a reduction or increase in the required refrigerant flow, and a consequent reduction or increase in the heat capacity of the evaporator according to the needs of each climate class.
(a) (b) Figure 3 - Division of evaporator into virtual CVs.
3. MATHEMATICAL MODEL
The total heat load of the cooling system on the refrigerant liquid side, QTOT, is determined by calculating
the difference in enthalpies between inlet, i , and outlet, r,i i , and the mass flow of the liquid refrigerant, r,o m , r
as described in ISO 23953 (2005) and shown in eq. (1).
r,o r,i
rTOT m i i
Q (1)
In order to determine the total heat load and its components on the air side, the air flow rates and the condensation and freezing rates of water for each cooling cycle were determined. Considering uniform rates of outflow for each CV, and using the average values for velocity, Va, and density,a, of air in the inlet and
outlet areas of the evaporator of cross section, A, obtained by experimental sampling based on the principle of conservation of mass, the mass flow of air, m , was obtained by eq. (2). a
A V ρ
Using the average values of air temperature and relative humidity at the inlet and outlet areas of the evaporator, absolute humidity of the air in each of the situations was measured using psychrometric concepts, a,i and a,o, respectively. Thus, using eq. (3), the mass flow of condensed water is determined
for the period in which the refrigeration was turned on,mw,OP, and for the period in which the refrigeration was turned off, mw,DEF. The mass flow of water collected in experimental sampling during the defrosting period, mw,EXP, given by eq. (4) is the sum of the mass flow of ice formation on the evaporator during the operation period, m , and I mw,DEF. A small part of the mw,OP was drained without freezing. This mass flow,
DRAIN w, m , is determined by eq.(5).
a,i a,o
a w m m (3) DEF w, I EXP w, m m m (4) I OP w, DRAIN w, m m m (5)The components of heat load can be determined by eq. (6) to eq. (10), according to GAS Research Institute (2000).
a,i a,o
w,COND a,COLD Q m i i Q a (6) w w,OP w,COND m h Q (7)
DEW FREEZE
w p, I w,COLD m c T T Q (8) h m Qw,FREEZE I I (9)
T T
c m QI,COLD I p,I FREEZE I (10)The total, sensible and latent heat loads can be determined by eq. (11), eq. (12) and eq. (13), respectively.
I,COLD FREEZE w, w,COLD w,COND a,COLD TOT Q Q Q Q Q Q (11) FREEZE w, COND w, LAT Q Q Q (12) COLD I, COLD w, COLD a, SENS Q Q Q Q (13)
Correspondingly, two methods of determining the refrigeration heat load are obtained. The results of these two calculation methods are compared and discussed.
4. ANALYSIS AND DISCUSSION OF RESULTS
4.1 Air humidity, condensation and freezing of waterThe rates of condensation and freezing of water between the evaporator fins increase with the humidity of the ambient air where the refrigerated display case is operating. The aim of experimental study was to measure how representative is the increase of ambient air humidity and temperature on the rates of condensation and freezing during the entire operation and defrosting period. The experimental results obtained for the test conducted for climate classes n.º 3 and n.º 6 are shown in Table 1.
Table 1 - Absolute values for condensation and freezing of water in experimental tests on climate classes n.º 3 and n.º 6. Climate class mw,OP [kg/24h] DEF w, m [kg/24h] DRAIN w, m [kg/24h] I m [kg/24h] TOT w, m [kg/24h] n.º 3 45.7 3.3 2.8 42.9 49.0 n.º 6 66.4 5.5 7.5 58.9 71.9 Increase [%] 45 67 168 37 47 Comparing the experimental results of climate class n.º 3 and class n.º 6 shown in Table 1, it can be concluded that: (1) the total quantity of condensed water in the evaporator is 47% greater; (2) the quantity of water which solidifies between fins is 37% greater; and (3) the quantity of water which drains during the operating period is 168% greater. Such numbers prove the significant influence of climate conditions on the operation of evaporators regarding their frost formation. The following sections detail other aspects related to the evaporator performance.
4.2 Air distribution and pressure loss in the evaporator
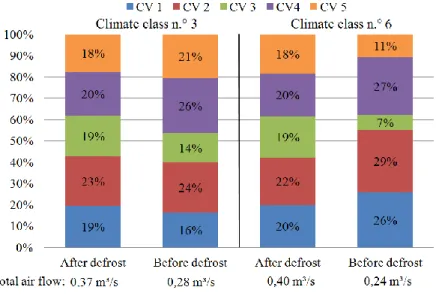
The distribution of airflow was evaluated at two separate times: when the evaporator was completely clean, i.e. after defrosting the coil and immediately before defrosting it. The percent distribution of airflow in the five virtual CVs of the evaporator is shown in Figure 4.
Figure 4 - Distribution of flow in the evaporator.
From the analysis of Figure 4, it is stated that after defrosting, airflow is equally distributed in each CV for both class n.º 3 and class n.º 6 (approximately 20% in each CV). CVs 2 and 4 are those possessing the greatest airflow circulating, and moreover, the greater velocity of air passing between fins. The lower quantity of airflow circulating in CVs 1 and 5 can be attributed to extremities effects (friction and consequently pressure drop) on the evaporator. The lower proportion of airflow circulating in CV 3 is attributed to the structural column which restricts the passage of air and restrains ideal formation of air plenum in the centre of the evaporator.
When the evaporator is ready to be defrosted, the percentage distribution of airflow is significantly different from the initial measurement. This fact is attributed to the irregular formation of frost. The airflow through CV 3 is less than the other CVs. It can be concluded that the frost is most likely to form in this region. For climate class n.º 6, the reduction is more significant, as before defrosting only 7% of the airflow circulating in the evaporator goes through this region, a quantity much lower than the initial measurement of 19%. This drastic reduction suggests that the frost formation grows significantly as a function of ambient air conditions. The increase in the percent airflow mainly in CVs 2 and 4 is due to these regions are less likely to form frost
and therefore, as the resistance to outflow is less, they become the preferred paths for air. During the cooling period, the total absolute airflow decreased 24% for climate class n.º 3 and 40% for climate class n.º 6. Figure 5 shows the air pressure drop variation before and after the fan bank. The air pressure drop is more significant for climate class n.º 6 and increases approximately 33% during the cooling period, while for class n.º 3 the increase is approximately 23%. These results prove that greater reduction of airflow in hot and humid environmental conditions as a consequence of greater frost formation which is responsible for a increase in resistance to air circulation between fins due to the decrease in free outflow area. The reduction in air velocity is the main factor in cooling capacity loss during the cooling period (Aljuwayhel et al., 2008).
Figure 5 - Air pressure drop variation before and after fans.
4.3 Influence of frost formation on air temperatures
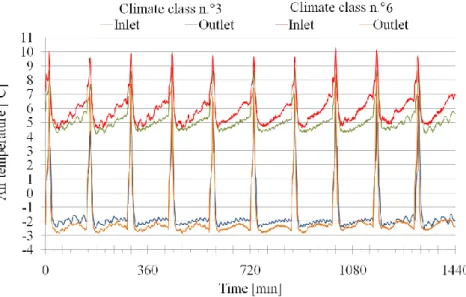
Figure 6 shows the variation of the temperature of air entering and leaving the evaporator for climate classes n.º 3 and n.º 6. The air temperature at the evaporator outlet is lower for class n.º 6. This is due to the different parametrizations needed to maintain the maximum temperature of test packages (product simulators) below the established 5 °C limit. Greater capacity to protect the refrigerated space is necessary when the climate is more adverse in order to maintain product temperatures.
Figure 6 - Air temperatures in the evaporator.
The circulating air temperature and the difference between the temperatures at the evaporator inlet and outlet increase as the defrost period nears. After defrosting, the air is colder, and the difference between the air at
the evaporator inlet and outlet is less than before defrost. Therefore, with the evaporator free from frost, the heat transfer efficiency is at his maximum level. When the surface of fins is covered with frost, the efficiency lowers. As frost forms over time, there is an increase in the difference between the temperature of air entering and leaving the evaporator due to the decreased airflow on the evaporator. This situation means a cooling capacity loss in the heat exchange due to reduced efficiency of the air curtain, which allows a greater quantity of external air to be taken in by the fans. As result, the temperature of the air entering the evaporator increases and consequently increases the rate of frost formation between fins. A substantial increase in the difference between air entering and leaving the evaporator is verified when the temperature and humidity of the surrounding environment are greater (climate class n.º 6). As the layer of frost formed is thicker, the resistance to heat transfer is increased, making the conduction/convection of heat between the fluids more difficult. Table 2 shows air temperatures values at two different times: before and after defrosting the coil.
Table 2 - Air temperatures in the evaporator.
Period Climate class n.º 3 Climate class n.º 6
i a, T Ta,o T Ta,i Ta,o T After defrosting 4.53 -2.17 6.70 4.92 -2.64 7.55 Before defrosting 5.50 -1.89 7.39 6.57 -2.44 9.01 Increase [%] 21 15 10 34 8 19 For climate class n.º 3, the difference in the temperature of air at the inlet and outlet of the evaporator increases 10 % and 19% over climate class n.º 6. Analysing the data in Figure 5 and Table 2, shows that the temperature of air leaving the evaporator, after reaching its highest value, starts reducing until the end of the operating period in climate class n.º 6, again proving the larger reduction in the circulating airflow.
4.4 Heat load
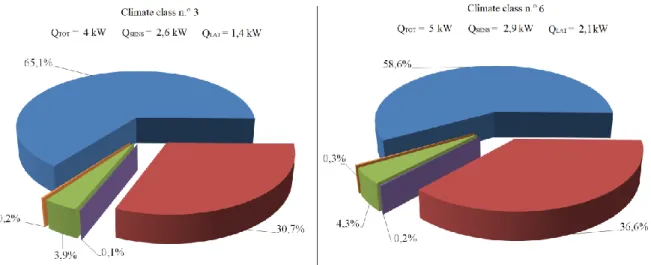
The total heat load and its components are shown in Figure 7.
Figure 7 - Heat load and its components.
The heat load of the equipment increased 25% from climate class n.º 3 to class n.º 6. In climate class n.º 3, the latent heat load (condensation and freezing of water) represents 34.6% of the total heat load, with the remaining 65.4% due to sensible heat of cooling the air, the water and frost. The latent heat due to freezing of ice represents only 3.9% of the total load and the sensible heat load due to cooling the water and ice represents only 0.3% of the total load. For climate class n.º 6, the latent heat load represents 40.9% of the total heat load, with the remaining 59.1% due to sensible heat of cooling the air, water and ice. The latent heat due to freezing the ice represents only 4.3% of the total load and the sensible heat load due to cooling water and ice represents only 0.5% of the total load.
5. CONCLUSIONS
This experimental study seeks to analyse the conditions of ambient air in the formation of frost on the surface of evaporators of refrigerated display cases. Experimental tests are designed for climate classes n.º 3 and n.º 6. The main conclusions of this study are: (1) the frost formation significantly affects the distribution of air in the evaporator due to its irregular formation in fins; (2) the quantity of air circulated in the display case is decreased over time due to the reduction of free area for air outflow and consequent increase of pressure drop; (3) the reduction in the evaporator's heat capacity during the operating period is mainly due to the reduction of airflow; (4) to maintain the same conditions for preserving products under different climatic conditions, it is necessary to change the temperature at which the air leaves the evaporator in such a way that the degree of protection offered by the air curtain can be controlled; (5) climatic conditions significantly influence the energy consumption of refrigeration equipments, since the total heat load increases as climatic conditions become more adverse, and the increase in latent heat load is greater than the increase in sensible load; (6) the heat loads due to the cooling of water and ice are not significant.
NOMENCLATURE
A area (m²) Subscripts
CV control volume a air
p
c heat specific to constant pressure (kJ/kg K) COLD cooling
h latent heat (kJ/kg) COND condensation
i specific enthalpy (kJ/kg) DEF defrosting
m mass flow (kg/s) DEW dew
Q heat load of cooling (kW) DRAIN drain
T temperature (°C) EXP experimental
V velocity (m/s) FREEZE freezing
absolute humidity (kgwater/kgair) i inlet
I ice
Greek symbols LAT latent
specific mass (kg/m³) o outlet
T
difference in temperature (°C) OP operation r refrigerant fluid SENS sensible
TOT total w water
REFERENCES
[1] ASHRAE 2010, ASHRAE Handbook: Refrigeration, American Society of Heating, Refrigerating and Air-Conditioning Engineers, Inc.
[2] ISO 23953-2 2005, "Refrigerated display cabinets - Part 2: Classification, requirements and test
conditions", International Organization for Standardization.
[3] Tassou S., Datta D. 1999, Influence of supermarket environmental parameters on the the frosting and defrosting of vertical multideck display cabinets, ASHRAE Transactions 105(1): 491-496.
[4] GAS Research Institute 2000, Investigation of relative humidity impacts on the performance and energy use of refrigerated display cases, Final Report.
[5]Gaspar, P., Pitarma, R., Gonçalves, L. 2007, Estudo experimental do impacto da variação das condições do ar ambiente no desempenho global de expositores refrigerados abertos, Engenharia 2007 – Inovação
e Desenvolvimento.
[6] Mousset, S., Libsig, M. 2011, Energy consumptions of display cabinets in supermarket, 23rd
International Congress of Refrigeration, ID:282.
[7] Kosar, D., Dumitrescu, O. 2005, Humidity Effects on Supermarket Refrigerated Case Energy Performance: A Database Review, ASHRAE Transactions 111(1): 1051-1060.