M
ESTRADO EM
F
INANÇAS
E
SPECIALIZAÇÃO EM MERCADOS FINANCEIROS
T
RABALHO
F
INAL DE
M
ESTRADO
D
ISSERTAÇÃO
Determinants of attitudes to risk in Europeans - An empirical
analysis based on Survey of Health, Ageing and Retirement in
Europe (SHARE)
S
ETEMBRO
-2012
M
ESTRADO EM
F
INANÇAS
E
SPECIALIZAÇÃO EM MERCADOS FINANCEIROS
T
RABALHO
F
INAL DE
M
ESTRADO
D
ISSERTAÇÃO
Determinants of attitudes to risk in Europeans - An empirical
analysis based on Survey of Health, Ageing and Retirement in
Europe (SHARE)
I
NÊS
M
ARGARIDA
P
EREIRA
M
ADEIRA
O
RIENTAÇÃO:
Professora Doutora Elsa Maria Nobre da Silva
Fontainha
i
Abstract
This dissertation investigates the determinants of attitude towards financial risk among older Europeans in the context of Household Finance. After reviewing the relevant literature, the determinants of attitude towards risk were tested empirically using micro data from the Survey of Health, Ageing and Retirement in Europe (SHARE) 2006/2007 of 14 countries (N = 17,587 observations of individuals between 50 and 86 years old). Several specifications were tested using Probit modeling, in which the dependent variable is a dichotomous variable representing the attitude about self-perceived financial risk (taking value 1 when individuals do not assume any financial risk in their investments and savings, and assuming the value 0 in all other cases). The results show that being female, having more children and feeling ill increase the probability of not assuming any financial risk. Moreover, the probability of a negative attitude towards financial risk decreases with: income and wealth, cognitive abilities, level of education, being an employee, the expectation of leaving an inheritance, degree of trust in others, and socialization. In addition, the differences found among countries suggest predictors that are linked to characteristics of each country’s institutional framework (e.g. national health services, social security systems or tax policies), culture and history.
Keywords: financial risk attitude; old people; Household Finance; Europe; SHARE.
JEL CODE: D14, D38, G32.
Resumo
Esta tese investiga os determinantes da atitude face ao risco financeiro dos idosos europeus no contexto da Household Finance. Após a análise da literatura relevante, foram testados empiricamente os determinantes da atitude em relação ao risco com base nos dados do Survey of Health, Ageing and Retirement in Europe (SHARE) 2006/2007 de 14 países (N=17.587 observações de indivíduos entre os 50 e os 86 anos). Várias especificações foram testadas usando a modelação Probit, em que a variável dicotómica dependente representa a atitude apercebida face ao risco financeiro assumindo valor 1 quando os indivíduos admitem não assumir nenhum risco financeiro nos seus investimentos e poupanças, e assumindo o valor 0 nos restantes casos. Os resultados obtidos mostram que ser mulher, ter mais filhos e sentir-se mais débil quanto à saúde aumentam a probabilidade de não assumir qualquer risco financeiro. Por outro lado, a probabilidade de atitude negativa face ao risco financeiro decresce com: o rendimento e a riqueza da família, as capacidades cognitivas, o nível de educação, a situação de empregado, a expectativa de deixar herança, o grau de confiança nos outros e a socialização. As diferenças encontradas entre países indiciam ainda preditores ligados a características institucionais (e.g. Sistema Nacional de Saúde, Segurança Social, políticas fiscais), cultura e história.
Palavras-chave: comportamento face ao risco financeiro; população idosa; Household Finance; Europa; SHARE.
ii Index Abstract ... i Resumo ... i Table Index ... ii Appendix Index ... ii Introduction ... 1
1. Household and individual risk attitudes: a brief review of literature ... 4
1.1. Measurement of risk attitudes ... 4
1.2. Relevant Determinants of risk attitudes in the literature ... 8
2. Database and Empirical Strategy ... 19
2.1. Database (SHARE) the presentation and modelling financial risk taking ... 19
2.2. Factors explaining the attitude to risk and variables ... 21
3. Results and Discussion ... 25
4. Conclusions and Future Research Avenues ... 32
References ... 35
Table Index Table I - Variables Description ... 22
Table II – Results from the different Probit regressions tested – marginal effects after Probit ... 27
Appendix Index A. Definitions of financial assets provided in the SHARE questionnaire………..…..38
B. Variables Description……….………..38
Table AI – Variables Description………..…...38
C. Correlations……….….44
Table AII – Correlations..………..…...44
D. Descriptive Statistics………....45
Table AIII – Sample Characteristics…..………..45
Table AIV – Descriptive Statistics..………. ...46
Figure A1 - Risk Attitude - No Financial Risk Taking by Age and Gender ……...48
Figure A2 - Risk Attitude - No Financial Risk Taking by Employment Status.…..48
Figure A3 - Risk Attitude –No Financial Risk Taking by Country……….49
Figure A4 – Risk Attitude – No Financial Risk Taking by Wealth deciles……….49
Figure A5 – Risk Attitude –No Financial Risk Taking by years of Education……50
iii
Abbreviations
BdP – Banco de Portugal
CMVM – Comissão do Mercado de Valores Mobiliários DFID – Department for International Development ELSA - English Longitudinal Study of Ageing EU – European Union
HRS – Health and Retirement Study
ISCED - International Standard Classification of Education ISP – Instituto de Seguros de Portugal
MiDIF – Markets in Financial Instruments Directive NHS – National Health System
OECD – Organisation for Economic Co-operation and Development SCF – Survey of Consumer Finance
SHARE – Survey of Health, Ageing and Retirement in Europe UK – United Kingdom
UNESCO - United Nations Educational, Scientific and Cultural Organization US – United States
Agradecimentos
Permito uma referência destacada à Professora Doutora Elsa Fontainha pelo seu apoio, persistência e rigor científico sem os quais este trabalho certamente seria de menor valia.
Um agradecimento especial à minha família e ao Pedro por todo o apoio demonstrado nesta fase.
1
Introduction
This dissertation identifies the factors that influence financial risk perceived by older Europeans in the context of Household Finance.
In a period of financial instability and population ageing it is essential for investors to have a solid knowledge of the financial markets to take investment decisions appropriate to their level of risk, in order to promote the efficiency and stability of financial markets (OECD, 2009). Over the next years significant changes are expected in the demographic structure. In 2060 the elderly (65 years or more) will represent 30% of the EU-27 population up from 17% in 2010, and the percentage of persons aged more than 80 years old will have tripled (Eurostat, 2011). This will be a challenge for social security systems and health services. It is also a challenge for researchers wishing to study this growing population segment and their attitudes concerning taking financial risks. Such studies are relevant to understand whether this group of population has adequate knowledge in order to plan retirement properly, given that there may be a reduction in benefits received by the elderly, an increased dependence on pension savings accounts and an increase in exposure to the equity market (Christelis Japelli and Padula, 2010; Laakso, 2011).
Most of the literature on Household Finance, a body of knowledge defined as the positive and normative study of how households use financial markets to achieve their objectives (Campbell, 2006), documents that many families do not hold any shares or other financial assets, not even indirectly through investment funds or pension savings accounts (Breuer, Riesener and Salzmann, 2012; Campbell, 2006; Christelis, Japelli and Padula, 2010; Guiso, Japelli and Haliassos, 2000). Haliassos (2008) refers to the existence of different levels of stockholding participation across Europe. Participation
2
strands around 60% in Sweden, 40% in the UK, but it is below 20% in France, Germany and Italy.
According to the Portfolio Theory with standard utility preferences, individuals invest in financial markets to win the risk premium (Guiso and Sodini, 2012), so one would expect that individuals would invest in the stock market in order to obtain higher returns, compared with lower risk investments. Related to this is the idea of the Equity Premium Puzzle, introduced by Mehra and Prescott (1985), who estimated that the historical U.S. equity premium stood at 6% on average in the past century. This high level of Equity Premium is a puzzle, because, according to the Portfolio Theory individuals should invest in the stock market, which would lead to a decrease in the risk premium over the years. These results, coupled with the fact that many families do not own any shares, reveal a negative behavior towards financial risk. This is of concern because, in the near future, individuals will need to plan for their retirement (Christelis Japelli and Padula, 2010; Laakso, 2011). This highlights the need to comprehend the underlying determinants of financial risk taking.
The literature on the behavior with regard to financial risk adopts several ways to evaluate risk behavior and proposes different explanatory factors (e.g. demographic, economic and psychological). Most studies focus on only one determinant or a restricted set of determinants, for example: the effects of income and wealth (Campbell, 2006; Breuer, Riesener and Salzmann, 2012; Bucciol and Miniaci, 2011), the level of education (Andersen et al., 2010; Campbell, 2006), age and life cycle (Andersen et al., 2010; Breuer, Riesener and Salzmann, 2012; Campbell, 2006; Dohmen et al., 2009; Jianakoplos and Bernasek, 2006), or gender (Andersen et al., 2010; Barber and Odean, 2001; Bucciol and Miniaci, 2011; Croson and Gneezy, 2009; Dohmen et al., 2009;
3
Jianakoplos and Bernasek, 1998). More recently, the availability of specific information enables the study of additional determinants of financial risk behavior: cognitive abilities (Atella, Brunetti and Maestas, 2012; Christelis, Japelli and Padula, 2010; Laakso, 2011; Mitchell, Lusardi and Curto, 2009), the level of trust (Christelis, Japelli and Padula, 2010; Guiso, Sapienza and Zingales, 2008; Laakso, 2011) and health status (Atella, Brunetti and Maestas, 2012; Christelis, Japelli and Padula, 2010; Jianakoplos and Bernasek, 2006; Laakso, 2011; Rosen and Wu, 2004).
This dissertation sheds more light on the explanation of risk behavior by combining determinants of a diverse nature. The empirical research is based on the Survey of Health, Ageing and Retirement in Europe (SHARE), second wave (2006/2007). This SHARE micro data includes detailed information on individuals aged over 50 years and their families. The dependent variable in the present study is based on the behavior with regard to financial risk perceived by the survey respondent and is collected through the following question in SHARE:
“When people invest their savings they can choose between assets that give low
return with little risk to lose money, for instance a bank account or a safe bond, or
assets with a high return but also a higher risk of losing, for instance stocks and
shares. Which of the statements on the card comes closest to the amount of financial risk that you are willing to take when you save or make investments?” The possible responds are:
a) Take substantial financial risks expecting to earn substantial returns
b) Take above average financial risks expecting to earn above average returns
c) Take average financial risks expecting to earn average returns
4
For analytical purposes in the empirical analysis a dichotomous variable is created, where the value one corresponds to respondents who "do not assume any financial risk"(option d) and the value zero corresponds to those assuming some level (average, above average and substantial) of financial risk (options a to c). Because the dependent variable is binary, Probit models are adopted and different specifications are tested. The dissertation is organized as follows. Section 1 provides a brief review of literature about household and individual risk attitude. It lists different ways of evaluating risk attitude, and presents the main determinants of attitude to risk. Section 2 describes the database, SHARE, and the methodologies used in the empirical analysis. Section 3 describes and discusses the empirical results. Finally, Section 4 presents the conclusions and indicates some avenues for future research.
1. Household and individual risk attitudes: a brief review of literature 1.1. Measurement of risk attitudes
Investment in financial market incorporates key aspects of behavior towards risk. The Standard Portfolio Theory, describes the choices maximizing household welfare (Breuer, Riesener and Salzmann, 2012, page 2), whereas the household investment is a trade-off between risk and expected returns. According to the axiom of decisions under uncertainty, families will opt for the asset portfolio that maximizes their expected utility. The standard expected utility framework introduced by von Neumann and Morgenstern (1944) establishes a direct relationship between the percentage of assets with risk, according to financial wealth, and preferences towards risk (Guiso and Sodini, 2012). These preferences towards risk are measured by the beliefs about risk assets, measured by the expected risk premium and the return volatility of risky assets, and the degree of risk aversion, defined by Arrow-Pratt (Guiso and Sodini, 2012). The literature
5
assumes that the "... beliefs about risky assets are the same for all investors" (Guiso and Sodini, 2012, page 26) which implies that the difference in the composition of household portfolios depends only on the degree of risk aversion. Most studies assume that all individuals have the same beliefs about risk assets (expected returns and volatilities) and the analysis is based on historical data.
The Standard Portfolio Theory suggests that the majority of households should invest in the stock market to earn the "Equity Premium", but the literature shows that the majority of the population does not invest, what constitutes the "Equity Premium Puzzle" (Mehra and Prescott, 1985). Related to this, there is global concern with the improvement of financial education and literacy. Some organizations are working to strengthen financial literacy, for example, the Organization for Economic Co-operation and Development (OECD), the UK Department for International Development (DFID) and the World Bank. This effort can also be seen in Portugal, where since November 2007, exists the Markets in Financial Instruments Directive (MiFID), which aims to provide greater protection to customers. It is also noted a greater commitment to financial education exemplified by the implementation of the National Plan Financial Services 2011-2015 (joint responsibility of the Banco de Portugal (BdP), the Securities Market Commission (CMVM) and the Instituto de Seguros de Portugal (ISP)) and the flourishing of various sites financial literacy oriented (Bank Customer Website by BdP). It is expected that the increase of information and financial literacy, will contribute to a higher opening to financial markets, leading to a change in behavior in relation to financial risk. It is then necessary to have a deeper understanding of the factors that determine the behavior in relation to risk. The empirical literature presents several methodologies for the explanation of behavior in relation to financial risk. The present
6
dissertation follows Guiso and Sodini (2012) emphasizing two approaches. One is the study of risk attitudes by financial "elicitation of risk preferences" of individuals, through direct inquiry and the other studies risk aversion based on "revealed preferences".
The study of financial risk assumed by an individual can be known by direct inquiry, through experience and / or responses to questionnaires and can use quantitative or qualitative indicators. Many authors such as Andersen et al. (2010), Croson and Gneezy (2009), Dohmen et al. (2009) and Hartog, Ferrer-i-Carbonell and Jonker (2002) use the experimental methodologies (from experimental economics). The analysis of questionnaires results is also used by several authors as Atella, Brunetti and Maestas (2012), Christelis, Japelli and Padula (2010), Jianakoplos and Bernasek (1998), Laakso (2011), Mitchell, Lusardi and Curto (2009) and Rosen and Wu (2004). This authors use several international surveys such as SHARE for European countries, the Health and Retirement Survey (HRS), for the United States and the British Longitudinal Survey of Ageing (ELSA), referring to England.
The attitude regarding financial risk can be measured in quantitative ways based on investment in equities and other risky assets - analyzing the percentage of risk assets in wealth (financial and / or total) and the probability of investing in this type of asset, allowing the estimation of the degree of Arrow-Pratt risk aversion . Followed by several authors as Atella, Brunetti and Maestas (2012), Bucciol and Miniaci (2011), Christelis, Japelli and Padula (2010) and Rosen and Wu (2004), this approach is also referred as the behavior towards observable risk.
Taking financial risk is also measurable in qualitative approaches, where the attitude towards risk is self-assessed by the individuals. It is used by authors such as Breuer,
7
Riesener and Salzmann (2012) and Dohmen et al. (2009). Some authors measure performance regarding financial risk, both in qualitative and quantitative terms. Is the case of Jianakoplos and Bernasek (2006) and Laakso (2011). The qualitative measurement is the one used in this dissertation, and it is also referred to as the behavior towards perceived risk.
Behavior towards perceived financial risk
Several authors have studied the importance of behavior in relation to financial risk in the context of Household Finance using qualitative measures. The majority of international economic questionnaires include questions to assess individual behavior in relation to financial risk, since this method has the advantage of having easy answer and is appropriate for large samples. One of the drawbacks of this measurement option, pointed out by Guiso and Sodini (2012), is that it does not allow the distinction between risk aversion and risk perception, by other words, if the degree of risk aversion perceived by an individual in fact corresponds to the degree of actual risk aversion, which influences the investments in risky assets. Another of the disadvantages mentioned is that it does not allow the estimation of the degree of Arrow-Pratt’ risk aversion. However, Dohmen et al. (2011) using qualitative and quantitative measures, show that all measures have predictive power about attitudes towards risk, and the qualitative information can be the best predictor.
Laakso (2011) introduces a qualitative measure (risk aversion) in the study of financial risk-taking and concludes that risk aversion has a direct effect on participation in the equity market, assuming that "... the main channel through which the different drivers of stock market participation operate is risk aversion" (Laakso, 2011, page 70). In this
8
way, the analysis of financial risk taking may be assessed by qualitative measures without loss of value of the findings on behavior towards financial markets.
1.2. Relevant Determinants of risk attitude in the literature
The literature suggests several determinants for the explanation of behavior towards risk and it is also often pointed out that transaction and information costs also have relevance in non-participation in the financial market, although the nature of these costs is not completely clear (Breuer, Riesener and Salzmann, 2012; Christelis, Japelli and Padula, 2010; Laakso, 2011). Below are presented the main determinants highlighted by recent literature.
Income and Wealth
The indicators of income and wealth are considered the most relevant in the study of the financial behavior of individuals, and it has been studied several times in the context of Household Finance. The theory suggests that the level of total wealth is an important determinant of portfolio composition since it can be used to finance consumption in retirement, serve as a buffer for health risks and other risks that the elderly face, or can be left as a legacy for future generations. (Christelis, Japelli and Padula, 2005). The concept of wealth is not a static concept, and authors use different notions of wealth. There are authors who focus on financial wealth and those who analyze total wealth, both real and financial, whether individual or of the household.
Breuer, Riesener and Salzmann (2012) report that most studies show the existence of a positive relationship between income and wealth and investment in assets with risk. Hartog, Ferrer-i-Carbonell and Jonker (2002) demonstrate the existence of a negative relationship between income and wealth and risk aversion. For Campbell (2006) and Rosen and Wu (2004) the likeliness to hold risk assets, regardless their class, tends to
9
increase with wealth and income. In addition, Christelis, Japelli and Padula (2010) concluded that financial wealth is strongly associated with direct investment in shares, suggesting that this may be due to the high fixed costs of transaction, which prevents poor investors from investing in stocks. They note that this effect is greater when analyzing the total investment in equities.
Jianakoplos and Bernasek (2006) studied the financial risk taken by both quantitative measures (ratio of risky assets to investment wealth) and qualitative (willingness to take financial risk). They show that wealth is positively correlated with financial risk-taking, both observable and perceived. They note that when other components of family wealth are included, as human capital and home ownership, the results are different for the diverse forms of financial risk. Laakso (2011) also reveals the existence of a positive relationship between wealth and equity investment (total, direct and indirect), as well as a negative relationship between wealth and risk aversion.
Cognitive Skills and Financial Literacy
Cognitive abilities (e.g. fluency, numeracy and memory) can also influence investment in shares and other financial assets, operating through several channels. The weakening of these skills may limit the ability of investors to gather and process information, which could increase the actual costs of processing information. Recent research shows that cognitive abilities are associated with certain aspects of preferences and risk aversion, which can reduce the financial risk taking (Christelis, Japelli and Padula, 2010).
According to OECD, financial literacy is the “knowledge and understanding of financial concepts, and the skills, motivation and confidence to apply such knowledge and understanding in order to make effective decisions across the range of financial
10
contexts, to improve the financial well-being of individuals and society, and to enable participation in economic life”. Therefore, it is clear that cognitive abilities are an integral part of the concept of financial literacy, and affect the equity investment (Mitchell, Lusardi and Curto, 2009). These authors studied literacy and financial sophistication on older individuals based on data collected by the HRS (2008). The issues studied were capital markets and risk diversification, numeracy, attitudes to investment and risk. They conclude that most of the population has no knowledge of the fundamentals of financial markets as stock and bond prices, risk diversification, portfolio choice, and investment fees.
Christelis, Japelli and Padula (2010) study how the lack of cognitive abilities may represent a barrier to investment in shares and help to explain the low participation in financial markets. They study the effect of cognitive abilities in taking financial risk using quantitative measures (investment in shares) using SHARE (2004). Cognitive abilities analyzed are numeracy, fluency and memory because they are considered as the most relevant abilities for the analysis of financial market participation. Results indicate that higher cognitive skills lead to greater participation in the equity market, both directly and indirectly.
Atella, Brunetti and Maestas (2012) inspired by the work of Christelis, Japelli and Padula (2010) also included an indicator for cognitive abilities in their study. The result was similar to that obtained by Christelis, Japelli and Padula (2010), however the effects are statistically significant only for numeracy and fluency and only in the countries where there isn´t a protective National Health System (NHS).
Laakso (2011) studied the causes of limited participation in the stock market performing several regressions with different forms of measurement, and found that the existence of
11
"good" cognitive skills reduces risk aversion and positively affects participation in the equity market.
Education
The effect of education in behavior towards the financial risk seems to be consensual in the literature. Education can influence behavior in several ways: increasing financial literacy and cognitive abilities (Mitchell, Lusardi and Curto, 2009), affecting the "literacy" on health (Atella, Brunetti and Maestas, 2012) or influencing the level of social activities (Christelis, Japelli and Padula, 2010).
Most studies show that taking financial observable risk is positively influenced by the level of education (Atella, Brunetti and Maestas, 2012; Campbell, 2006; Christelis, Japelli and Padula, 2010; Rosen and Wu, 2004). Campbell (2006) states that individuals with higher education are able to better understand the "trade-off" between risk and return in the markets, which leads to the reduction of transaction and information costs, considered as one of the greatest barriers to participation in the markets. Hartog, Ferrer-i-Carbonell and Jonker (2002) studied the relationship between risk aversion and personal characteristics, using three different databases in order to obtain consistent data. They emphasize that the level of education, particularly university education, significantly reduces the risk aversion. Laakso (2011) demonstrates a significant and positive effect of overall education on equity investment, finding also a negative relationship between the level of education and risk aversion, having the post-secondary education the greatest negative effect.
12
Age
A wide range of empirical literature has studied the effect of age and age cohort on behavior towards risk, but the results are divergent. Age can influence behavior towards risk in several ways, related to the investment horizon and risk of mortality. In the particular case of the elderly, they have an investment horizon much smaller than the rest of the population due to the high risk of mortality (Hurd, 2002, page 432), which can lead to a lower openness to financial risk, since they have a small margin of time to recover if they suffer significant losses. In general, economic behavior changes with age as shown by life cycle theories about consumption and saving.
It is important to study the elderly risk attitude, because the change in demographic structure but also because several studies show that this age group is the more risk averse (Campbell, 2006; Dohmen et al., 2005; Halek and Eisenhauer, 2001; Jianakoplos and Bernasek, 2006). Dohmen et al. (2009) studied the attitudes towards different kinds of risk, e.g. general risk, driving, financial, health and career and the results show a negative relationship between age and positive risk attitude in general, however they found a relatively small effect on financial risk.
Mitchell, Lusardi and Curto (2009) using US data from HRS conclude that older investors exhibit lower levels of financial sophistication and decreasing knowledge about risk diversification. Rosen and Wu (2004) also based on HRS (1998) combining with data from Survey of Consumer Finances (SCF) (1998), demonstrate that the probability of investing in assets of any kind increases with age.
Bucciol and Miniaci (2011) examined the risk tolerance and age. The results show that age is negatively correlated with risk tolerance, but only when considering the overall portfolio (besides financial assets are also considered human capital and real estate).
13
Jianakoplos and Bernasek (1998) in their study on financial risk-taking, with quantitative measures indicate that age has an impact quite different comparing single women with single men and couples, "regardless of age-cohort, single women tend to be more risk averse than comparable single men and married couples" (page 625). Jianakoplos and Bernasek (2006) focus on the attitude towards risk by age and age groups, studying financial risk measured quantitatively (ratio of risky assets to investment wealth) and qualitatively (willingness to take financial risk) based on data from the SCF (1989, 1995 and 2001). The results show that age leads to a decrease in financial risk taking, both perceived as observable. However, analysis by age group (cohort / generation) reveals that younger age groups take less financial risk than older age groups, it is stated that ".. Baby Boomers (born between 1946-1964) at age 50 are predicted to hold 83% of their investment wealth in risky assets, compared to 69% of the investment portfolios in risky assets held by members of Gen X (born between 1965-1983) at age 50 "(Jianakoplos and Bernasek, 2006, page 996). It is suggested that this may be related to the decline of Social Security Systems.
Some studies show that there is no relationship between age and behavior towards risk, as the works of Atella, Brunetti and Maestas (2012), Andersen et al., (2010), Dimmock and Kouwenberg (2010) and Laakso (2011). This may be connected with the limitation to certain segments of the population made by certain international questionnaires such as SHARE, thus comprising a part of the population that has a more homogenous behavior.
Gender and Marital Status
The issue of gender differences in financial risk-taking is very important because greater risk aversion may lead to decreased of the relative gains and wealth of women. It can
14
also have an impact on the resources available after retirement, more relevant for women because of their greater longevity. Most studies analyze the joint impact of marital status and gender.
Mitchell, Lusardi and Curto (2009) conclude that there is a gender difference in the level of financial sophistication, and women have less knowledge about the concepts of finance and investment. Hartog, Ferrer-i-Carbonell and Jonker (2002) estimate that women are more risk averse than men. Atella, Brunetti and Maestas (2012) estimated that families financially controlled by men and married individuals are, on average, more likely to hold assets with risk compared to those headed by women and unmarried individuals. Rosen and Wu (2004) also show similar results, with unmarried women to show less likeliness to hold assets with risk and retirement funds than single men, with no gender differences for other assets.
Christelis, Japelli and Padula (2010) study the behavior in relation to financial risk, both direct as indirect investment, and show that single women assume less risk. Jianakoplos and Bernasek (1998) focus on clearance of gender differences in financial risk taking, based on the allocation of total household wealth. They use Survey of Consumer Finance (1989), containing information about American families. They show that women are significantly more risk averse than men, with regard to financial decisions and that single women showed a relative risk aversion greater than unmarried men did. The same authors, in a later study (Jianakoplos and Bernasek, 2006) reveal that single women assume less risk. Laakso (2011) obtained convergent results. Barber and Odean (2001), Croson and Gneezy (2009) and Dohmen et al. (2009) also conclude that women are more risk averse than men. However Andersen et al. (2010) and Bucciol and Miniaci (2011) revealed that gender revealed no statistical significance in risk attitude.
15
In brief, the results of most studies analyzed converge indicating that single women are more risk averse and take less financial risk at both perceived as observable measure approaches.
Employment Status
Most of the literature shows that the fact that an individual is self-employed has a negative effect on risk aversion. This study, analyzing an aged segment of the population is also related with employment status. Hartog, Ferrer-i-Carbonell and Jonker (2002) estimated that being employed or self-employed significantly reduces risk aversion. Jianakoplos and Bernasek (1998) estimated that unmarried women in all categories of work take less financial risk than women who work as self-employed. In a later study, the same authors (Jianakoplos and Bernasek, 2006) have introduced several variables to capture the effects of labor supply flexibility and conclude that being self-employed leads individuals to assume greater financial risk, but it is only statistically significant in explaining the observable risk taking not the perceived risk. For Christelis, Japelli and Padula (2010) the professional status of individuals revels no statistically significancy in observable risk taking.
Children and Inheritance
The effect of family responsibilities, evaluated by the number of children in relation to financial risk behavior is closely connected with the effect of inheritance. Most families assume financial risk in order to leave some sort of legacy to their children, which can lead to an increased investment time horizon, encouraging greater risk taking. The results that emerged in the literature are not homogeneous.
Both the elderly as the young can leave a legacy, but "... for young the event of heritage is so remote that does not change the behavior" (Hurd, 2002). However, for the elderly
16
it can extend the investment horizon and positively affect the probability of investing in risk assets, or their aversion / to risk preference (Atella, Brunetti and Maestas, 2012; Hurd, 2002). This phenomenon interacts with indicators of age and health status.
Bertocchi, Brunetti and Torricelli (2011) estimate that the number of children has a positive effect on investment in assets with risk, possibly because having children increases the time horizon of families. Jianakoplos and Bernasek (1998) in their study include the number of dependent children in the household and conclude that as the number of dependents increases, the proportion of assets with risk held decreases significantly for single women, has no effect on single men and increases significantly in couples. Edwards (2008) note that the number of children is negatively associated with financial risk. Bucciol and Miniaci (2011) suggest that the number of children "present in the household" is not related to the attitude towards risk. Inheritance showed a strong positive correlation with taking observed financial risk in studies as Atella, Brunetti and Maestas (2012), Christelis, Japelli and Padula (2010) and Rosen and Wu (2004).
Trust and Socialization
The trust in others has been identified in the literature as a factor influencing economic decisions and portfolio choice of households (Guiso, Sapienza and Zingales, 2008; Laakso, 2011). The fact that individuals live in society involves several advantages and one is the "spill over" of information among individuals. Several authors argue that individuals become aware of investment opportunities in their social circle, and can predict that social interaction affects portfolio choices of individuals and their behavior towards risk (Christelis, Japelli and Padula, 2010, Guiso, Sapienza and Zingales, 2008; Laakso, 2011). Most studies analyzed show that both social activities as well as the
17
level of trust in others positively influence investment in shares, by other words the observable financial risk.
Guiso, Sapienza and Zingales (2008) conclude that individuals who rely on other people are more likely to invest in equities and invest a greater share of their total wealth in the stock market. Atella, Brunetti and Maestas (2012) show that social activities are associated with a greater investment in assets with risk, but this effect is only statistically significant in countries where there is a protective health system.
To Christelis, Japelli and Padula (2010) social activities and trust phenomena are difficult to distinguish empirically, focusing on the effect of social participation in the equity market. They demonstrate that there is a positive but small effect on the investment in equities. Laakso (2011) studies the effect of socialization and trust and investment in shares (total, direct and indirect) and risk aversion. Results show that social activities are relevant, while confidence does not appear significant in explaining direct investment in shares. However, the effect of trust in explaining risk aversion is statistically significant, showing a negative effect. It should also be noted that Laakso (2011) found a significant effect of trust "on risky stockholding conditional on stock market participation".
Health
Health issues can impose direct costs (health care) and indirect costs (reduction of income due to reduced labor productivity or supply). The health status can influence behavior towards risk, because individuals with high levels of health risk may be less willing to take financial risks (Rosen and Wu, 2004) and can influence investment in the financial market as a worse health status may lead to reduced investment because of the health costs (Edwards, 2008). The relationship between health status, investment
18
and financial market behavior is still influenced by the social security and health services in each country as studied by Atella, Brunetti and Maestas (2012).
Rosen and Wu (2004) studied the effect of health status on portfolio composition of American families, with data from the HRS and SCF for the year 1998 and demonstrate that households in poor health status are less likely to hold financial assets (all classes),
ceteris paribus, and that these families invest most of their financial wealth in safe
assets.
The work of Atella, Brunetti and Maestas (2012), focused on the importance of health status of individuals on the investment in risky assets, based on data from the SHARE project (2004). Studying the effect of the current state of health (at the date of the survey), they distinguished between objective health status (built through detailed medical examination provided by SHARE), perceived health status and the risk of future health status of individuals. The authors differentiate countries according to the National Health Systems. Conclude that, an individual in a country that has a good and protector Health Service has a "buffer" for taking some risks. Thus, it is expected that individual characteristics, such as health-related and age have less importance in the investment decisions in countries where there are good security and health systems. The empirical results show that the perceived state of health (at the date of the survey) and the risk of future health status are associated with the decision to invest, but only in countries where the welfare state framework is weaker.
Other authors like Jianakoplos and Bernasek (2006), Edwards (2008), Christelis, Japelli and Padula (2010) and Laakso (2011) obtained similar results, revealing that a poor health status has a negative effect in the financial risk taking.
19
Institutional framework that affects risk attitude integrates different "realities". For example financial market institutions and regulations, national and health service, social security, tax policy. Most studies present results by country and the institutional framework is implicit or explicit. There are contrasting differences in the development of financial markets in European countries that may affect the risk-taking of financial subjects. In general, in North and Central Europe the investment in risky assets is higher. According to Haliassos (2008) in Sweden, the UK, and the U.S. stockholding participation amounts to 40% of all households. Mitchell, Lusardi and Curto (2009) summarized the differences regarding risk attitudes between ethnic groups, demonstrating that knowledge of the stock market is quite low for African Americans and Hispanics.
2. Database and Empirical Strategy
2.1. Database (SHARE) presentation and modeling financial risk taking
This work is based on data collected by the Survey of Health, Ageing and Retirement in Europe (SHARE) in the second wave (2006/2007) originally including 34,415 individual observations. The SHARE project collects information on socioeconomic status, health status, social and family networks1. The original sample includes individuals aged over 50 years and their co-residents. SHARE closely follows previous surveys, including the Health and Retirement Study (HRS) in the United States, and English Longitudinal Study of Ageing (ELSA) (Börsch-Supan et al., 2005b). At the present SHARE is in the fourth wave (2010/2011), which includes Portuguese data (announced release: November 2012). In SHARE the questions are identical in
1
SHARE data, second wave, has 23 modules and 23 separated micro files which have to be matched. This present research analyzes 16 Modules: DN (Demographics), PH (Physical Health), BR (Behavioral Risks), CF (Cognitive Function), MH (Mental Health), HC (Health Care), EP (Employment and Pensions), CH (Children), FT (Financial Transfers), HO (Housing), HH (Household Income), CO (Consumption), AS (Assets), AC (Activities),EX (Expectations).
20
the first, second and fourth waves allowing international consistent comparisons (Christelis, Japelli and Padula, 2010; Laakso, 2011). The different modules of SHARE are not always answered by the agent observed, so, for greater reliability this dissertation selected observations that correspond to the answers given directly (SHARE, 2011a). So for each dwelling is considered only one person per household. This is essential since this work aims to study the behavior in relation to the perceived financial risk, which should be linked only to the individual who responds and not given to third parties. This selection, as well as others explained in section 2.2., reduces the original total sample size to N= 17,587 individuals. In this work, unlike Christelis, Japelli and Padula (2010) who input values to evaluate wealth, the work is with actual wealth based on the sum of the different forms.
The original microdata, including about a thousand variables, were filtered, processed and recoded, and more than an hundred variables were created, transformed or recoded. The empirical work uses mainly two software’s: IBM-SPSS v17.0 software and estimations with STATA v11.0.
Following Atella, Brunetti and Maestas (2012), Bertocchi, Brunetti and Torricelli (2011), Christelis, Japelli and Padula (2010), Rosen and Wu (2004), Laakso (2011), and since the dependent variable has a binary outcome (which assumes the value 1 if the respondent is not willing to take any financial risk and 0 otherwise) Probit models, with the following form, were adopted:
( | ) ( ) (1)
Where represents the full set of explanatory variables.
The model specification of the individual financial risk taking has the following form: (2)
21
Where represents the number of regressor’s considered in the analysis, using a Probit for estimating using maximum likelihood standard methods.
As the coefficients of the Probit regressions have indirect interpretation the results include the marginal effects "that estimates the marginal effects or elasticities at the means of the independent variables" (Cameron and Trevedi 2010). Marginal effects show the effect of "... a discrete change of the dummy variable from 0 to 1, or the effect of an infinitesimal change in the continuous variable "(Laakso, 2011, page 90).
The regressions results show both signs of partial effects of each (Regression (2)) on the response probability and the statistical significance of each , determined by rejecting the null hypothesis ( ) with significance level sufficient. The Pseudo-R2 for each of the estimated model is presented. The Pseudo-R2 (McFadden's) assesses model fitness, but it cannot be directly interpreted as R2 is. However, if comparing two models on the same data, Pseudo-R2 would be higher for the model with the greater likelihood.
2.2. Factors explaining the attitude to risk and variables
The selection of variables to include in explaining the attitude toward financial risk perceived is based on the most relevant determinants found in the literature previously presented. Table I describes the variables created, and in Appendix a table presents a detailed description of all indicators and issues related to the modeling process (See Table AI in Appendix B, and descriptive statistics in Table AIV, Appendix D).
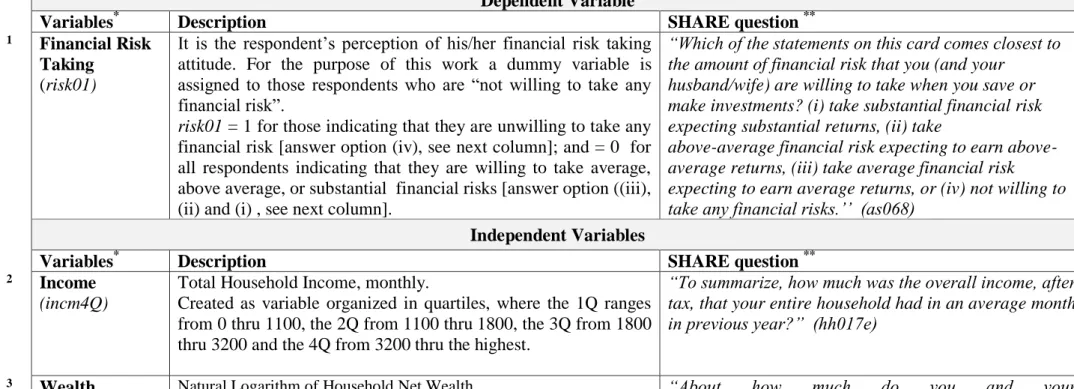
22 Dependent Variable Description
1 Financial Risk Taking
(risk01)
Independent Variable Description
2 Income (incm4Q) 3 Wealth (lnWealthL) 4 Cognitive Abilities (cgnabil) 5 Education (educ01) 6 Age (age), (age2) 7 Gender (fem) 8 Marital Status (mrrd) 9 Employment Status
(ret) =1 If the respondent is retired, 0 otherwise.
(emp) =1 If the respondent is employed or self-employed, 0 otherwise.
(unemp) =1 If the respondent is unemployed, 0 otherwise. (dsbld) =1 If the respondent is disabled or permanently sick, 0
otherwise.
(hmmkr) =1 If the respondent is a homemaker, 0 otherwise. (othr)
=1 If the respondent is in one of the following situations: Rentier, Living off own property, Student, Doing voluntary work and 0 otherwise.
10 Children (chld) 11 Bequest Motives ( inhr) 12 Trust (trst) 13 Social Activities (ssact345) 14 Health (hlth01_15)
15 Country Dummy variables for each the fourteen countries
analyzed by SHARE.
=1 if the respondent rates his/her health as “fair” or “poor”, 0 otherwise.
=1 If the respondent is a woman, 0 if is a man. =1 If the respondent is married, 0 otherwise
Number of children of the household
=1 if the respondent intends to leave a bequest, 0 otherwise.
=1 If the respondent trusts other people (classification above 5), 0 otherwise.
Sum of the three dummy variables for which of the social activities that correspond to “provided help to friends or neighbors”, “attended an educational or training course” and “gone to a sport, social or other kind of club”. This indicator has a minimum value of 0 and maximum of 3 if the individual attends to all of the social activities considered.
Respondent’s age, author's limitation to respondents between 50 and 86 years.
= 1 if the respondents are not willing to take any financial risk, 0 otherwise
Total Household Income by quartiles, where 1 (0 thru 1100), 2 (1100 thru 1800), 3 (1800 thru 3200) and 4 (3200 thru highest).
Natural Logarithm of the Household Net Wealth
Sum of the three dummy variables for each of the cognitive abilities: Numeracy (nmr01), Fluency (flc01) and Memory (mmr01). This indicator has the minimum of 0 and maximum of 3 (if the individual has high cognitive abilities in all domains)
=1 If the respondents have at least 9 years of education, 0 otherwise
Source: Author’s considerations based on the micro data of SHARE second wave Note a – for a more detailed description see Table AI in Appendix B
23
Dependent variable Behavior regarding the financial risk (risk01)
The key question of SHARE, which is studied as a dependent variable, allowing classification of individuals regarding to financial risk was presented in the Introdution.2
Attitude for Risk - Explanatory variables Income (inc4Q) and Wealth (lnWealthL)
The variable of total household income is the net monthly income of all members in household for the month preceding the survey. The individual income is not available (Paccagnella and Weber, 2005). The net wealth variable is a summary indicator of all the resources available to the family, in the year preceding the interview. It was computed by summing the values of seven categories that comprise the financial assets and four categories of real goods. (Christelis, Japelli and Padula, 2005). The extreme observations were eliminated from the sample representing 0.1% of the upper limit of the sample.
Cognitive Abilities (cgnabil)
To construct the indicator of cognitive abilities3 are used three types of abilities: the ability to perform numerical operations (4 questions on numeracy), verbal fluency (1
2
"When people invest their savings they can choose between assets that give low return with little risk to lose money,
for instance a bank account or a safe bond, or assets with a high return but also a higher risk of losing, for instance stocks and shares. Which of the statements on the card comes closest to the amount of financial risk you are willing to take when you save or make investments? "The answer options are: a) Take substantial financial risks expecting to earn substantial returns b) Take above average financial risks expecting to earn above average returns c) Take average financial risks expecting to earn average returns; d) Not willing to take any financial risks” in SHARE
questionnaire
3
SHARE has a module dedicated to cognitive tests (orientation, memory, verbal fluency and numeracy) and a self-assessment of reading and writing skills (Börsch-Supan et al., 2005b) focusing the present research on cognitive indicators that influence financial decisions, and consequently the behavior regarding risk.
24
question about fluency) and memory (1 question on memory), based on the work of Christelis, Japelli and Padula (2010).
Education (educ01)
SHARE adopts ISCED-97 classification for Education. Since educational systems differ among countries the quantification of education was based on years of education. Following Atella, Brunetti and Maestas (2012) a dichotomous variable was created (with less of 9 years = 0 and 1 otherwise).
Age (age and age2)
Based on the observed distribution and the procedures adopted by Atella, Brunetti and Maestas (2012) the age group selected is between 50 and 86 years. With this selection, 3.1% for the lower limit of the sample and 2% of the upper limit were lost.
Inheritance (inhr)
Binary variable corresponding to respondents intending to leave (probability greater than or equal to 50%) an inheritance equal to or greater than € 50,000.
Social Activities (ssact345)
This variable is based on three of the seven responses related to social activities in which individuals participated in the month prior to interview. For the construction of this variable were only considered three activities (ssact3, ssact4 and ssact5).
Health (hlth01_15)
For this study it is considered the subjective indicator, because if individuals take less risk due to health problems is the perception of these problems (not necessarily their
25
existence) that may affect financial decision. A vast literature confirms the validity of this indicator as a measure of health status indicator.(Atella, Brunetti and Maestas, 2012; Christelis, Japelli and Padula, 2010, Edwards, 2008; Jianakoplos and Bernasek, 2006; Laakso, 2011; Rosen and Wu, 2004).
Thus the final model takes the form:
(3)
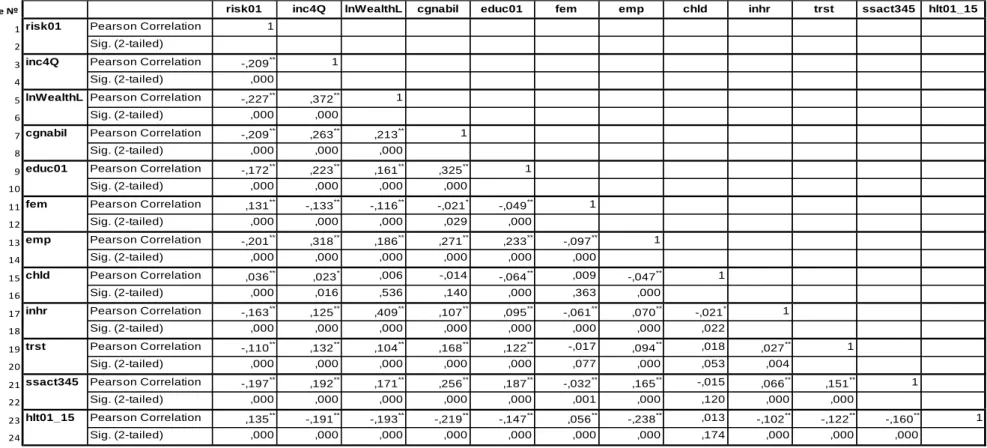
3. Results and Discussion Descriptive Statistics and Correlations
Table AII, in Appendix C, presents the Pearson’s correlation coefficient and shows that the financial risk taking (risk01) has a positive linear correlation with the gender indicator (fem), the number of children (chld) and the health status indicator (hlt01_15) and a negative linear correlation with all the others indicators, as income (inc4Q), wealth (lnWealthL), cognitive abilities (cgnabil), years of education (educ01), being employed (emp), the probability of leaving a bequest (inhr), the level of trust in people
(trst) and the socialization (ssact345).
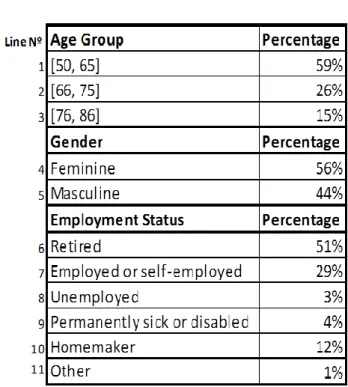
The Table AIII in Appendix D, shows the general characteristics of the sample, noting that most of the respondents are aged between 50 and 65 years. The distribution (not shown) is relatively homogeneous across countries.
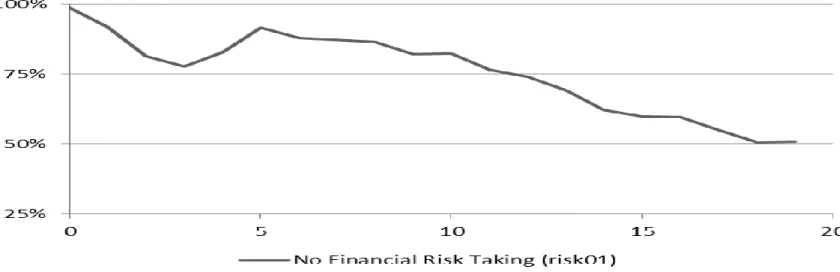
The mean distribution of negative attitude toward financial risk by gender and age (Figure A1 in Appendix D) shows that for all ages analyzed, the women take less (on
26
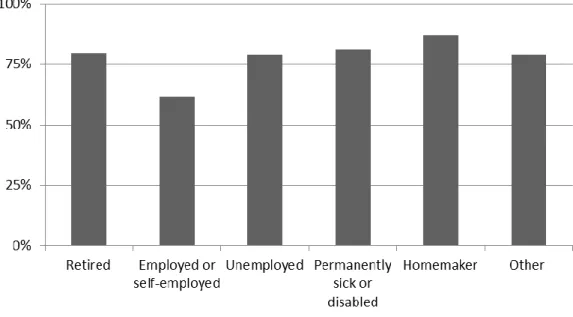
average) financial risk than the men do. Regarding the relation between employment status (Figure A2 in Appendix D) and risk, homemakers (87%) take on average less financial risk than other respondents do. Sixthy percent of employed respondents do not
assume any financial risk.
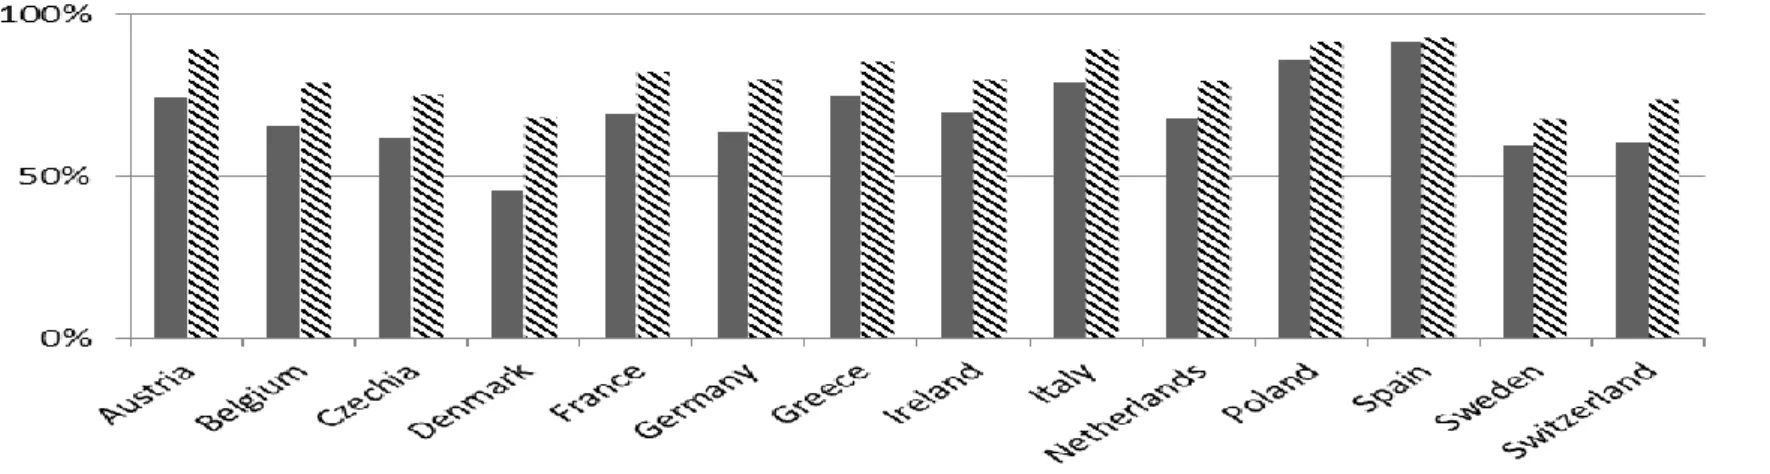
Figure A3 (Appendix D) shows the average distribution in relation to financial risk by gender and country. In all countries surveyed, women take less financial risk (on average) than men. Sweden is a country where women take more financial risk. Conversely, Spain is the country that shows the lowest financial risk taking for both female and male, with 93% and 92%, respectively, of respondents revealing that they do not assume any financial risk.
Attitudes regarding financial risk by wealth levels (Figure A4 in Appendix D) follows the path suggested by the literature, that the greater the wealth the greater risk taken by individuals.
Regarding behavior towards the financial risk and education (Figure A5 in Appendix D) is clear that as years of education increase there is a decrease in risk aversion. The comparison between countries regarding the mean values of the real and financial wealth (Figure A6, Appendix D) shows that individuals of Northern European countries have a larger share of wealth in financial assets compared with the other countries analyzed.
Results
This section presents the results obtained with the probit model for Regression (3) presented earlier, the predictor value of the explanatory variables is analyzed based on marginal effects after probit.
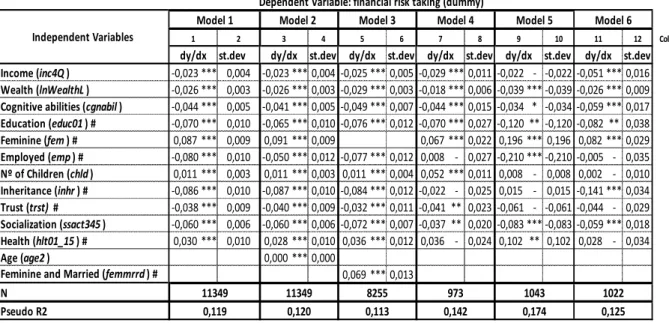
27
Table II shows the different models tested. The results in brief: being female, having children and a poor health status increases the probability of an negative attitude regarding taking financial risk, while income, wealth, cognitive abilities, education, employment status, inheritance, trust and socialization are good predictors of the willingness to taking financial risks.
Income (inc4Q) and wealth (lnWealthL) are good predictors for taking financial risk. Results converge with Breuer, Riesener and Salzmann (2012), Campbell, (2006), Christelis, Japelli and Padula (2010), Hartog, Ferrer-i-Carbonell and Jonker (2002), Jianakoplos and Bernasek (2006), Laakso (2011) and Rosen and Wu (2004). Both
2 4 6 8 10 12 Column nº
st.dev st.dev st.dev st.dev st.dev st.dev
Income (inc4Q ) -0,023 *** 0,004 -0,023 *** 0,004 -0,025 *** 0,005 -0,029 *** 0,011 -0,022 - -0,022 -0,051 *** 0,016
Wealth (lnWealthL ) -0,026 *** 0,003 -0,026 *** 0,003 -0,029 *** 0,003 -0,018 *** 0,006 -0,039 *** -0,039 -0,026 *** 0,009
Cognitive abilities (cgnabil ) -0,044 *** 0,005 -0,041 *** 0,005 -0,049 *** 0,007 -0,044 *** 0,015 -0,034 * -0,034 -0,059 *** 0,017
Education (educ01 ) # -0,070 *** 0,010 -0,065 *** 0,010 -0,076 *** 0,012 -0,070 *** 0,027 -0,120 ** -0,120 -0,082 ** 0,038 Feminine (fem ) # 0,087 *** 0,009 0,091 *** 0,009 0,067 *** 0,022 0,196 *** 0,196 0,082 *** 0,029 Employed (emp ) # -0,080 *** 0,010 -0,050 *** 0,012 -0,077 *** 0,012 0,008 - 0,027 -0,210 *** -0,210 -0,005 - 0,035 Nº of Children (chld ) 0,011 *** 0,003 0,011 *** 0,003 0,011 *** 0,004 0,052 *** 0,011 0,008 - 0,008 0,002 - 0,010 Inheritance (inhr ) # -0,086 *** 0,010 -0,087 *** 0,010 -0,084 *** 0,012 -0,022 - 0,025 0,015 - 0,015 -0,141 *** 0,034 Trust (trst) # -0,038 *** 0,009 -0,040 *** 0,009 -0,032 *** 0,011 -0,041 ** 0,023 -0,061 - -0,061 -0,044 - 0,029 Socialization (ssact345 ) -0,060 *** 0,006 -0,060 *** 0,006 -0,072 *** 0,007 -0,037 ** 0,020 -0,083 *** -0,083 -0,059 *** 0,018 Health (hlt01_15 ) # 0,030 *** 0,010 0,028 *** 0,010 0,036 *** 0,012 0,036 - 0,024 0,102 ** 0,102 0,028 - 0,034 Age (age2 ) 0,000 *** 0,000
Feminine and Married (femmrrd ) # 0,069 *** 0,013
N Pseudo R2 0,119 0,120 0,113 0,142 0,174 0,125 dy/dx 11349 11349 8255 973 1043 1022 Model 6 1 3 5 7 9 11 Independent Variables
Dependent Variable: financial risk taking (dummy)
Model 1 Model 2 Model 3 Model 4 Model 5
dy/dx dy/dx dy/dx dy/dx dy/dx
The table presents five specifications of the probit regressions tested. The dependent variable takes the value one if the respondent is not willing to take any financial risk and zero otherwise. Model 1 is the general model, Model 2 has the indicator for age squared, in Model 3 the variable fem*mrrd is tested. Model 4, Model 5 and Model 6 show the results of Model 1 for Italy, Denmark and Belgium, respectively.
Notes: - , *, **, *** represent no significance, significance on the 10%, 5% and 1% levels, respectively. # indicates a dummy variable.
In the Independent Variables column in parenthesis is the variables designation used in the regressions Source: Author’s calculations based on the micro data of SHARE second wave
28
results are expected as it is rational that the information and transaction costs are the biggest impediment to investment in the equity market (Breuer, Riesener and Salzmann, 2012; Christelis, Japelli and Padula, 2010; Laakso, 2011). If the income of an individual only covers current expenses and there is no disposable income for savings, no income can be invested. The same applies to wealth.
The impact of cognitive abilities (cgnabil) presents positive effect on taking financial risk.4 The result converge with Atella, Brunetti and Maestas (2012), Christelis, Japelli and Padula (2010) and Laakso (2011). Cognitive abilities may be related to the ability to process financial information and with the perception of information and transaction costs required for entry into the financial markets.
The level of education (educ01) is a good predictor of a positive attitude regarding risk. Similar results were obtained in many studies (Atella, Brunetti and Maestas, 2012; Campbell, 2006; Christelis, Japelli and Padula, 2010; Hartog, Ferrer-i-Carbonell and Jonker, 2002; Laakso, 2011; Rosen and Wu, 2004). This result implies that for two individuals, with mean values in all other indicators, the probability that a person who does not assume any financial risk diminishes 7% if it has more than 9 years of education, which can be explained by the contribution of education in the increase of financial literacy, cognitive abilities and awareness of health status.
The age variable (age) tested did not prove statistically significant, but when we entered the quadratic term (age2) this is significant (model 2 in Table II). This result may be due, as Atella, Brunetti and Maestas (2012), Andersen et al., (2010), and Kouwenberg Dimmock (2010) and Laakso (2011) argue, the questionnaires focus on an age segment
4
In the initial specification of the model, only the indicators of numeracy and fluency were statistically significant (p-value = 0.000) with the expected effect (negative), so we chose to include in the final specification of the model an indicator of overall cognitive abilities (cgnabil) that aggregates all indicators (numeracy, fluency and memory), in order to have comparable results.
29
of the population, which can be homogeneous in certain characteristics. Being female (fem) increases risk aversion. The effect of married status (mrrd) is not statistically significant, and was removed from the model. Ceteris paribus, the probability that a female does not assume any financial risk is 7% higher than the male contrapart. Identical results were obtained by Andersen et al. (2010), Barber and Odean (2001), Bucciol and Miniaci (2011), Croson and Gneezy (2009), Dohmen et al. (2009), and Jianakoplos Bernasek (1998). Many studies have researched the effect of the gender together with the marital status, and was tested an indicator Female x Married (femmrrd). The model 3 (Table II) presents the regression results, indicating that being a woman and being married increases by 6.9% the probability of not assuming any financial risk.
The employment status (emp) has a negative relationship with financial risk aversion, showing that the fact of being employed or self-employed decreases the probability of not assuming any financial risk by 8%. Hartog, Ferrer-i-Carbonell and Jonker (2002) concluded also that being a self-employed worker decreases risk aversion. All other indicators, related to the employment status, tested were not statistically significant and were excluded from the final models presented.
Family responsibilities, evaluated by the number of children (chld), increase the likelihood of not assuming any financial risk, which converges with the results of Edwards (2008) and Jianakoplos and Bernansek (2006). If an individual has the purpose of inheritance (inhr)5 it decreases the probability to not assume any financial risk by 8%, ceteris paribus. The result for the inheritance seems to follow the explanation of
5
In SHARE there are three questions regarding the likelihood of leaving a legacy, namely the probability of leaving an inheritance equal to or greater than € 50,000 (inhr), likely to leave any inheritance (inhrany)and probability of leaving a legacy of 150,000 € or up (inhr150). Only the first indicator (inhr) proved statistically significant, and the other indicators were excluded from the final specification of the model.
30
time horizon extending. The number of children may be related to the results obtained by Jianakoplos and Bernasek (2006) who estimated that the number of children influences the perceived financial risk taking, but appears to have no effect on the actual, observed risk-taking.
The level of confidence in other people (trst) decreases risk aversion. This is also related to the level of socialization (ssact345) of individuals, introduced as affecting behavior towards risk in the final model6, which has also a positive effect on the willingness to take financial risk. The results converge with previous studies, but interestingly the work of Christelis, Japelli and Padula (2010), include the variables excluded in this work (ssact6 and ssact7) and excludes the ones included (ssact3 and ssact4).
A poorer health status (hlth01_15) leads to an increase of the probability of not assuming any financial risk to 3%, which may be related to the direct costs and indirect costs of a poorer health status, or even the degree of protection of NHS in each country. Model 1 was estimated for each of the 14 countries. The results were diverse and divergent and the statistic quality was weak in general. Model 4 (Table II) was estimated for Italy, the country which presented better model statistical significance. Model 5 (Table II) uses Denmark data, and the R2 obtained is the highest. The differences across countries suggest that there are strong institutional, cultural and historical determinants of risk behavior.
Several model specifications were tested for the general model presented previously (Regression (3)). Different measures have been tested as health indicators (scale of 0 to
6
The set of socialization activities with predictive power are: familiar helps (ssact3), course attendance (ssact4) and physical activity (ssact5), since the coefficients of the other variables are not statistically significant they were excluded from the model (volunteering (ssact1), care of ill or disabled (ssact2), religion (ssact6) and politics (ssact7)).
31
10) and inheritance but they did not demonstrate to be statistically significant and were excluded from the final specification of the model. Additional explanatory variables were also tested: perception of the individual, corresponding to individuals who think the future will be better (ftrgood), satisfaction with life (stfct) and an indicator of individual autonomy (notautn) (see Table AI in Appendix B for more detailed information). All these indicators were not statistically significant.
We also tested two explanatory variables related to the status in relation to work, corresponding to individuals who work in Financial intermediation (financintr) and in the public sector (pubsect) that showed statistically significant but then other variables were not significant, like the variable employed (emp) and health status (hlth01_15). This could be a future line of research to develop.