UNIVERSIDADE DE LISBOA
FACULDADE DE MEDICINA DE LISBOA
Determining the prognostic significance of
PI3K/Akt/mTOR and JAK/STAT5 signaling
pathways in pediatric acute lymphoblastic
leukemia using single-cell analysis
Mariana Lobato de Oliveira
UNIVERSIDADE DE LISBOA
FACULDADE DE MEDICINA DE LISBOA
Determining the prognostic significance of
PI3K/Akt/mTOR and JAK/STAT5 signaling
pathways in pediatric acute lymphoblastic
leukemia using single-cell analysis
Mariana Lobato de Oliveira
Tese orientada pelo Doutor João Pedro Taborda Barata
Mestrado em Oncobiologia
A impressão desta dissertação foi aprovada pelo Conselho
Científico da Faculdade de Medicina de Lisboa em reunião de 27
de Janeiro de 2015.
Acknowledgments/
Agradecimentos
Gostaria, em primeiro lugar, de agradecer ao meu orientador, o Dr. João Taborda Barata, por me ter aceite como sua estudante de mestrado no seu laboratório e por me ter proporcionado um projecto difícil, mas acima de tudo desafiante. Obrigado por todo o suporte, motivação e conhecimentos facultados ao longo deste ano, bem como por todas as críticas e sugestões que ajudaram a melhorar este projecto.
Porque foi com ela que aprendi todas as técnicas necessárias ao desenvolvimento deste projecto, queria deixar um enorme agradecimento à Leila Martins. Obrigado por todo o tempo precioso que passaste comigo na bancada, e por todos os conselhos e dicas que me deste. Um grande beijinho para o Gustavo que, no final de contas, esteve connosco todos os dias durante os primeiros 3 meses de trabalho.
Como sem eles o tempo na minha segunda “casa” passaria mais devagar, não podia deixar de agradecer a todos os meus colegas de laboratório, passados e actuais, pelos bons momentos tanto de trabalho como de diversão. O meu obrigado à Rita Fragoso, Isabel Alcobia, Leonor Sarmento, Cláudia Faria, Nádia Correia, Daniel Ribeiro, Alice Melão, Vanda Póvoa, Joana Matos, Joana Silva e Padma Akkapeddi. Um especial obrigado à Rita por todo o apoio disponibilizado durante a realização do projecto bem como durante a escrita desta tese. À Alice, obrigado por toda a ajuda na análise dos resultados, e por todas as conversas de incentivo sem as quais tudo teria sido mais complicado.
Gostaria, também, de agradecer à Ana Vieira e à Ana Sílvia Gonçalves da Unidade de Citometria de Fluxo do Instituto de Medicina Molecular pela preciosa ajuda técnica.
Gostaria de agradecer a contribuição dos doentes e respectivas famílias, e ao Director Clínico, Médicos, e Enfermeiros do Departamento de Pediatria do Instituto Português de Oncologia de Lisboa Francisco Gentil envolvidos na disponibilização de amostras primárias utilizadas neste projecto.
O meu sincero e grande obrigado aos meus pais e à minha irmã. Obrigado por me terem proporcionado a hipótese de frequentar o Mestrado em Oncobiologia, e obrigado por todo o apoio e carinho ao longo destes dois anos. Obrigado por estarem sempre disponíveis e com um sorriso para me dar, tanto nos bons como nos maus momentos.
Abstract
Acute lymphoblastic leukemia (ALL) is the most frequent childhood malignancy and it is characterized by the accumulation of immature lymphoid cells within the bone marrow and lymphoid tissues. Approximately 85% of pediatric ALL patients have a B-cell phenotype (B-ALL), and, despite significant improvements in treatment outcome, around 10-20% still relapse. Thus, there is a clear need for new prognostic factors capable of accurately predicting response to therapy.
PI3K/Akt/mTOR and JAK/STAT5 pathways are extensively implicated in cancer. Both cell-autonomous factors and microenvironmental cues, such as interleukin 7 (IL-7), contribute to the activation of these pathways in ALL. However, it remains to be determined whether their activation status has a prognostic value in this malignancy.
In the current thesis, we proposed to tackle this issue by analyzing the phosphorylation levels of key elements of both pathways in a retrospective cohort (n=58) of pediatric B-ALL cases. Methodologically, we decided to use phospho-flow cytometry, given its potential applicability in clinical diagnostics.
Overall, our results show that pediatric B-ALL samples display significant inter-patient heterogeneity in the constitutive and IL-7-triggered levels of PI3K/Akt/mTOR and JAK/STAT5 pathway activation. Interestingly, we found that the response to IL-7 does not correlate with the levels of IL-7 receptor α expression. Most importantly, correlation of basal activation levels of both pathways with clinical features with known prognostic value revealed that higher constitutive levels of phosphorylation of S6 on S235/236 and Akt on S473, but not on T308, are associated with higher white blood cell counts. These results suggest the existence of two independent mechanisms leading to Akt activation in ALL, with different biological outcomes.
Overall, our preliminary results suggest that there is a positive association of high Akt S473 and S6 S235/236 phosphorylation levels with high risk, which is often associated with a poor prognosis.
Keywords:
B-cell Acute Lymphoblastic Leukemia, PI3K/Akt/mTOR pathway,Resumo
A leucemia linfoblástica aguda (LLA) é o cancro mais frequente em crianças, apresentando um pico de incidência entre os 2 e os 5 anos de idade. Esta doença caracteriza-se pela expansão clonal descontrolada e consequente acumulação de linfócitos imaturos na medula óssea, com posterior infiltração de outros órgãos. O subtipo mais comum de LLA é a leucemia linfoblástica aguda de células B (LLA-B), constituindo cerca de 85% dos casos pediátricos e 75% dos casos adultos. Os tratamentos actuais apresentam uma elevada eficácia e aproximadamente 80% dos doentes pediátricos apresentam-se livres de doença 5 anos após o início do tratamento. Contudo, cerca de 10-20% dos doentes sofrem recidivas, frequentemente associadas a complicações a longo prazo, resultantes da elevada toxicidade dos tratamentos. Existem vários factores de prognóstico em LLA pediátrica essenciais para definir o tratamento mais adequado dos doentes, incluindo idade, contagem de leucócitos na fase de diagnóstico e presença de anomalias citogenéticas (trissomia 21 ou cromossoma de Filadélfia). Um factor de grande importância para a progressão da doença é a activação de vias de transdução de sinal fundamentais. Sabe-se, por exemplo, que mutações em elementos destas vias podem afectar a resposta dos doentes ao tratamento. No entanto, e apesar da contribuição destas vias para o desenvolvimento de LLA-B, o seu valor prognóstico não é conhecido. Importa salientar que a caracterização da activação das vias de transdução de sinal à data do diagnóstico poderá auxiliar na escolha de terapias mais específicas, com consequente aumento da eficácia e diminuição da toxicidade do tratamento. As vias de sinalização PI3K/Akt/mTOR and JAK/STAT5 têm sido amplamente implicadas em cancro de um modo geral e, em particular, em LLA. A via PI3K/Akt/mTOR encontra-se constitutivamente hiperactivada em doentes pediátricos com leucemia linfoblástica aguda de células T (LLA-T), promovendo a viabilidade das células leucémicas. Foi também demonstrado que esta via é activada pela citocina IL-7 (que se encontra presente no microambiente tumoral), modulando a resistência das células leucémicas face à quimioterapia. A corroborar este facto, diferentes estudos indicam que a citocina IL-7 é capaz de modular, tanto in vitro como in vivo, a resposta das células de LLA-B a inibidores farmacológicos de mTOR (Rapamicina). Existe igualmente evidência a nível genético que apoia um possível valor prognóstico para esta via em LLA. Vários estudos realizados em LLA-T mostram que mutações ou delecções que levam à inactivação do principal regulador negativo da via, o supressor tumoral PTEN, estão associadas a um pior prognóstico. Este regulador pode ainda estar sujeito a inactivação pós-tradução, um processo bastante frequente tanto em LLA-T como em LLA-B.
Tal como a via PI3K/Akt/mTOR, a via de sinalização JAK/STAT5 é activada em resposta a estimulação com IL-7, ou quando o receptor desta citocina, IL-7R, se encontra constitutivamente activado devido a mutações. O principal papel desta via no desenvolvimento de LLA-B tem sido maioritariamente demonstrado pela activação constitutiva do factor de transcrição STAT5 a jusante da translocação BCR-ABL. Doentes com esta translocação, conhecidos como Filadélfia-positivos, apresentavam outrora muito mau prognóstico, uma situação resolvida com a inclusão no tratamento de terapias direccionadas especificamente para BCR-ABL, entre as quais o Imatinib foi o primeiro exemplo.
Tendo em conta as razões acima descritas, o principal objectivo desta tese é determinar, pela primeira vez, se o estado de activação das vias de sinalização PI3K/Akt/mTOR e JAK/STAT5 tem valor prognóstico em LLA-B pediátrica. Para responder a esta questão, avaliaram-se os níveis de fosforilação de elementos chave de cada uma das vias de transdução de sinal num grupo retrospectivo (n=58) de casos pediátricos de LLA-B provenientes do Departamento de Pediatria do Instituto Português de Oncologia de Lisboa Francisco Gentil (IPOLFG). Para determinar o estado de activação de PI3K/Akt/mTOR analisaram-se os níveis de fosforilação de Akt e de S6, um alvo de mTOR; quanto à segunda via, JAK/STAT5, avaliou-se o nível de fosforilação de STAT5. Estes níveis foram medidos tanto basalmente como após estimulação com IL-7, utilizando citometria de fluxo
(phospho-flow cytometry). Posteriormente, e uma vez que dispomos dos dados clínicos de todos os
doentes utilizados neste estudo, correlacionaram-se os valores de fosforilação obtidos com os parâmetros clínicos com valor prognóstico, tais como idade, contagem de leucócitos à data do diagnóstico e doença residual mínima após a terapia de indução. Correlacionaram-se, também, com o estado de maturação de LLA-B (classificação de EGIL), com o objectivo de melhor compreender a biologia da doença. Adicionalmente a esta análise molecular, procedeu-se a uma análise funcional onde se avaliou a sensibilidade de cada amostra primária à citocina IL-7, medindo parâmetros como a viabilidade e a proliferação das células primárias em resposta à IL-7. Mediram-se, ainda, os níveis de expressão da subunidade α do IL-7R (IL-7Rα) nestas amostras, com o intuito de os correlacionar tanto com os resultados moleculares como com os funcionais.
É importante referir que a metodologia phospho-flow cytometry foi seleccionada tendo por base a enorme quantidade de informação passível de ser obtida através da análise de
Tendo em conta os nossos resultados, demonstrou-se que as amostras pediátricas de LLA-B são bastante heterogéneas no que diz respeito aos níveis de activação constitutiva das vias de transdução de sinal PI3K/Akt/mTOR e JAK/STAT5. Verificou-se, também, que a estimulação com IL-7 induz um aumento de activação de ambas as vias, embora com grande variabilidade entre as amostras. Quanto à análise funcional, e em concordância com o que já se tinha observado, a maioria das amostras primárias é sensível à estimulação com IL-7, traduzindo-se num aumento de viabilidade e proliferação celular. No que diz respeito aos níveis de expressão do IL-7Rα, também eles bastante variáveis, verificou-se que os mesmos não se correlacionam com os resultados moleculares e/ou funcionais. Isto é, níveis elevados de expressão do receptor não se traduzem necessariamente em maior activação das vias após estimulação com IL-7, nem num maior aumento de viabilidade ou proliferação celular. Para terminar, procedeu-se à correlação dos níveis de activação de ambas as vias de sinalização, tanto basais como após estimulação com IL-7, com as características clínicas anteriormente mencionadas. Não se encontrou nenhuma correlação significativa quando os níveis de activação foram comparados com a idade, o estado de maturação ou a doença residual mínima. Curiosamente, níveis basais elevados de fosforilação de S6 nas serinas 235 e 236 e de Akt na serina 473 (mas não na treonina 308) correlacionam-se com níveis elevados de leucócitos no diagnóstico que, por sua vez, estão associados a um risco elevado. Compararam-se, também, os níveis de expressão do IL-7Rα com os mesmos parâmetros clínicos e, embora não se tenha encontrado nenhuma associação significativa, existe uma tendência para níveis elevados de expressão em crianças com idade igual ou superior a 10 anos, normalmente associada a um pior prognóstico.
Concluindo, estes resultados, embora preliminares, parecem sugerir uma possível associação entre níveis elevados de fosforilação de S6 (serinas 235 e 236) e Akt (serina 473) e risco elevado, que se encontra normalmente associado a um mau prognóstico. O facto de esta correlação apenas abranger a fosforilação de Akt na serina 473, e não a na treonina 308, aponta para possível existência de dois mecanismos de activação de Akt em LLA, afectando diferencialmente os dois resíduos com consequências biológicas distintas. É nossa intenção repetir as análises realizadas neste estudo num maior número de amostras primárias, com o objectivo de validar as conclusões apresentadas nesta tese.
Palavras-chave:
Leucemia linfoblástica aguda de células B (LLA-B), via de sinalização PI3K/Akt/mTOR, via de sinalização JAK/STAT5, citocina IL-7, valor de prognóstico.Abbreviations
µHC Cytoplasmic µ heavy chain
7-AAD 7-Aminoactinomycin D
β-ME β-mercaptoethanol
ABL1 Abelson murine leukemia viral oncogene homolog 1
AEBSF 4-(2-Aminoethyl) enzenesulfonyl fluoride hydrochloride
Akt/PKB v-akt murine thymoma viral oncogene homolog/Protein kinase B
ALL Acute Lymphoblastic Leukemia
AML Acute Myeloid Leukemia
AnnV Annexin V
APC Allophycocyanin
B-ALL B-cell Acute Lymphoblastic Leukemia
BAD BCL2-associated agonist of cell death
Bcl-2 B-cell CLL/Lymphoma 2
Bcl-XL BCL2-like 1 isoform 1 BCR B cell receptor
BCR Breakpoint cluster region gene
BM Bone marrow
cDNA coding Deoxyribonucleic acid
CD Cluster of differentiation
CNS Central nervous system
CRLF2 Cytokine receptor-like factor 2
CXCL C-X-C chemokine ligand
CXCR C-X-C chemokine receptor
cyIg Cytoplasmic immunoglobulin
DI DNA Index
DMSO Dimethyl sulfoxide
DNA Deoxyribonucleic acid
DH Immunoglobulin heavy chain diversity region E2A Immunoglobulin enhancer-binding factor
FBS Fetal bovine serum
FITC Fluorescein Isothiocyanate
Flt3 Fms-like tyrosine kinase 3
FSC-A Forward scatter area
FSC-W Forward scatter width
G-CSF Granulocyte colony-stimulating factor
GL Germline
GM-CSF Granulocyte macrophage colony-stimulating factor
GSK3β Glycogen synthase kinase 3β
HLA Human leukocyte antigen
HSCs Hematopoietic stem cells
iAMP21 Intrachromosomal amplification of chromosome 21
IFNγ Interferon gamma
Ig Immunoglobulin
IgH Immunoglobulin heavy chain
IgL Immunoglobulin light chain
IL-7 Interleukin 7
IL-7R IL-7 receptor
JAK Janus kinase
JH Immunoglobulin heavy chain joining region JL Immunoglobulin light chain joining region
Mcl-1 Induced myeloid leukemia cell differentiation protein
MFI Mean fluorescence intensity
MLL Mixed lineage leukemia
MRD Minimal residual disease
mTOR Mammalian target of rapamycin
Pax5 Paired box 5
PB Peripheral blood
PBS Phosphate buffered saline
PCR Polymerase chain reaction
PDKs 3-Phosphoinositide dependent protein kinases
PE Phycoerythrin
Ph-ALL Philadelphia-positive Acute Lymphoblastic Leukemia
PI3K Phosphatidylinositol 3-kinase
PIP3 Phosphatidylinositol (3,4,5)-trisphosphate
Pre-B Precursor B cells
Pro-B Progenitor B cells
PTEN Phosphatase and tensin homolog
RUNX1 Runt-related transcription factor 1
SCF Stem cell factor
SCT Stem cell transplantation
SDF-1 Stromal derived factor 1
SDS Sodium dodecyl sulfate
SDS-PAGE Sodium dodecyl sulfate – Polyacrylamide gel electrophoresis sIg Surface immunoglobulin
SSC-A Side scatter area
STAT Signal Transducer and Activator of Transcription
T-ALL T-cell Acute Lymphoblastic Leukemia
TBS-T Tris-Buffered Saline with Tween 20
TdT Terminal deoxynucleotidyl transferase
TKIs Tyrosine kinase inhibitors
TSLP Thymic stromal lymphopoietin
VH Immunoglobulin heavy chain variable region VL Immunoglobulin light chain variable region VDJ Variable-diversity-joining
WBC White blood cell
Contents
Acknowledgments ... 1 Abstract ... 3 Resumo ... 4 Abbreviations ... 7 Contents ...11 Index of Figures ...13 Index of Tables ...14 Introduction ...15 B cell development ...15B-cell Acute Lymphoblastic Leukemia (B-ALL) ...17
Malignant B cell development ...17
General Features ...18
Treatment ...20
Prognostic Factors ...21
IL-7/IL-7R-mediated signaling in normal and malignant B cell development ...23
JAK/STAT5 pathway ...24
PI3K/Akt/mTOR pathway ...25
Objectives ...27
Materials and Methods ...29
Primary B-ALL samples and the NALM-6 cell line ...29
Intracellular phospho-specific flow cytometry ...29
Analysis of IL-7Rα surface expression ...30
Assessment of cell viability and cell size ...30
Protein Extraction and Quantification ...30
Western Blot ...31
Membrane Stripping ...31
Proliferation Assays ...32
ALL samples show heterogeneous levels of PI3K/Akt/mTOR and JAK/STAT5
pathway activation in response to IL-7 ...35
High degree of heterogeneity of functional responses to IL-7 and IL-7Rα expression in primary ALL samples ...37
Levels of Akt and S6 phosphorylation associate with WBC counts ...41
Discussion ...45
Conclusion ...49
References ...51
Supplementary Information ...55
Index of Figures
Figure 1. Schematic representation of B cell developmental stages. ... 16 Figure 2. Movement of B cell progenitors within BM niches during B cell development.17 Figure 3. Estimated frequency of genetic abnormalities subgroups in pediatric ALL. . 20 Figure 4. Schematic representation of IL-7/IL-7R-mediated signaling through JAK/STAT5
and PI3K/Akt/mTOR pathways. ... 26
Figure 5. Gating strategy and analysis of signaling pathway activation by phospho-flow
cytometry. ... 34
Figure 6. Heterogeneity of IL-7-mediated signaling responses in B-ALL patient samples. ... 37 Figure 7. Heterogeneity of functional responses to IL-7 in B-ALL patient samples. .... 38 Figure 8. IL-7Rα expression in primary B-ALL cells. ... 39 Figure 9. IL-7Rα expression levels do not correlate with signaling pathway activation or
functional outcomes in pediatric B-ALL samples. ... 40
Figure 10. Basal or IL-7-stimulated levels of activation of PI3K/Akt/mTOR and
JAK/STAT5 pathways do not appear to correlate with age or maturation stage in pediatric B-ALL patients. ... 42
Figure 11. Basal phosphorylation levels of S6 on S235/236 and Akt on S473 associate
with WBC counts in B-ALL patient samples. ... 43
Figure 12. Basal or IL-7-stimulated levels of activation of PI3K/Akt/mTOR and
JAK/STAT5 pathways do not associate with MRD status in pediatric B-ALL patients.
... 44 Figure S1. IL-7Rα expression levels do not associate with age, maturation stage, WBC
counts or MRD status in pediatric B-ALL samples. ... 57
Figure S2. Pediatric B-ALL cases display significantly higher levels of PI3K/Akt/mTOR
Index of Tables
Table 1. The EGIL classification of pediatric B-ALL. ... 19 Table 2. Estimated event-free survival of different genetic abnormalities with significant
prognostic value in pediatric B-ALL. ... 22
Introduction
Introduction
B cell development
The development of B lymphocytes is an ordered and highly regulated process that begins in the bone marrow (BM) and continues in the secondary lymphoid organs, such as the spleen and lymph nodes. It starts when hematopoietic stem cells (HSCs) become committed to the B cell lineage and proceeds with the rearrangement of immunoglobulin (Ig) genes, as well as with the gain and loss of expression of several genes that have critical roles in commitment and maintenance along the B cell development1.
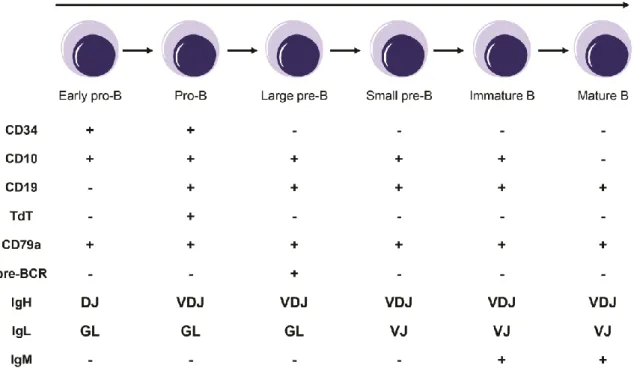
B lymphopoiesis can be divided into several stages, each defined by the sequential expression of different genes, and by the rearrangement status of the immunoglobulin heavy (IgH) and light (IgL) chains (Figure 1). The earliest cell committed to the B cell lineage is called the early progenitor-B cell (early pro-B or pre-pro-B), which is characterized by the beginning of IgH chain rearrangement, with the recombination of diversity (DH) and joining (JH) gene segments, and the expression of Igα (CD79a), a B
lineage specific protein2-4. In pro-B cells, the rearrangement of the variable (V
H) gene
segment with the rearranged DJH segments occurs and cells start to express CD192, 3, 5.
Upon completion of functional VDJ IgH rearrangements, pro-B cells differentiate into precursor B cells (pre-B cells). Pre-B cells are characterized by the expression of the cytoplasmic µ heavy chain (µHC) on the cell surface, in association with a surrogate light chain, as part of the pre-B cell receptor (pre-BCR) complex, which plays important roles in B cell proliferation and maturation6, 7. This stage can be subdivided into two substages: an
initial proliferative phase called large pre-B cell stage and a maturation phase named small pre-B cell stage, which is characterized by the rearrangement of the VL and JL gene
segments of the IgL chain7. Signaling through the pre-BCR is responsible for the transition
between these two substages. After the successful IgL rearrangement and association with the HC, an IgM is produced, which specifically characterizes immature B cells. The immature B cells that are not self-reactive leave the BM and complete their maturation in the spleen.
Introduction
Figure 1. Schematic representation of B cell developmental stages. Each stage is defined by
the sequential expression of different proteins and by the rearrangement status of the IgH and IgL chains. GL: germline; TdT: terminal deoxynucleotidyl transferase.
As described earlier, B cell development is a tightly regulated process, mainly controlled at the transcriptional level. This level of regulation is responsible for B cell lineage commitment and differentiation. By knockout experiments, several transcription factors have been identified as essential for B lymphopoiesis. In lymphoid lineage commitment, two transcription factors are the key regulators, PU.1 and Ikaros8, 9. PU.1 is
also responsible for controlling the expression of the interleukin 7 receptor (IL-7R) in lymphoid progenitors10. Other three transcription factors, immunoglobulin
enhancer-binding factor (E2A), early B cell factor (EBF) and paired box protein (Pax5), are important for the commitment to the B cell lineage at the pro-B cell stage11. Although the
transcription factors mentioned above affect early development, some of them are also active at the later stages of B cell differentiation.
Besides the importance of the specific transcription factors mentioned above, the cells comprising the BM microenvironment also have a major role in B cell development by directly interacting with the B cell precursors and by secreting required cytokines and chemokines. Thus, both intrinsic and extrinsic factors regulate B cell lymphopoiesis. Receptors to the secreted cytokines and chemokines are expressed in B cells and control the early stages of B cell development. The most important ones are c-kit, fms-like tyrosine kinase 3 (Flt3), IL-7R and C-X-C chemokine receptor type 4 (CXCR4). Their
Introduction
respective ligands are the stem cell factor (SCF), Flt3 ligand (Flt3L), interleukin 7 (IL-7) and stromal derived factor 1 (SDF-1, also known as C-X-C chemokine ligand (CXCL) 12)12, 13. Different cell types within the BM, such as osteoblasts, reticular cells and
fibroblast-like stromal cells expressing IL-7, produce these factors, creating specific cellular niches12. Throughout B cell development, B cells at different stages of
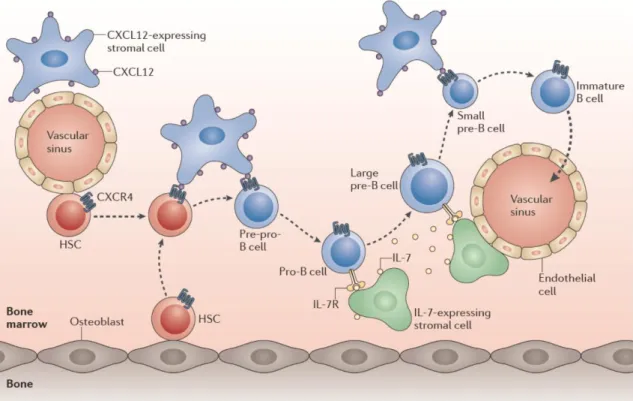
differentiation localize within different BM niches according to their needs (Figure 2).
Figure 2. Movement of B cell progenitors within BM niches during B cell development.
HSCs, when committed to the B cell lineage, move from the osteoblasts or endothelial cells to the reticular cells expressing CXCL12. Thereafter, pro-B cells move away from these cells towards IL-7-expressing stromal cells and, within the pre-B cell stage, large pre-B cells are still in contact with IL-7-expressing cells, whereas small pre-B cells leave them. At last, immature B cells exit the BM.
From Clark et al., 201414.
B-cell Acute Lymphoblastic Leukemia (B-ALL)
Malignant B cell development
Introduction
normal B cell development and the precise cellular origin of the disease are not completely understood.
Regarding the mechanisms that lead to the disruption of B cell lymphopoiesis, it is already known that multiple specific genetic changes may contribute to B-ALL development. It is thought that a primary genetic event, usually a chromosome translocation, followed by different secondary genetic alterations may drive the malignant transformation. These genetic alterations commonly interfere with the control of normal B cell differentiation and proliferation15. In fact, alterations in genes encoding transcription
factors essential for normal B lymphopoiesis, such as Ikaros, E2A, EBF and Pax5, have been described16. As in normal development, genetic abnormalities are not the only
events promoting leukemogenesis: the surrounding microenvironment plays an important role in this process. Indeed, both composition and function of BM stromal cells are significantly changed in B-ALL cases, leading to an increase in the levels of the chemokines and cytokines responsible for the proliferation and survival of the leukemic cells17. However, it is not known whether the microenvironmental abnormalities precede
the leukemic stage or are a consequence of the leukemic cell activity.
The exact cell-of-origin of B-ALL remains an open relevant issue. By in vitro and in
vivo studies, it has been suggested that the primary genetic event can occur in different
cells at different stages of maturation18. In other words, both cells at early stages of B cell
development as well as cells at later stages can be the leukemia cells-of-origin in human B-ALL. Another hypothesis defends that the primary transformation may take place at an early developmental stage, followed by further differentiation of the altered B cell and arrestment at a later stage of differentiation19. Regarding pediatric B-ALL, it has been
proposed, for several years, that it may be originated prenatally in utero during fetal hematopoiesis, with additional postnatal events to complete malignant transformation20.
General Features
Acute lymphoblastic leukemia (ALL) is the most frequent childhood malignancy, accounting roughly for one quarter of all pediatric cancers and more than 80% of leukemias. ALL has a peak of incidence at 2 to 5 years of age and is also common in the elderly, while it is unusual in middle-aged adults21, 22. The most common subtype of ALL is
B-ALL, comprising 85-90% of pediatric and 75% of adult ALL cases. Despite significant improvements in treatment outcome, with a 5-year event-free survival rate of approximately 80% for childhood ALL23, around 10-20% of the patients still relapse with
Introduction
about 30-40% of the patients achieve long-term disease-free survival24. Of note, the
current thesis focuses only on pediatric B-ALL.
Patients with ALL are usually characterized by BM infiltration with more than 80-100% of malignant lymphoblasts and diagnostic symptoms are correlated with leukemia cell burden, extension of BM replacement and involvement of peripheral blood (PB) and extramedullary sites. For these reasons, there are several clinical features at presentation, such as anemia, thrombocytopenia, splenomegaly, lymphadenopathy and headache (usually an indication of central nervous system (CNS) involvement)25.
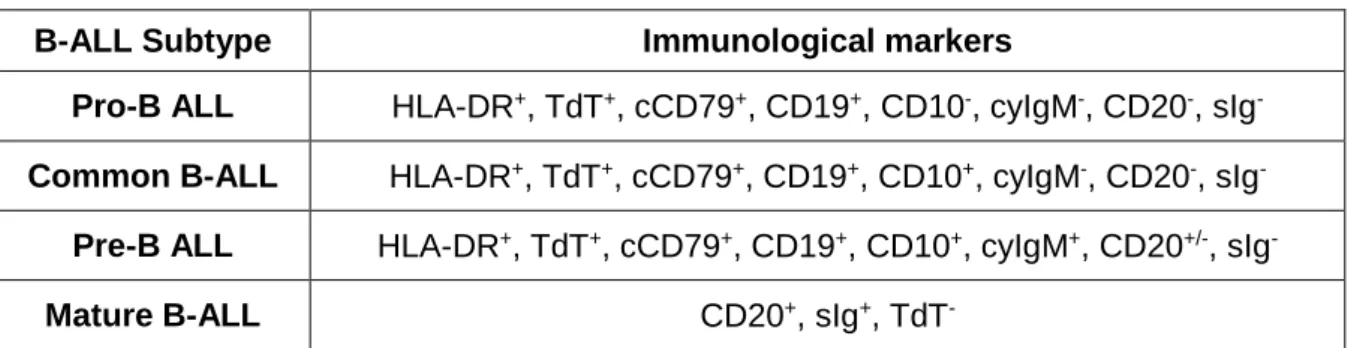
B-ALL can be sub-classified according to the immunophenotype and to specific genetic abnormalities. Regarding the immunophenotype, the European Group for the Immunological classification of Leukemias (EGIL)26 proposes a classification mainly based
on the maturation stage of normal B cell development where the arrest occurred, leading to four B-ALL subtypes: pro-B ALL (B-I), common B-ALL (B-II), pre-B ALL (B-III) and mature B-ALL (B-IV, Burkitt ALL). The first three subtypes constitute the precursor B-ALL group, whereas the last one forms the mature B-ALL group. The most common subtype in pediatric cases is, as the name suggests, the common B-ALL. A summary of the immunological markers of each subtype is shown in Table 1.
Table 1. The EGIL classification of pediatric B-ALL.
B-ALL Subtype Immunological markers
Pro-B ALL HLA-DR+, TdT+, cCD79+, CD19+, CD10-, cyIgM-, CD20-, sIg
-Common B-ALL HLA-DR+, TdT+, cCD79+, CD19+, CD10+, cyIgM-, CD20-, sIg-
Pre-B ALL HLA-DR+, TdT+, cCD79+, CD19+, CD10+, cyIgM+, CD20+/-, sIg
-Mature B-ALL CD20+, sIg+, TdT
-HLA: human leukocyte antigen; TdT: terminal deoxynucleotidyl transferase; cy: cytoplasmic; s: surface.
Regarding the genetic abnormalities, they are detected in about 80% of children with B-ALL and their identification has important implications on prognosis and therapeutic choices15. Different types of alterations have been found, including chromosomal
Introduction
respectively15. The frequency of the genetic abnormalities seen in pediatric cases is
presented in Figure 3.
Figure 3. Estimated frequency of genetic abnormalities subgroups in pediatric ALL. The
genetic alterations shown in purple are only detected in T-cell ALL cases. This figure does not include submicroscopic genetic alterations. iAMP21: intrachromosomal amplification of
chromosome 21. Adapted from Pui et al., 201123.
Treatment
Childhood ALL treatment has been changing over time in order to establish taylor-made, patient-adjusted therapies with the goal of augmenting efficacy while decreasing the significant acute toxicities and late-occurring adverse events associated with current chemotherapy.
Briefly, B-ALL treatment usually comprises 3 phases. The initial phase of treatment, the remission induction phase, whose main objective is to achieve remission and restore normal hematopoiesis, includes the combination of glucocorticoids (prednisone or dexamethasone), vincristine and asparaginase. One or more additional drugs, such as an anthracycline (doxorubicin or daunorubicin) and cyclophosphamide, are integrated in the treatment of children with high or very high risk ALL27. After completion of
this first phase, it is necessary to ensure the complete abolishment of residual leukemic cells, including the drug-resistant ones. This is the goal of the consolidation or
Introduction
intensification phase, normally consisting on the administration of high-dose methotrexate and mercaptopurine27. The treatment finishes with a less intensive regimen of weekly
methotrexate and daily mercaptopurine, named continuation or maintenance therapy, to avoid relapses and effect cure27. Since some patients may present CNS involvement at
time of diagnosis and some of them may present it during the course of the disease, CNS directed therapy should be included in treatment protocols. Currently, this therapy consists of triple intrathecal chemotherapy with methotrexate, cytarabine, and hydrocortisone27.
It is important to refer that pediatric patients with mature B-ALL, known to have unfavorable prognosis, are treated with a more intensive chemotherapy regimen, including high-dose methotrexate, cytarabine, and cyclophosphamide, for a short period of time21. It
has also been shown that high risk ALL patients, such as those with Ph-positive disease and those with a poor early response to treatment, benefit from allogeneic hematopoietic stem cell transplantation (SCT), the most intensive form of treatment21.
Prognostic Factors
The prognosis of childhood ALL has improved substantially over the last decades, mostly due to the identification of trustworthy prognostic factors essential to establish prognosis, treatment protocol and follow-up strategy, as well as to personalize patient counseling. Two subgroups of prognostic factors can be identified: those at presentation, including age, initial white blood cell (WBC) counts, CNS disease, immunophenotype and presence of certain cytogenetic and molecular features; and those based on treatment response, comprising achievement of complete remission, detection of minimal residual disease (MRD), time to relapse and overall survival23. Notably, some prognostic indicators
in pediatric ALL, such as gender and race, have lost their prognosis strength as a result of enhanced treatment strategies21.
Regarding the first subgroup of prognostic factors, and starting by age at diagnosis which has a strong prognostic effect, children older than 1 year of age and younger than 10 years of age have a better prognosis than infants (less than 1 year old) or adolescents. In fact, the 5-year event-free survival estimate is 88% for children with ages between 1 and 9 years, 73% for adolescents between 10 and 15 years, 69% for children older than 15 years, and 44% for infants. The latter group has the worst prognosis21. Other factors
Introduction
consensus about the prognostic power of each of the three subtypes within the precursor B-ALL group. The last, but not least, important prognostic factor in this subgroup is the presence of genomic abnormalities. The most commonly associated with an adverse outcome are hypodiploidy (<44 chromosomes), especially near haploidy (24-31 chromosomes) and low-hypodiploidy (32-39 chromosomes); BCR-ABL1 translocation (also called Philadelphia chromosome (Ph)); MLL gene rearrangements; and iAMP2128.
Of note, the outcome of patients with BCR-ABL1 translocation has been dramatically improved with the introduction of BCR-ABL targeted therapies (tyrosine kinase inhibitors, TKIs, such as Imatinib) in the treatment protocols. Those associated with a favorable prognosis are hyperdiploidy (>50 chromosomes) or DNA index (DI) ≥1.16, and
ETV6-RUNX1 rearrangement28. This is confirmed by the estimated event-free survival rates for
each genetic abnormality (Table 2)27.
Table 2. Estimated event-free survival of different genetic abnormalities with significant prognostic value in pediatric B-ALL.
Prognosis Genetic abnormality Estimated percent event-free
survival (at the indicated years)
Favorable Hyperdiploidy 80-90 (5 years)
ETV6-RUNX1 fusion 85-95 (5 years)
Adverse
Hypodiploidy 30-40 (3 years)
BCR-ABL1 fusion 80-90 (3 years)
MLL-AF4 fusion 30-40 (5 years)
iAMP21 60-70 (5 years)
Regarding the response to treatment, MRD detection at the end of induction therapy is the most powerful independent predictor of prognosis and can be used to change treatment regimens28, 29. Assessment of this parameter provides a more sensitive
measurement of the rate of reduction of leukemic cells from both BM and PB during remission induction therapy28. Two different methods can be used to detect MRD at very
low levels (<0.01%), namely flow cytometric profiling of aberrant leukemia-associated immunophenotype and polymerase chain reaction (PCR) amplification of leukemia-specific fusion transcripts or Ig gene rearrangements21, 25. Children with 1% or more
leukemic cells in BM at the end of remission induction therapy have a worse prognosis, whereas those with less than 0.01% leukemic cells, which achieved immunological or molecular remission, have an outstanding outcome21. So, the extent of MRD inversely
Introduction
IL-7/IL-7R-mediated signaling in normal and malignant B cell development
Normal B- and T- cell development require different cytokines secreted in the microenvironment, including IL-7, a type I pro-survival cytokine originally described as a growth factor for mouse B lineage progenitors30. IL-7 is produced by several types of cells,
such as BM and thymic stromal cells, vascular endothelial cells, intestinal epithelium, keratinocytes and follicular dendritic cells. Its heterodimeric receptor, IL-7R, comprises the IL-7Rα subunit (CD127), encoded by IL7R and shared by the receptor for thymic stromal lymphopoietin (TSLP), and the common gamma chain, γc, which is shared by the cytokine receptors for IL-2, IL-4, IL-9, IL-15, and IL-2131, 32. The IL-7 receptor is mainly expressed
by lymphoid cells, as B and T cell precursors, and also by leukemic cells33.
The precise role of the IL-7/IL-7R system during normal human B cell development is not as clear as it is for normal human T cell development and murine B cell development. Expression of the IL-7R is tightly regulated during both mouse and human B cell differentiation, starting at early pro-B cells until the large pre-B cell stage. When the maturation proceeds, its expression begins to be downregulated33, 34. The critical roles of
IL-7 in murine B cell development have been demonstrated by in vivo loss-of-function experiments. By using blocking antibodies against IL-7 or IL-7R, it was observed a rapid decrease in the total number of B lineage cells within the BM35, 36. Furthermore, targeted
deletions in the IL-7, IL-7Rα or γc genes lead to a block at an early stage of B lymphopoiesis in adult mice37-39. However, when one looks at human B cell development,
IL-7 does not seem to be absolutely essential. Indeed, B cell differentiation can occur in the absence of IL-7, as it was shown by Pribyl and LeBien40. Using in vitro cultures of
CD34++/CD19- HSCs isolated from human fetal BM, the authors generated CD19+ B cells
without addition of exogenous IL-7. Moreover, addition of anti-IL-7 neutralizing antibodies to those cultures did not affect the development and expansion of CD19+ cells40. This lack
of IL-7 requirement is further supported by patients with X-linked severe combined immunodeficiency (XSCID), characterized by mutations in the γc subunit of the IL-7R, who completely lose T cells without affecting B cell numbers41. In spite of this apparent human
IL-7-independent development of B cells, this cytokine still plays a role in cell survival, proliferation and differentiation during the early stages of B cell development42.
Additionally to its role in normal lymphoid development, IL-7 has also been associated with ALL development. Indeed, IL-7 is present in the leukemia
Introduction
that IL-7 increases viability and promotes cell proliferation of primary T-ALL cells, acting mainly through activation of the PI3K/Akt pathway31, 44, 45. In addition, IL-7 was shown to
accelerate leukemia expansion in murine xenotransplant models of T-ALL46. Regarding
B-ALL development, although some studies have demonstrated that IL-7 induces proliferation and survival of primary B-ALL cells, the response to IL-7 varies considerably among patients47, 48. There is also evidence that IL-7R expression is elevated in adult
patients with pre-B ALL49. Recently, somatic gain-of-function mutations in IL7R in pediatric
B-ALL patients have been described, hinting on the oncogenic potential of IL-7R-mediated signaling in B cells50. It should be noted, nonetheless, that mutational activation of the
IL-7R was frequently concomitant with aberrant expression of CRLF2, which together form a functional receptor for TSLP50.
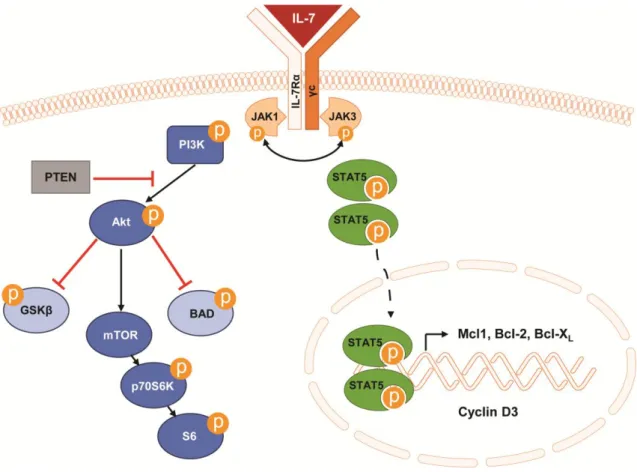
To exert its functions in cell survival and proliferation, IL-7 activates two important signaling pathways, JAK/STAT5 and PI3K/Akt/mTOR31 (Figure 4). Activation of these key
pathways has been extensively implicated in cancer in general and in ALL progression in particular. Importantly, mutations in elements of these pathways may impact on response to treatment51-53. The signaling is initiated by binding of the IL-7 to its receptor, which
induces dimerization of the IL-7R. This, in turn, brings the associated Janus kinases (JAKs) proteins (JAK1 in IL-7Rα and JAK3 in γc) together and leads to their transphosphorylation and activation54, 55. Activated JAKs are then responsible for the
phosphorylation of specific tyrosine residues on the cytoplasmic domain of the IL-7Rα subunit, thus creating docking sites for SH2-containing proteins, such as signal transducer and activator of transcription (STAT) proteins and phosphatidylinositol 3-kinase (PI3K)54.
JAK/STAT5 pathway
Once STAT5 (two isoforms: STAT5a and STAT5b) is recruited and activated by JAK-mediated phosphorylation, it dimerizes and translocates to the nucleus, where it acts as a transcription factor of several genes whose proteins are involved in cell viability, proliferation and cell cycle progression54. Such proteins include Bcl-2, Bcl-X
L, Mcl1 and
cyclin D3. Besides being activated in response to IL-7 stimulation44, 48, STAT5 can also be
activated upon mutational activation of the IL-7R50, 56. STAT5 is a crucial effector of IL-7
signaling during early B cell development, as demonstrated by the fact that expression of a constitutively active form of STAT5b (Stat5b-CA) largely restores B cell development in
Il7r-/- mice57. There is evidence that STAT5 is involved in IL-7-mediated cell survival of
pro-B cells by promoting the transcription of the Mcl1 gene58. However, its involvement in
Introduction
in the development of human B-ALL is mainly shown by constitutive activation of STAT5 in Ph-positive ALL cases, downstream of the BCR-ABL translocation, and in patients with CRLF2 overexpression in combination or not with activating mutations in JAK1 and JAK259-61. Mice with expression of a BCR-ABL cDNA in B cell progenitors developed a
disease that resembles human B-ALL only in the presence of STAT562, further supporting
the major contribution of this transcription factor in malignant transformation.
PI3K/Akt/mTOR pathway
Another signaling pathway activated downstream of IL-7/IL-7R axis is the PI3K/Akt/mTOR pathway. When activated by binding of the IL-7 to its receptor, PI3K, composed by a p110 catalytic subunit and a p85 regulatory subunit, is involved in the production of phosphatidylinositol (3,4,5)-trisphosphate (PIP3) at the membrane31, 63. This
event recruits and triggers the activity of the serine/threonine 3-phosphoinositide dependent protein kinases, PDK1 and PDK2, which are responsible for the phosphorylation and full activation of the serine/threonine kinase Akt/PKB. PDK1 phosphorylates a threonine residue (T308) within the kinase domain of Akt, whereas PDK2 phosphorylates a serine residue (S473) in the C-terminal domain of Akt31, 63. Once
activated, Akt activates or represses by phosphorylation a number of downstream targets, such as BAD, GSK3β and mTOR31. mTOR phosphorylates and thereby activates p70S6
kinase, which then phosphorylates the ribosomal protein S6, leading to an increase in protein translation at the ribosome. Overall, this pathway promotes cell viability and proliferation, inhibits apoptosis and controls cell metabolism31, 43, 63. The major negative
regulator of PI3K/Akt/mTOR pathway is the tumor suppressor PTEN, a lipid phosphatase that dephosphorylates PIP3 into PIP2, thus downregulating PI3K signaling31, 63.
In vivo studies have shown that PI3K/Akt/mTOR pathway regulates cell
proliferation of pre-B and also mature B cells, since mice deficient for the catalytic or regulatory subunits of PI3K have a block at the pre-B cell stage, with pro-B cells proliferating normally64, 65. However, it is not completely excluded a putative role of this
pathway in the survival of pro-B cells in response to IL-7 signaling, acting in concert with STAT514. Like the STAT5 pathway, the PI3K/Akt/mTOR pathway has also been
associated with ALL. For instance, constitutive hyperactivation of PI3K/Akt/mTOR is a very frequent event in pediatric patients with T-ALL, involved in promoting leukemic cell
Introduction
pharmacological inhibitors (Rapamycin) both in vitro and in vivo68, 69. It was also shown
that mutational inactivation or deletion of the PTEN gene is associated with poor prognosis of ALL, raising the possibility that this pathway may have prognostic value in ALL51, 52. However, there is also evidence that non-deletional PTEN posttranslational
inactivation occurs very often in both T-ALL66 and B-ALL70, which may be a confounding
factor in prognosis analysis based exclusively on the mutational status of PTEN.
Figure 4. Schematic representation of IL-7/IL-7R-mediated signaling through JAK/STAT5 and PI3K/Akt/mTOR pathways. Black arrows denote activation, whereas red bars indicate
Objectives
Objectives
Despite the significant improvements in treatment outcome over the last decades, around 10-20% of B-ALL patients still relapse and have very poor prognosis. So, there is an urgent demand for new prognostic factors predicting response to therapy. Given the importance of the PI3K/Akt/mTOR and JAK/STAT5 signaling pathways to B-ALL development, we decided to focus on these two critical pathways and evaluate the prognostic significance of their activation in B-ALL, at the protein level. Taken these reasons together, in the present thesis, we aimed to determine, for the first time, the levels of activation of PI3K/Akt/mTOR and JAK/STAT5 pathways in primary leukemia samples at the single cell level and correlate those levels with clinical parameters (such as MRD), in order to understand whether the activation status of these important signaling pathways have prognostic value in childhood B-ALL. To this purpose, we have used a flow cytometry approach with phospho-specific antibodies (phospho-flow) to analyze a retrospective cohort of pediatric B-ALL patient samples collected at diagnosis and for which we have collected clinical data. The reason why we selected the phospho-flow methodology relates to its potential applicability to actual clinical diagnostics.
The following specific aims were defined to accomplish the main goal:
1. Examine the basal levels of PI3K/Akt/mTOR and JAK/STAT5 signaling pathway activation for each patient sample.
2. Assess the levels of PI3K/Akt/mTOR and JAK/STAT5 activation for each patient sample upon ex vivo stimulation with IL-7.
3. Evaluate the sensitivity of the patient samples to IL-7.
4. Determine whether basal and/or IL-7-mediated activation of PI3K/Akt/mTOR and/or JAK/STAT5 signaling pathways may serve as prognostic factors.
In the first two specific aims, we have analyzed the phosphorylation levels of Akt, the mTOR downstream target S6 and STAT5.
By addressing these tasks, it was our overall goal to understand whether the activation status of PI3K/Akt/mTOR and/or JAK/STAT5 pathways has prognostic value in pediatric B-ALL.
Materials and Methods
Materials and Methods
Primary B-ALL samples and the NALM-6 cell line
Bone marrow samples from childhood B-ALL patients (n=58) were collected at diagnosis at the Pediatric Department of Instituto Português de Oncologia de Lisboa Francisco Gentil (IPOLFG) in accordance with the Declaration of Helsinki, after informed consent and proper internal Ethical Committee approval. Patient characteristics are summarized in Table S1 (see Supplementary Information). These samples were previously enriched by density centrifugation over Ficoll-Paque (GE Healthcare) and frozen in liquid nitrogen in a suspension of fetal bovine serum (FBS; Biowest) with 10% dimethyl sulfoxide (DMSO; Sigma). The human B-ALL cell line, NALM-6, was thawed and expanded in culture in RPMI-1640 culture medium with L-glutamine (Gibco) supplemented with 10% of FBS and penicillin/streptomycin (Gibco) (hereafter referred to as RPMI 10 medium) at a concentration of 0.5x10⁶ cells/ml at 37ºC in 5% CO
2. After three passages,
this cell line was frozen in the same conditions described above.
Intracellular phospho-specific flow cytometry
To assess the phosphorylation status of PI3K/Akt/mTOR and JAK/STAT5 pathways, primary leukemia and NALM-6 cells were thawed and cultured in RPMI 10 at 37ºC in 5% CO2 for 1 hour at a concentration of 2x10⁶ cells/ml and 0.5x10⁶ cells/ml,
respectively. Afterwards, cells were washed with PBS (Gibco), pelleted by centrifugation, and fixed with Cytofix buffer (BD Biosciences) for 10 minutes at 37ºC. Cells were then pelleted and permeabilized in ice-cold Perm buffer III (BD Biosciences) for 30 minutes on ice. The cells were first washed in PBS and then in Stain buffer (BD Biosciences), and stained with the following antibodies: CD79a-APC (BioLegend); CD3-eFluor 450 (eBioscience); pAkt S473-Alexa Fluor 488, pAkt T308-PE, pS6 S235/236-Alexa Fluor 488, and pSTAT5 Y694-Alexa Fluor 488 (all from BD Biosciences). Following a 30 minutes incubation at room temperature in the dark, cells were washed in stain buffer, resuspended in PBS and analyzed on an LSRFortessa (BD Biosciences). To measure the phosphorylation status of both pathways upon ex vivo stimulation with IL-7 (Prepotech), the same protocol was performed with an additional step: before fixing the cells, they were stimulated with 50ng/ml of IL-7 and incubated at 37ºC for 30 minutes. At least 100 000
Materials and Methods
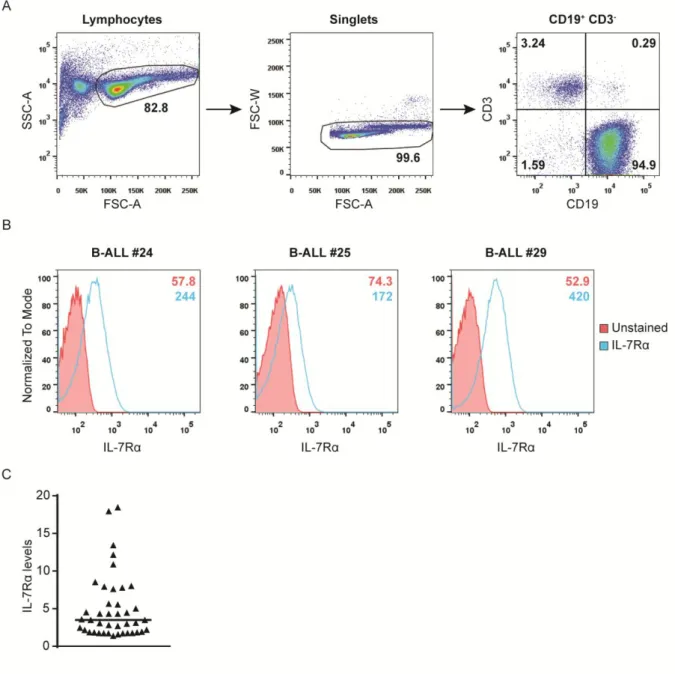
Analysis of IL-7Rα surface expression
The expression of the interleukin 7 receptor α chain (IL-7Rα or CD127) on primary ALL cells was assessed ex vivo by flow cytometry using a CD127-PE antibody (eBioscience). For the staining, cells were washed with PBS and resuspended in PBS with CD19-APC (eBioscience), CD3-APC-eFluor 780 (eBioscience) and CD127-PE. After 30 minutes of incubation at 4ºC in the dark, cells were washed with PBS and resuspended in 200µL of PBS. Next, samples were analyzed in an LSRFortessa cytometer. Data were collected using DIVA software, analyzed with FlowJo software and represented as the specific mean fluorescence intensity (MFI).
Assessment of cell viability and cell size
Cells were cultured in 96-well plates at a density of 2x10⁶ cells/ml at 37ºC with 5%
CO2 in medium only or with 10ng/ml of IL-7. At different time points (24h, 48h, 72h or
96h), cells were harvested and cell viability was determined by double-staining with APC-conjugated Annexin V (AnnV; eBioscience) and 7-AAD (BD Biosciences). Briefly, cells were washed with PBS and resuspended in 100µL of PBS with FITC-conjugated CD19 (eBioscience) and CD3-eFluor 450. After 30 minutes of incubation at 4ºC in the dark, cells were washed with PBS and resuspended in 100µL of binding buffer (eBioscience) with Annexin V and 7-AAD. After 15 minutes of incubation at room temperature in the dark, 100µL of binding buffer were added and the samples analyzed by flow cytometry using an LSRFortessa. Live cells were identified as the Annexin V and 7-AAD double-negative population and cell size was evaluated by FSCxSSC discrimination within the live cell population. Data were collected using DIVA software and analyzed with FlowJo software.
Protein Extraction and Quantification
Cells were harvested and centrifuged at 3200 rpm for 5 minutes at 4ºC to produce a cell pellet. After discarding the supernatant, the cell pellet was lysed in lysis buffer (50mM Tris-HCl pH 8.0; 150mM NaCl; 5mM EDTA; 1% (v/v) NP-40, 1mM Na3VO4; 10mM
NaF; 10mM NaPyrophosphate; supplemented with protease inhibitor cocktail Complete Mini (Roche)), supplemented with 1mM of AEBSF (Bio-Rad). Next, protein supernatants were collected by centrifugation at 13000 rpm for 20 minutes at 4ºC. The total protein was quantified by performing the Bradford assay (Bio-Rad). Before resolving the protein extracts, they were resuspended in Laemmli sample buffer (Bio-Rad) and denatured for 5 minutes at 95ºC.
Materials and Methods
Western Blot
Equal amounts of protein extracts were resolved by 12% SDS-PAGE and transferred onto nitrocellulose membranes by using a conventional transfer system (90 minutes, 400mA). Then, in order to check the effectiveness and uniformity of the protein transfer, membranes were stained with Ponceau S solution (Sigma). Subsequently, membranes were blocked for 1 hour with 3% milk diluted in Tris-Buffered Saline with 0.1% Tween 20 (TBS-T buffer) and immunoblotted with the following primary antibodies (previously diluted in TBS-T buffer): p-Akt (S473) (1:500) and Akt (1:1000) (Cell Signaling Technology); S6 (S235/236) (1:1000) and S6 (1:1000) (Cell Signaling Technology); p-STAT5A/B (Y694/Y699) (1:1000, Cell Signaling Technology) and STAT5 (1:1000, Santa Cruz Biotechnology); and actin (1:1000, Santa Cruz Biotechnology). The membranes were incubated with each antibody overnight at 4ºC under gentle agitation. As a reference, Precision Plus ProteinTM molecular weight marker was used (Bio-Rad). Next
day, the membranes were washed with TBS-T buffer for 25 minutes and incubated for 1 hour at room temperature under gentle agitation with horseradish peroxidase-conjugated secondary antibodies (anti-rabbit IgG (1:5000, Promega) or anti-goat IgG (1:5000, Santa Cruz Biotechnology), depending on the primary antibodies), diluted in 3% milk TBS-T buffer solution. After washing the membranes with TBS-T buffer for 25 minutes, immunodetection was performed by chemiluminescence detection using the Pierce ECL Plus Western Blotting Substrate (Thermo Fisher Scientific Inc.). Films exposed to the membranes were developed in a Curix60 (AGFA HealthCare).
Membrane Stripping
To re-probe the same membranes with new antibodies, the previous were removed through a stripping procedure. First, membranes were incubated for 30 minutes at 56ºC with slight agitation in stripping buffer (35mM Tris-HCl, 2% SDS, 1.42mM β-mercaptoethanol (β-ME), pH 6.7) supplemented with 14.2mM of β-ME (Bio-Rad). Afterwards, membranes were washed four times, being the first wash with water and the following ones with TBS-T buffer. At the end of the stripping procedure, the membranes were ready for a new immunoblot, starting from the blocking step of the protocol described above.
Materials and Methods
Proliferation Assays
Cells were cultured in flat-bottom 96-well plates at 2x10⁶ cells/ml at 37ºC with 5%
CO2 in RPMI 10 medium only or in the presence of 10ng/ml of IL-7. Cultures were
performed in triplicates for the indicated time points. To assess DNA synthesis, cells were incubated with 1µCi/well of [3H] thymidine (Perkin Elmer) for 16 hours before harvesting.
[3H] thymidine incorporation was measured by using a liquid scintillation counter (Perkin
Elmer). Average and standard deviation of triplicates were calculated.
Statistical analysis
GraphPad Prism version 6.01 for windows (GraphPad Software) was used to perform statistical analysis. Differences between groups were calculated using Student’s t test or One-way ANOVA, as appropriate. P values lower than 0.05 were considered statistically significant.
Results
Results
Diagnostic
ALL
samples
display
heterogeneous
levels
of
basal
PI3K/Akt/mTOR and JAK/STAT5 signaling pathway activation
An important association between the activation status of oncogenic signaling pathways and their capacity to predict response to therapy and risk of relapse in acute myeloid leukemia (AML) patients was demonstrated by Gary Nolan and his colleagues71.
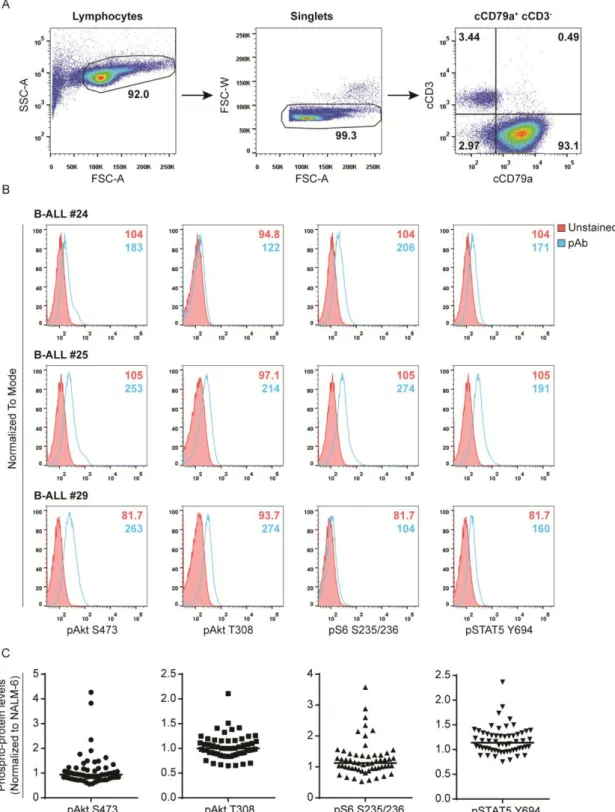
Given this evidence, we decided to start by analyzing the basal levels of activation of the PI3K/Akt/mTOR and JAK/STAT5 pathways ex vivo by flow cytometry for each patient sample (Table S1). Using phospho-specific antibodies and focusing only on B-ALL blast cells, identified by the expression of cCD79a (Figure 5A), we assessed the levels of phosphorylation of Akt (at serine 473 and threonine 308), the mTOR downstream target S6 (at serines 235 and 236) and STAT5 (at tyrosine 694) (Figure 5B). This methodology was first established by Nolan et al.71, and has been used and optimized in our lab70. In
order to compare the patients between them, the basal levels were normalized to those of the B-ALL cell line, NALM-6, used in this study as a reference. This reference was included in every experiment. Briefly, each phospho-protein level was first normalized to the unstained condition and, then, to the respective phospho-protein level of NALM-6, previously normalized to the respective unstained condition as well. Overall, we found a high degree of variability between patients regarding the basal phosphorylation levels of each protein analyzed (Figure 5C). Interestingly, and contrary to what has been shown by others, we did not find increased JAK/STAT5 signaling pathway activation in the two BCR-ABL-positive cases we studied (data not shown).
Results
Figure 5. Gating strategy and analysis of signaling pathway activation by phospho-flow cytometry. (A) Lymphocytes were included using a forward scatter area (FSC-A) vs. side scatter
area (SSC-A) gate. Single cells (Singlets) were then selected on a FSC-A vs. forward scatter width (FSC-W) plot to exclude signaling data from doublets. Cytoplasmic CD79a (cCD79a)+ and cytoplasmic CD3 (cCD3)- cells were selected and analysis of individual phospho-proteins at the indicated residues was performed in this cell population. (B) Examples of phospho-Akt (S473), phospho-Akt (T308), phospho-S6 (S235/236) and phospho-STAT5 (Y694) histograms for three individual B-ALL patient samples are shown. Background fluorescences from unstained cells were used as negative controls to define positivity in each channel. MFI for each condition (Unstained
vs. stained for each phospho-antibody) is presented within the histograms. (C) Levels of
phosphorylated Akt, S6 and STAT5 for all B-ALL samples, after normalization to NALM-6 levels. Points represent individual samples and horizontal bars indicate median.
Results
ALL samples show heterogeneous levels of PI3K/Akt/mTOR and JAK/STAT5
pathway activation in response to IL-7
Previous studies in AML have shown that the response of a leukemic cell to exogenous stimuli may have prognostic value71. Moreover, there is evidence indicating
that IL-7, which is present in the leukemia microenvironment, can contribute to leukemia progression and drug resistance in vitro and in vivo46, 68. Therefore, we sought to
understand whether the response of B-ALL cells to a pro-survival stimulus, such as the one induced by IL-7, may have prognostic value. To this end, we started by analyzing the response of B-ALL cells to IL-7, by examining its effects on specific signaling pathways, namely PI3K/Akt/mTOR and JAK/STAT5.
We cultured primary B-ALL samples for 30 minutes in the presence or absence of IL-7, and, afterwards, evaluated the levels of phosphorylation of Akt, S6 and STAT5, to assess the effects of IL-7 on PI3K/Akt/mTOR and JAK/STAT5 pathways, respectively (Figure 6A). We used the same methodology and gating strategy as described above (Figure 5A). As shown in Figure 6B, the majority of B-ALL samples responded to IL-7 with activation of PI3K/Akt/mTOR, JAK/STAT5 or both pathways. Of note, the level of response varied considerably between patients (Figure 6A and 6B).
Importantly, to validate our phospho-flow results, we have further measured the expression and phosphorylation of Akt, S6 and STAT5 proteins by western blot. This was performed for eight patients, for which we had sufficient biological material. In agreement with what we observed by flow cytometry, similar qualitative results were obtained by western blot. IL-7 stimulation led to the upregulation of STAT5 phosphorylation in all patient samples and of Akt phosphorylation in seven out of eight samples, without affecting total protein levels (Figure 6C). Regarding the phosphorylation levels of S6, IL-7 mildly increased those levels in four out of eight primary samples (Figure 6C). However, in contrast with our phospho-flow analysis, phospho-STAT5 in medium condition was barely detected by western blot (Figure 6C). It is important to refer that although the qualitative tendency was the same using both techniques, the absolute fold changes calculated by each one differed considerably (data not shown).
Results
Figure 6. Heterogeneity of IL-7-mediated signaling responses in B-ALL patient samples. (A)
The levels of Akt (S473), S6 (S235/235), and STAT5 (Y694) phosphorylation in response to IL-7 stimulation (50ng/ml; 30 minutes) were quantified by flow cytometry analysis using phospho-specific antibodies. Examples of three individual B-ALL patients are presented. Background fluorescences from unstained cells were used as negative controls to define positivity in each channel. MFI for each condition (Unstained in medium condition vs. stained for each phospho-antibody in medium or IL-7 conditions) is shown within the histograms. (B) Levels of phosphorylated Akt, S6 and STAT5 normalized to medium condition for all B-ALL samples are shown. Points represent individual samples and horizontal bars indicate median. (C) Primary B-ALL cells (n=8) were stimulated for 30 minutes with control solution (non-stimulated) or 50ng/ml of IL-7, and levels of expression and phosphorylation of Akt, S6 and STAT5 were analyzed by immunoblotting. β-actin was used as loading control.
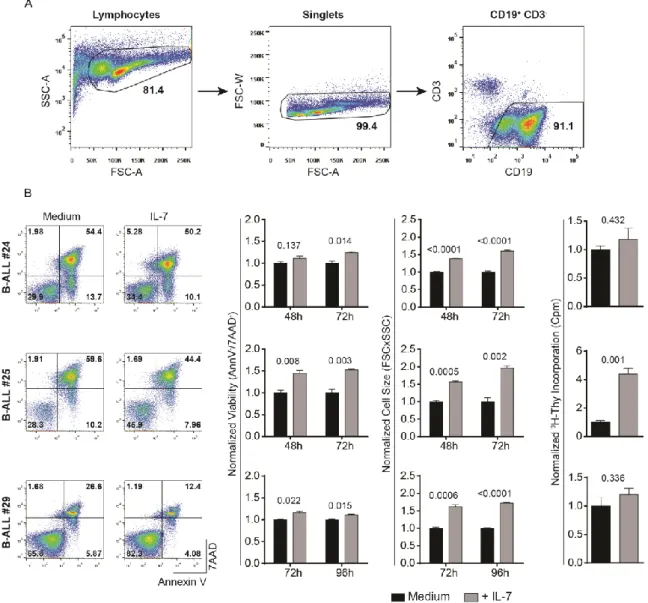
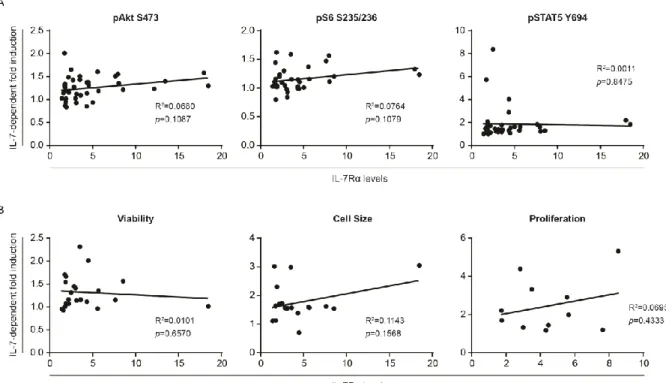
High degree of heterogeneity of functional responses to IL-7 and IL-7Rα
expression in primary ALL samples
In order to correlate the levels of signaling activation in response to IL-7 with the functional output, we carried out functional analyses in response to IL-7. It is important to have in mind that IL-7 has been implicated in promoting both viability and cell cycle progression in leukemic cells. We started by analyzing the effects of IL-7 on cell viability. Thus, we cultured primary ALL cells in the presence or not of IL-7 and, at pre-defined time points, we performed flow cytometry analysis of Annexin V/7AAD staining and FSCxSSC discrimination to evaluate the impact of IL-7 on viability and cell size (an indirect measure of proliferation), respectively (Figure 7A and 7B). The majority of the patient samples were sensitive to IL-7 addition, although to different extents. Overall, IL-7 incubation led to a significant increase in the frequency of live cells (Annexin V and 7AAD double-negative) and a decrease in the frequency of early apoptotic cells (Annexin V positive and 7AAD negative) and late apoptotic or necrotic cells (Annexin V and 7AAD double-positive) (Figure 7B). Also, it was observed a significant increase in cell size of primary ALL cells after incubation with IL-7, indirectly hinting on an increase in cell proliferation (Figure 7B). Whenever possible (n=11), we also directly determined the effects of IL-7 stimulation on cell proliferation by thymidine incorporation assays. In general, leukemic cells responded to IL-7 by increasing their proliferation, although to different levels (Figure 7B). These findings support the notion that IL-7 stimulation promotes both cell viability and cell proliferation of B-ALL samples, albeit in a heterogeneous way. When we compared the molecular and functional analysis, we did not find any correlation between the levels of