MASTERS OF
ACTUARIAL SCIENCE
MASTERS FINAL WORK
INTERSHIP REPORT
Discount Rates Impact on Actuarial Valuation of
Dutch Pension Funds
Determining Discount Rates and Sensitivity Analysis on Pension
plans in Netherlands
PAULA BARUGA ATUHAIRE
MASTERS OF
ACTUARIAL SCIENCE
MASTERS FINAL WORK
INTERSHIP REPORT
Discount Rates Impact on Actuarial Valuation of
Dutch Pension Funds
Determining Discount Rates and Sensitivity Analysis on Pension
plans in Netherlands
PAULA BARUGA ATUHAIRE
Report Supervisors
Supervisor (ISEG): Fátima Pires Lima
Supervisor (Mercer): André Herdade
I
ABSTRACT.
Discount Rate is one of the main assumptions to be used when determining the future liabilities of any pension plan. After the financial crisis in 2008, different sectors of the economy had to adapt to the changes in the financial situations, to do this the pension sector had to revisit its measures on how to maintain a sustainable funding ratio for the future pension payments of future and current pensioners.
In this report, the different ways in which the discount rates were determined in the Dutch pension plans after the crisis by using different methodologies are discussed. The essay goes a step further to investigate how an effective discount rate is determined during the internship process using the Mercer Yield Curve (MYC) in conjunction with the durations of the different pension plans. After the discount rate has been determined, we then analyse how sensitive the plan liabilities are to changes in the discount rate. The analysis involves estimating the plan liabilities with the sensitivity run discount rates and analyzing the impact on the liabilities for plans with both actives and inactives members. We consider inactive members to be the deferred participants and the pension plan current pensioners. We made use of the “Tool Uitkeringstromen”, Retirement Studio (Mercer) software and the Mercer Yield Curve (MYC) reports for our analysis, and the graphics were produced using Excel.
Keywords: Discount Rates, Sensitivity Analysis, Netherlands.
RESUMO.
A taxa de juro é um dos principais pressupostos na determinação das obrigações futuras de qualquer plano de pensões.
Após a crise financeira de 2008, diferentes setores da economia viram-se obrigados a adaptar-se às mudanças na situação financeira global. Não sendo exceção, a indústria de fundos de pensões teve que rever as suas políticas para manter um nivel de financiamento sustentável das responsabilidades inerentes aos futuros pagamentos de pensões.
II
Neste relatório, são descritas as várias formas de determinação da taxa de juro nos planos de pensões Holandeses após a crise, através de diversas metodologias.
Adicionalmente, no processo de estudo da determinação da taxa de juros, é usada a curva de rendimento da Mercer (MYC) em conjunto com as durações dos diferentes planos de pensões.
Após a determinação da taxa de juros, analisamos a sensibilidade dos passivos do plano às variações na taxa de juro.
Esta análise consiste em estimar as responsabilidades do plano a partir da variação da taxa de juro e analisar o impacto sobre as responsabilidades dos planos de membros ativos e inativos. Consideramos inativos os ex-activos com direitos adquiridos mas que ainda não se encontram a receber pensão e os beneficiários que já se encontram a receber pensão.
Na nossa análise, utilizámos uma ferramenta especifica da Mercer de Holanda “Tool Uitkeringstromen”, o programa Retirement Studio (Mercer) e a Mercer Yield Curve (MYC). Todos os gráficos obtidos foram produzidos no Microsoft Excel.
III
TABLE OF CONTENTS
ACKNOWLEDGEMENTS ... VIII 1. INTRODUCTION ... 1 1.1 Motivation ... 1 1.2 Research Objective ... 2 1.3 Internship Process ... 21.3.1 Roll Forward Valuation ... 3
1.3.2 Full Valuation ... 4
2. PENSION SYSTEM IN THE NETHERLANDS ... 5
2.1 Current Pension System ... 5
2.1.1 First pillar: State pension ... 5
2.1.2 Second pillar: Occupational pension ... 6
2.1.3 Third pillar: Private pension. ... 7
2.2 Developments of the Discount Rate in Dutch Pension systems ... 8
2.2.1 The new prudential Financieel Toetsingskader (FTK) ... 8
2.2.2 September Pension Package ... 9
2.2.3 Latest Developments ... 10
2.3 Valuation process of Defined Benefit Pension Benefit in the Netherlands. ... 11
2.3.1 Actuarial assumptions ... 11
2.3.2 Forms of Valuation of Dutch Pension Funds ... 13
3. DETERMINING DISCOUNT RATES ... 16
3.1 Determine the form of valuation to be applied in the scheme valuation: ... 16
3.1.1 For Accounting valuations ... 16
3.1.2 For Funding valuations ... 16
3.2 Development of discount rates in Netherlands Valuations. ... 17
3.3 Mercer Yield Curve – Eurozone Cash Flow Discounter ... 21
3.3.1 Constructing the Mercer Yield Curve (Eurozone MYC). ... 22
3.4 Discount Rates for sample plans ... 26
3.5 Empirical calculation to determine the Discount Rate using the MYC yield curve. ... 26
3.6 Converting the cashflows to determine a single effective discount rate ... 28
IV
4. SENSITIVITY ANALYSIS OF DISCOUNT RATES ... 30
4.1 Sensitivity Analysis on Sample plans ... 32
4.1.1 Inactives Pension Plans members... 32
4.1.2 Active Pension Plans ... 35
4.1.3 Combined Actives and Inactive pension plans. ... 36
4.1.4 Combined Plans Vs Inactives Plan ... 38
4.2 Duration Vs Convexity... 38
4.2.1 Duration Analysis of Inactive pension plan members. ... 39
4.2.2 Duration Analysis of Active pension plan members. ... 40
4.3 Additional sensitivity runs on Pension plans assumptions ... 41
4.3.1 Salary Increase Rate ... 41
4.3.2 Inflation Rate ... 42
4.3.3 Mortality Assumption ... 42
5. CONCLUSION ... 43
REFERENCES ... 45
A.1. Estimating Future Cashflows. ... 47
A.2 Determining the Discount Rate. ... 49
V
LIST OF FIGURES
Figure 3.1: The trend movements of Discount Rates determined by the MYC with different
durations. Source: Eurozone Mercer Yield Curve (Mercer, 2017) ... 19
Figure 3.2: The Discount Rates determined by the MYC with different durations of the past months. ... 20
Figure 6.3: Extract from the “Tool Uitkeringstromen”. Source: Mercer calculations ... 47
Figure 6.4: Figure of the final Roll forward cashflows. ... 48
Figure 6.5: Extract from the Eurozone Mercer Yield curve (Mercer, 2018a). ... 49
VI
LIST OF TABLES
Table 3.1: The Discount Rates correspondent to the different Scheme profiles with different durations ... 26 Table 4.2: Sensitivity liabilities for plans with inactive participants (Deferreds and
Pensioners). ... 33 Table 4.3: Sensitivity liabilities for plans with all participants (Actives, Deferreds and Pensioners). ... 37 Table 4.4: Sensitivity impact on liabilities using Durations for plan with inactive
participants (Deferreds and Pensioners) ... 39 Table 4.5: Sensitivity impact on liabilities using Durations for plans with all participants (Actives, Deferreds and Pensioners). ... 40
VII
LIST OF ABBREVIATIONS
Abbreviations MeaningAOW Algemene Ouderdomswet
DB Defined Benefit DC Defined Contribution DNB De Nederlandsche Bank DR Discount Rate EA Entry Age FTK Financieel Toetsingskader FV Full Valuation
IFRS International Financial Reporting Standards
MMC Marsh & McLennan Companies
MYC Mercer Yield Curve
NRA Normal Retirement Age
PAYG Pay-as-you-go
PPI Pension Policy Institute
PVB Present Value of Benefits
RF Roll Forward
S&P Standard & Poor’s
UFR Ultimate Forward Rate
UK United Kingdom
USA United States of America
USGAAP Generally Accepted Accounting Principles (United States)
VA Valuation Age
VIII
ACKNOWLEDGEMENTS
I give the utmost gratitude to God Almighty for the vision, inspiration and guidance throughout my academic career.
To Mercer Portugal, for giving me the opportunity to put what I learnt in practice in order to finish under the guidance of my supervisor, André Herdade who spared time to teach, advise and guide me through the internship process.
I would like to send my appreciation to Professor Fátima Pires Lima, for availability, support and attention to detail in getting this report to an acceptable academic standard. Special thanks to out to my family, my mother and brothers, who supported me throughout my academic journey. I acknowledge the constant motivation that I received from my friends, Arta Zajmi, Stephanie Lucic and Rodrigue Kazzi, to mention but a few for the moral support when writing this report.
To everyone that was involved way or another in the completion of Masters, I say thank you.
1
1. INTRODUCTION
1.1 MotivationDiscount Rates are at the heart of most actuarial calculations, and discount rates may implicitly reflect some of the underlying risk. In the year 2012, the dawn of the European crisis, Dutch pension funds faced a dual challenge of disappointing asset returns and low interest rates, resulting in a decline of their funding ratios. The Dutch pension system differs from many other systems in that a greater part of an individual final pension is funded from the occupational pension funds operating in the private sector. The significant pension savings accumulated over the years of service help to overcome the burden placed upon the statutory pension plan or non-funded pension systems. However, this also means that these plans are highly susceptible to the negative effects of risks of a financial crisis. The emergence of this crisis brought about the most contentious debate on the choice of the appropriate rate to discount future pension benefits. (Beetsma et al, 2015)
The Dutch Central Bank, De Nederlandsche Bank, (DNB) regulated the pension plans using its Financial Assessment Framework, Financieel Toetsingskader, (FTK), with its market-based valuation of liabilities, was introduced in January 2007. (Beetsma et al, 2015). The aim of the FTK was to ensure that pension plans were fully funded, and the required funding levels it sets were demanding by international regulatory standards. The framework was tabled and published in 2010 and it exposed the structural problems in the design of occupational pension plans especially with the standard sustainability of the fund and the consequences of the newly realized longevity risk. The new framework was discussed extensively both internally and externally with the general public until a consensus was reached, a framework to induce greater stability in the underlying economic policies to be followed by the pension fund, to avoid major shifts in the value of the pension contract between generations and to enhance the system’s sustainability with regards to rising longevity.
During the reform process to get the “perfect” interest rate to be applied to discount the pension liabilities, the discussions have been intense. The importance of the discount rate lies in the fact that it is an important determinant for the distribution payments values of
2
fund assets across the participating cohorts. Since the crisis, there have been adequate measures taken to stabilize the discount rate such that it does not go too low, increasing the liabilities and unwelcome pressure on the fund assets and surplus available.
Setting the suitable discount rate is imperative to present an adequate pension plan with the appropriate/sustainable funding valuation (ratio). This discount rate is then used to calculate the present value of expected benefit payments. More importantly it’s important when projecting values as contributions for a Defined Contributions (DC), used as the expected rate of return on assets in some instances, implicit in the asset allocation and in settlement of new investment strategies.
1.2 Research Objective
Given the value of the funds’ assets, an increase in the discount rate shifts value from younger to older cohorts and vice versa. This discussion has been fueled by the extremely low interest rates dropping to unprecedented levels; as a result there has been a sharp increase in the value of liabilities while the value of assets has not kept up. Even with increased contributions from pension plan sponsors, funding ratios have declined to levels that had caused concern to the stakeholders involved. With the different endeavors that have been undertaken by the Dutch regulators and sponsors, in the project, our objectives are:
i. To study the different ways to determine the Discounts Rate required in funding Defined Benefit (DB) plans.
ii. The impact of the discount rate sensitivity in pension plan liabilities, go a step further to determine the influence of the set discount rate on other set assumptions in a pension plan.
1.3 Internship Process
This work is a result of an internship carried out at Mercer Services (Portugal), Lisbon Wealth Analytical Services (WAS), which operates under the Marsh & McLennan Companies (MMC) umbrella. This curricular internship lasted a period of five months which was adequate enough to formulate this analysis for the Internship Report, as such due to the new EU privacy restrictions, the plans schemes or names will expressed as XYZ. The Lisbon WAS is the hub for most European Mercer valuations extended from other
3
countries to Portugal, valuations for countries like Netherlands, UK, Germany, Spain, Ireland, USA, Portugal to mention but a few, all these sum up to 13 countries. This internship work was mainly focused on Netherlands valuations.
During the internship, internal software and calculation formats, templates and VBA (Macros) Excel tools were used. The process of valuation did not alter much from one plan scheme to another, the noticeable difference that determined the change of the valuation process was either if the calculation was a Roll Forward (RF) or a Full Valuation (FV). The major distinction between the two valuations is that;
1.3.1 Roll Forward Valuation
When performing a Roll Forward, there is no update of participant data in its entirety except for special events like a Plan Amendment. The liabilities and benefit cost are determined by a change in valuation assumptions. Roll forward period differs identically to each plan, depending on the valuation date of the last full valuation, could be months or years. A company/consultant would go in for a RF if it doesn’t except a significant change in census data or participant number, with this method, the actuary is able to determine the present value of liabilities taking into account the discount rate.
Projected Benefit Obligations (PBO): The actuarial present value of benefits, vested and non-vested, attributed to the pension formula to employee past services, based on employees’ future salary levels.
More formally when the roll forward period is known, then the PBO is estimated by:
𝑃𝐵𝑂𝑡= 𝑃𝐵𝑂𝑡−1∗ (1 + 𝑖 ∗ 𝑅𝐹𝑡) + 𝑁𝐶𝑡+ 𝐼𝐶𝑡− (𝐸𝐵𝑃𝑡∗ 𝑅𝐹𝑡) (1.1)
Where
𝑃𝐵𝑂𝑡 is the Projected Benefit Obligation for the current year end valuation. 𝑃𝐵𝑂𝑡−1 is the Projected Benefit Obligation for last year end valuation. 𝑖is Interest (discount) rate used to discount liabilities.
𝑅𝐹𝑡 is the Roll Forward period measured in years.
4
𝐼𝐶𝑡 is the Interest Cost for the current year end valuation.
𝐸𝐵𝑃𝑡 is the Expected Benefit payment for that financial year.
Therefore the Roll Forward PBO is then considered as the expected liability to the employers or plan sponsors for the end of the year. These terminologies will be discussed further in greater detail through the course of the report
1.3.2 Full Valuation
In this case, we have new census data for the new valuation. Its entails a complete understanding of the benefits and new accrual methods if any, all this analysis is done during the Data treatment process for the new data. After the data treatment is complete, the liabilities and benefit cost are also defined using the suggested assumptions from the consultant. With a FV, the actuary is able to determine the individual impact on the liabilities of each member extensively.
5
2. PENSION SYSTEM IN THE
NETHERLANDS
In this chapter the pension system of the Netherlands will be discussed, it introduces the basic notion of pension schemes which will be required throughout the text.
2.1 Current Pension System
The government obligates most working people to participate in the pension system, in this way the lower income earners will have a guaranteed pension after retirement at the retirement age. The risk sharing in the pension fund is on the most part based on solidarity for all. In the Netherlands, a pension benefit in retirement consists of three main pension pillars:
1. State sponsored pension
2. Occupation pension accrued by the employer and employee 3. Private pension
2.1.1 First pillar: State pension
The first pillar of the Dutch pension system is the state pension. Also called the “Algemene Ouderdomswet” (AOW) was started in 1957. (Beetsma et al, 2015)
Through the AOW the Dutch government provides all inhabitants older than the legal pensionable age with a basic pension income. The benefit is flat, hence independent of an individual’s wage history. All residents older than 15 and living in the Netherlands are insured till the age of 67 and 1 month. Each year you live in the Netherlands between age 15 and 67 counts for 2% of the total benefit. The value of the benefit differs for single and married people. For a single person the payment is approximately 70% of the minimum wage, while married or co-habiting persons receive 50% of the minimum wage. Since the AOW pension is on a Pay-as-you-go (PAYG) basis scheme, the contributions are paid by the working population are immediately used to finance the benefits for the current beneficiaries. With the population getting older and living longer, more people retire every year and the working population is decreasing, the PAYG becomes more expensive each
6
year. Therefore there is a lot of discussion about the cost of the state pension. This has led to the recent raise of the Normal Retirement Age (NRA) to 68 as at beginning of 2018.
2.1.2 Second pillar: Occupational pension
The second pillar, the occupational pension, is organized at the level of the employer and is part of the terms of employment agreed upon by the social partners (representatives of employer and employee organizations). Over 90 percent employees in the Netherlands participate in an occupational pension scheme. (PPI, 2014)
Pension schemes can be administered by a pension fund or by an insurer. There are three types of pension funds:
Industry-wide pension funds (bpf): All companies in the industry are obliged to participate in the offered pension scheme. The government decides whether an industry gets an industry-wide pension fund. The only exception is that when a company offers its employees a better or equal pension scheme than the industry-wide pension fund does, then in that case, the company can offer its superior pension scheme.
Professional pension funds: some professions have their own pension plan; in that case the pension contract for that profession is mandatory.
Company pension funds (opf): if a company isn’t obliged to join an industry-wide or professional pension scheme, it can start its own pension fund, it doesn’t have to however.
The accrual of pension is exempt from taxes; taxes are paid whenever a pension benefit is in payment. The pension funds can provide different types of pensions. The pension Act describes three different types of pension schemes:
A defined benefit argument (DB): This is a guaranteed pension benefit where the contribution varies. The final pay plan and the average pay plan are the two types of DB schemes. The final pay plan guarantees a pension entitlement based in the career end salary whereas the average pay plan guarantees a pension entitlement based on the salary earned on average in a career. In a DB scheme, the employer
7
bears all the risk (except the default risk) and makes contributions which cover the statutory funding ratio and these contributions are expected to be sufficient to cover the benefits. The FTK, however, may require a higher level of contribution from the sponsors, to reflect the actual scheme experience or to cover any existing scheme deficit.
A defined contribution agreement (DC): In this case, the benefit is not guaranteed, but the contribution is fixed. The pension benefit accrued at retirement, when received as a pension, will depend on the interest rate used to discount payments, change of mortality rates and changing value of investments. This type of pension involves more risk for participant with the transference of the major risks from the company (sponsor of the pension fund) to the employee (individual member). In recent years more and more companies have changed their DB agreements to DC agreements to reduce their risk.
An agreement to payment of a capital sum: Each year a part of the guaranteed capital is accrued, sometimes raised with profit sharing. The capital at retirement should be used to purchase a pension benefit at the pensionable age. During the accrual period, the investment risk is for the pension provider. The interest rate risk in this scheme is fully borne by the participant. This type of pension is not common in the Netherlands.
An important part of the Pension Act is that a pension fund and the sponsoring company should be strictly separated. This is done to prevent that when the company goes bankrupt the pension fund will go bankrupt as well. Otherwise the employees will not only lose their jobs but their pension entitlements too.
2.1.3 Third pillar: Private pension.
The third pillar is there to facilitate the opportunity to accrue private pension with the advantage of tax benefits as long as you stay within the fiscal boundaries. This makes it possible to accrue extra pension benefits for people who want a higher pension on top of their additional pension or people without a pension agreement or an employer who wants to pay for an extra pension. As long as the participant stays within the fiscal boundaries, this pension is handled with the same tax benefits as in the second pillar.
8
It is made on a voluntary, individual basis. This type of pension provision consists of life insurances, individual annuities or specifically labelled savings. Banks and insurance companies are the typical providers of these types of pension products.
In the remainder of this paper, we will focus our attention on the second pillar; we will mainly discuss the methodology of determining the discount rate for the liabilities and their sensitivity to the change in Discount Rates.
2.2 Developments of the Discount Rate in Dutch Pension systems
Due to the financial crisis and the ageing population, the sustainability of the current pension system is at risk. In recent years many suggestions have been done and plans have been made to change the current pension system. In this section an overview of the suggested changes is given.
2.2.1 The new prudential Financieel Toetsingskader (FTK)
The FTK for pension funds, supervised by the DNB, requires annual valuations to determine funding ratios against plans “minimum regulatory own funds”. The funding ratio is the total assets as a percentage of total liabilities for benefits accrued, with the liabilities excluding any allowances for future increases, and calculated with a discount rate that is broadly risk free. The FTK with its market-based valuation of liabilities was introduced in January 2007. (Marossy & Gilfedder, 2012)
As result of the Global Financial crisis that hit late 2007, the average funding ratio of the Dutch occupational pensions fell from over 150% in 2007 to just 92% in 2009. This led to the fall of equity prices which reduced assets and low interest rates which then reduced the discount rates and increased the present value of liabilities. After a modest recovery in 2010, the funding levels then fell back down to 94%-99%in late 2011 and early 2012. The global crisis came as a shock to the rather healthy well-funded Dutch pension system and so did the sudden funding gaps especially for the funds that had not yet hedged their interest rate exposure as they experience large fall in funding levels.
9
In response to the emerging funding shortfalls, an immediate step was taken to soften the blow to plans: the DNB announced that recovery plan periods would lengthen form three to five years to enable pension plans get recovery plans to restore them to over 105% funding levels. And it was also agreed that any recovery plans that include the reduction in pension rights would not begin until April 2012 at the earliest, although a majority of the plans were still unable to reach the 105% bench mark. The additional suggestions were to increase contributions, capital injections from sponsoring employers or as a last resort, a reduction in both pensioners’ benefits and the accrued entitlements of members of the working age.
2.2.2 September Pension Package
In September 2012 (Beetsma et al, 2015), the government formed the September package in consultation with the DNB and the Pension federation. The September Package formulated as a “future proof” pension system because the new FTK was delayed and hence it focuses mainly on the year 2013 and included the following suggestions:
The introduction of the Ultimate Forward Rate (UFR) in the calculation of pension liabilities, which is also the rate used within the Solvency II framework for insurers who were also supervised by DNB. The 3-month average yield curve is manipulated in the long end more stable and less sensitive to short term fluctuations in the financial markets by using an UFR of 4.2% in 2012.
Ultimate Forward Rate (UFR) is the interest rate for very long durations (over 20 years), which was set at 4.2% for the year 2017, at 4.05% for the year 2018 and at 3.90% for the year 2019 for the Euro Area. This is ultimately the upper bound of the interest rate term structure.
As a result, the pension plans funding positions improved to an average of 102% because the UFR of 4.2% was significantly higher than the prevailing discount rate at the time. Its introduction was not without controversy, as there were associated concerns around intergenerational fairness and transfers from younger generations to the old.
There was also an option to spread the possible benefit cuts which allowed maximizing a benefit cut of 75% immediate and the rest would be realized later. There was a suggestion to increase the pensionable age 65 to 67 as at 1st January
10
2013 instead of 1st January 2014, a type of adjustment mechanism where the indexation would become conditional to an increasing life expectancy and only granted if the funding ratio was 110% or higher.
2.2.3 Latest Developments
The discount rate that funds apply to calculate their liabilities has been changed several times; 2007 saw a switch from a fixed rate to discounting based on the risk free term structure in the market; then came December 2011 where the discount rate was changed to the moving average over the past three months of the market term structure of risk-free interest rates. As mentioned above, the UFR was then introduced in the discount curve which was beneficial for the funding ratios as well the three-month moving average of the term structure for discounting for some periods, depending on the trend in interest rates of the prior three months. (PPI, 2014; Keijzer, 2014)
After many negotiations, the Dutch cabinet finally approved proposed changes to the FTK. The changes were mainly focused on tightening up the existing nominal contracts and include a range of measures which, as a package, clarify the new processes for funding valuations, recovery plans and remedial action when a pension fund is underfunded. The suggested measures below will be allowed provided that:
Discount rates will be based on the new UFR approach from 2015 onwards so as to lower discount rates compared to the current approach.
Higher solvency buffers will be required in order to secure the legally required degree of actuarial certainty.
As an alternative to the solvency buffer, the use of a smoothed discount rate over (maximum) 10 year period to determine the required contributions (additional) will be allowed. Also possibly the use of the expected return on assets as the discount rate for determining the required contributions under certain conditions.
A 12-month-moving-avergae funding ratio to replace the current point estimate funding ratio.
An extended recovery period, a rolling 10 year recovery plan to get the funding ratios up to around 130%.
11
Benefit reductions amounting to one tenths of the deficit will be required if the full funding ratio is not expected in 10 years.
Further reductions in benefits are required if funding level are below 105% for six consecutive annual measurement dates.
The increase in contributions requirement has been dropped since it only affects active members, otherwise its accepted.
Schemes are required to outline they intend to deal with funding deficiencies in the future ahead of time.
Finally, in January 2015, the three-month-moving-averaging effect in the discount curve was abolished.
2.3 Valuation process of Defined Benefit in the Netherlands.
Financial institutions like DB pension plans, with liabilities contingent on survival, need to set aside reserves or funds to meet their payment obligations. Indeed, the scheme funding requirements of the Pension Act 2004 (Van der Wal, 2014) focus on the value to be paced on a scheme’s liabilities. The amount necessary is dependent on when and for how long the benefits are to be paid for in the case of demographic assumptions and the amount of the benefit to be paid in the case of economic assumptions.
An actuarial valuation is an assessment which requires an actuary to advise the company sponsoring the fund on the choice of prudent actuarial assumptions to assess the financial health of the pension scheme as it is a requirement stated by the DNB, that the pension funds are financially healthy and can be expected to fulfil their obligations in the future.
2.3.1 Actuarial assumptions
There are two main types of actuarial assumptions
1) Economic assumptions; Assumptions relating to future economic factors which will
12
a) Discount Rate or Interest Rate: This is the rate used to discount future benefits, thus determining the plan liabilities, and should be a rational expectation of the future rate of return on the plan assets.
It is usual to have two separate assumptions for the discount rate: one for preretirement, and the other for post-retirement. The difference lies in the duration of the liabilities for pensioners and non-pensioners. The lower the discount rate, the more conservative the valuation of liabilities will be, and vice versa.
b) Inflation: Benefits are often linked to price inflation (both pre and post-retirement), so projected benefits will depend on the level of inflation assumed for the future. The actuary must determine the evolution of the consumer price index (CPI) and the retail price index (RPI), and the inflation forecasts, when setting the inflation assumption.
c) Salary scale: In case the benefit is dependent on the final salary on retirement (or on exit from the scheme, or on death), a salary scale assumption should be set to calculate the projected benefits. This assumption reflects expected inflation, productivity growth, merit scale, and other factors that affect wages.
d) Pension Increase: This can be considered as an increase rate in the after retirement “salary”, it would depend on factors like the age, past service and productivity of the plan participant. This rate can be set by considering a specific plan sponsor with similar characteristics and using its historic and current data as well as the current market conditions like inflation.
2) Demographic assumptions: These are assumptions required to project how long the
benefits are expected to be payable; and hence how much money a pension scheme needs to meet its liability. We explore some components of demographic assumptions in more details below.
a) Mortality tables: Analogous to a discount rate which accounts for the time value of money, the plan must assume mortality rates, both pre-retirement and post-retirement. A mortality rate is an assumed probability of dying within a year, whereas longevity refers to the future expected lifetime derived from any set of mortality rates. High mortality rates will either increase or decrease the total benefits to be paid, depending on how the value of the death benefits compares with
13
the benefits payable should the member have survived. Since mortality is mostly uncertain, the actuary must check the consistency of the mortality tables used in the valuation to the actual death experienced, and update the tables to reflect the plan's mortality experience. An assumption that reflects the scheme's experience ensures more certainty in the expected liabilities.
b) Withdrawal rates: Assumptions which reflect the termination that can be expected to occur each year at each age. Schemes hope to profit from members leaving service, as the deferred benefit is only subject to price inflation and not to a salary increase. Thus, higher withdrawal rates reduce the amount of total expected liability. In case of vested rights, the Dutch law requires the transfer values to be at least equal to the cash equivalent of the deferred pension benefits accrued.
c) Disability rates: In case of allowance for a disability benefit, an assumption is needed to assess the amount to be paid. Depending on the benefit rules set on disability, lower assumed disability rates might decrease the amount of expected liability. Disability rates can be calculated partly through some analysis of national disability rates. However, the nature of the industry and the terms of schemes vary significantly; thus a study of credible data from the scheme experience should be considered (when available) in developing the decrement table.
2.3.2 Forms of Valuation of Dutch Pension Funds
Dutch pension schemes are required to be valued at least once each financial year, this assessment is necessary to conform to the legal and regulatory guidelines set up by the DNB while also following the Pensions Act 2004. The scheme managers have to inform the regulator about the health of the scheme, as well as for security and financing purposes, as they have to review the funding ratios, investment strategies and study the scheme’s solvency position. There are three main types of valuations, and the purpose of a valuation drives the kinds of assumptions to be used. (Schmitz et al, 2015)
a) Solvency Valuation: One of the main objectives of Dutch pension funds valuation is to preserve the schemes’ solvency, in other words, to ensure the ability of the scheme to meet the long-term financial obligations. The solvency valuation is valued regarding “discontinuance”. In practice, the pension regulator, DNB introduced a rule on the
14
minimum solvency requirements for all defined benefit plans. It assumes the scheme discontinues at the valuation date (all active members are evaluated as deferred pensioner) but the deferred members do not start receiving pension with no further support from the company. The solvency calculation shows the cost of “buying out” members’ benefits in full with an insurance company if the scheme were to be wound up.
The assumptions used in this valuation are decided not based on the scheme’s experience, but on what is believed to be the assumptions used by the insurer. The discount rate set out is usually very low, as it often has reference to government bonds (risk-free), which results in a high present value of the liability, when compared to that from other valuations. This is the reason why a solvency valuation is called the Wind-up Valuation; the solvency valuation assumes maximum prudence.
b) Funding Valuation: This kind of valuation is required by the technical actuarial valuation standards and should also be in accordance to the Pension Act 2004. The scheme liabilities are valued for an “ongoing basis”. The purpose of this scheme is to ensure that the plan sponsors have control over the cost of the scheme. If the funding ratio of the scheme does not meet the required standard in order to meet the promised benefits, the employer would have to increase funding by increasing contributions to a level that meet the projected liabilities. Alternatively, the employer can also reward the employees with a contribution holiday in case the funding ratio has been exceeded and is higher than necessary. The existing market conditions define the process for the asset-liability value, the assets are taken at market value and the liability assumption should be consistent with market conditions. The assumptions used to value the liabilities are to be determined by the scheme actuary based on scheme-specific experience, where applicable.
The legislation requires employers to adopt assumptions which include a margin of prudence below the best estimate of mortality rates. There is no agreed definition of what prudence means; the employers must decide based on actuarial advice. The employer’s agreement with the employees is important and when this agreement is strong, they might
15
be willing to accept a lower level of prudence since the employer can meet any further deficit.
c) Accounting Valuation: The major process of this valuation is to value the scheme’s assets for year-end financial reporting. The accounting valuation is valued on “ongoing” basis, meaning the scheme is considered to be finally healthy and in full operation. It is required by the employer for preparation of their year-end accounts. The method used to set the assumptions is prescribed by the relevant accounting standards, which depend on where the accounts will be disclosed but should be the nearest value to a “best estimate”.
The discount rate for the valuation is set regarding “AA high-quality corporate bonds”, and thus is higher compared to the discount rate used in the solvency valuation. The mortality assumptions set are usually the best estimate from the scheme experience. Accounting valuations are essential because the value of the assets on the company’s financial statement needs to be reliable. The report from this valuation allows users of the accounts, especially the shareholders, to study the financial position of the company.
16
3. DETERMINING DISCOUNT RATES
Discount rate is typically the most financially material assumption and therefore rates used in setting provisions must be chosen prudently and take into account the yield on assets held by the scheme to fund future benefits and the anticipated future investment returns and the market redemption yields on government or high quality bonds (Cowling et al, 2011). One of the goals of our analysis is to select the prudent discount rate for pension schemes. A pension can be defined as a series of payments made to retirees usually for their lifetime; it is therefore seen as by employees or the current workforce as a form of savings for future expenditures especially during retirement. An actuary is tasked with estimating these payments that are made to all future participants at retirement. The pension discount rate is used to calculate the present value of employee pensions.
Consider the time value of money formula:
𝑃𝑉 = 𝐹𝑉/(1 + 𝑅%)^𝑁 (3.1) where: 𝑃𝑉 – Present Value, 𝐹𝑉 – Future Value, 𝑅% - Interest rate, 𝑁 – Time period (<1year for pensions)
This goes to show that the discount rate has an inverse effect on the present value of obligations.
Understanding the measurements of pension obligations requires recognizing the purpose and meaning of each and some factors need to be considered when determining the rate.
3.1 Determine the form of valuation to be applied in the scheme valuation:
3.1.1 For Accounting valuations
The discount rate must reflect the rate of return on high quality fixed income
securities at the valuation data. In this case, the method uses fixed-income yield data because fixed income securities are similar to pension obligation as both make fixed payments in future years.
17
The discount rate is used to discount future benefits to determine plan liabilities and therefore should be a reasonable expectation of the future rate of return of pension plan assets are to produce during that time period in which benefits are paid and also based on the assumption that the asset allocation will be maintained in the future.
The two approaches of valuation may produce the same discount rate (DR) if a pension scheme is invested entirely in the same type and same duration of the fixed-income securities. Usually the discount rate determined for funding valuations is higher than that to be used for accounting valuations (Patel & Daykin, 2010).
3.1.3 Investment Policy and Volatility
It is paramount to generate the highest possible returns consistent with the liabilities and liquidity needs of the pension plan. This is used to gauge the volatility or risk level for the plan assets being invested to fund the future plan liabilities. It goes hand in hand with the investment strategy of the plan provider or sponsors in for instance a risk averse plan provider will prefer a low rate of return on the plan assets as its associate with a lower risk hence investing in less risky deratives or ventures with a long time horizon.
It is common to have two different discount rates assumptions: one of them for the pre-retirement period and another for the post-pre-retirement. The fundamental distinction between the rate for Active members plan and Inactives (deferred and pensioners) members plan is the duration of the liabilities is different for each group.
3.2 Development of discount rates in Netherlands Valuations.
The method of valuation focused on during the internship process was Accounting
valuations therefore our main focus will be on determining the discount rate for
IFRS/USGAAP accounting standards that are mainly applied in Netherlands valuations. There is no significant difference between the discount rates used for each accounting standard.
18
Mercer derives monthly information on discount rates for IFRS and US-GAAP valuations to help companies in determining the discount rate for the pension obligations valuations. Further as it is a high valuation season during November and December each year, Mercer reports weekly on the development of discount rates for the year-end accounting purposes (Mercer, 2017).
Accounting standards require the discount rate used when calculating pension benefit obligations to be based on the yields on high quality corporate bonds. The specifics of his methods are not extensively outlined which means that choice of bonds and methodology for determining the rate is the responsibility of company directors, subject to review of their auditor.
To determine the discount rate recommendation, Mercer uses its own tool, the ‘Mercer Yield Curve Approach’ (MYC). The MYC is a popular tool for determining discount rates; it is being used for setting rates for UK, USA, Canada, Eurozone area and some other countries’ valuations. Following this approach, Mercer creates a ‘Spot Rate Yield Curve’ based on bonds from the Thomson Reuter’s Data stream indexes (until 31/05/2015 from Bloomberg indexes) in the Euro area (Mercer, 2018a).
Since the discount rate in accordance with IAS19.78 is defined by the time value for money, which by definition does not incorporate any significant default risk, Mercer therefore mainly uses those bonds that are free from interest rate distorting options, like put or call options that are laced with a risk of default. Furthermore, the bonds with much higher or lower interest rates compared to the other bonds (statistical outliers) are not also considered.
As the discount rate is determined according to the liability maturity based on high quality bonds but in the long term average, these rates were only around 0.5% higher than the rates for AAA (quasi safe) government bonds. Therefore, the auditors, actuaries and standard setters typically used AA rated corporate bonds as a substitute. For example, the iBoxx corporate AA10+ is commonly used as a benchmark index.
Due to the uncertainties in the financial markets, the spread between the yields on the AAA rated government bonds and yields on AA rated corporate bonds had reduced from an
19
earlier 0.5% up to 0.25% in 2008. This results from the fact that markets had yet equipped many AAA rated bonds with a significant risk premium. In the meantime, the spread has returned again nearly to the situation before the crisis of financial markets (Mercer, 2017). Selecting the right method to determine the discount rate has a very strong impact. The companies therefore have a certain latitude in the choice of the discount rate) although principles of continuity and consistency still must be followed).
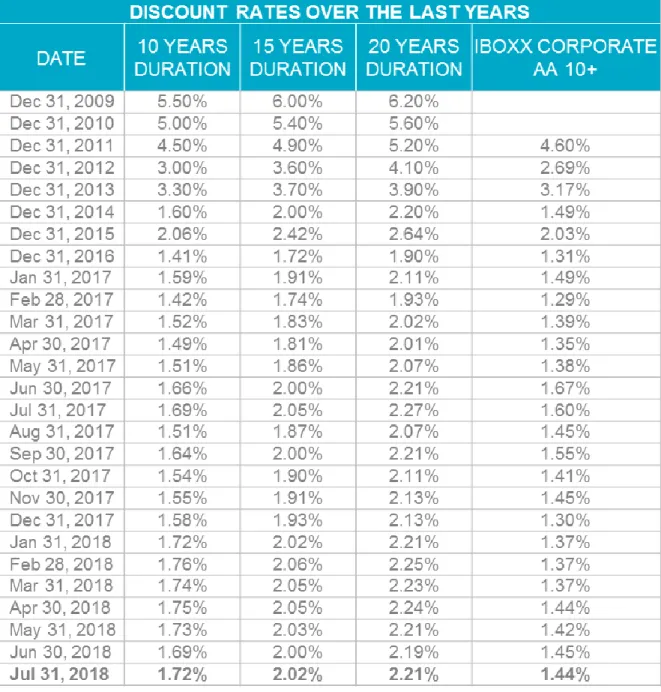
In the Eurozone, where the Netherlands operates, it is recommended based on durations of 10, 15 and 20 years. The discount rates for different durations can be determined by interpolating the values from the table below. It should be noted that the current low level of discount rates may results into higher durations than those in the previous years.
Figure 3.1: The trend movements of Discount Rates determined by the MYC with different
20
Figure 3.2: The Discount Rates determined by the MYC with different durations of the past
21
3.3 Mercer Yield Curve – Eurozone Cash Flow Discounter
The Mercer cashflow discounter provides a method of calculating an effective rate equivalent to discounting a set of scheme cashflows by spot rates of corporates bond yield curve to calculate an equivalent single discount rate that could be appropriate for valuing pension scheme liabilities and particularly for accounting purposes.
Mercer actuaries use this model to develop an approach that is specific to each scheme and reflect its liability profile. The MYC consists of half-early/zero coupon rates developed from pricing and yield information on high quality bond as such a combination of the bond yield curve and the cashflow discounter is referred to as the Mercer Yield Curve (MYC). The model is used to discount each year’s projected benefit cashflow at the associated spot rate back to the measurement date input and calculate the single equivalent rate that, when applied to the same cashflows, results in the same present value. It also calculates the Macaulay duration and the Modified duration.
Macaulay Duration: this is the average time it takes to pay past benefits, weighting each payment by the discounted value of benefit paid at that time. It’s defined with the formula;
𝐷𝑀𝑎𝑐𝑎𝑢𝑙𝑎𝑦 = ∑𝑡𝑃𝑡∗(1+𝑖)−𝑡
𝑃𝑡∗(1+𝑖)−𝑡 (3.2)
Where: 𝑃𝑡 is the Payment at time t and 𝑖 is the Interest Rate For the purpose of the report we consider the formula:
𝐷𝑀𝑎𝑐𝑎𝑢𝑙𝑎𝑦 = ∑(𝑡−0.5)𝐶𝑡(1+𝑖)
−𝑡
∑ C𝑡(1+𝑖)−𝑡 (3.3)
Where: 𝐶𝑡 is the annual cashflow in year t.
Since the cashflows in pension funds occurred throughout the year in question, for simplicity we consider a single cashflow occurring in the middle of the year.
The modified duration is the Macaulay duration divided by(1 + 𝑖). It measures the percentage change in the liability in response to a change in interest rates of 1%. The equivalent single discount rate was selected for the calculation of duration. All other assumptions remaining constant, the duration will increase as discount rates decline.
22
Modified duration (“duration”) is an estimate of the percentage change in the present value of a series of cash flows for a one percentage point change in the discount rate. Thus, if a pension plan has duration of 15, a one percentage point decrease in the discount rate (from 6% to 5 %, for example) would be expected to increase the value of the benefit obligation by approximately 15%. In certain situations, duration also corresponds to a weighted-average length of the underlying cash flows – hence its frequent denomination in “years.” Comparing the pension plan's duration with that of the plan's fixed-income investments is one tool that can help plan sponsors and fixed income managers assess how well the portfolio responds to changes in the present value of the pension cash flows. Note that duration itself depends on the discount rate and will change somewhat from month to month as the underlying interest rates change.
3.3.1 Constructing the Mercer Yield Curve (Eurozone MYC).
When developing the Mercer yield curve, there are four major areas where choices have to be made (Mercer, 2018a):
Choosing the appropriate bond universe to use. Fit a curve of best fit to the selected bonds.
Determine the transition point of a par coupon yield curve to a spot rate curve and extrapolate in cases where the data is insufficient.
Extend the curve beyond the transition point. The steps above are explained in greater detail as follows;
Step 1. Select the appropriate bonds to use
The MYC is based on euro-denominated corporate bonds rated AA by S&P Global or Moody’s Ratings. The bonds used should:
Have data available from the data provider (Thomas Reuters DataStream) Have an outstanding issue value of €50 million.
23
Have at least 6 months to maturity and, where they have maturity greater than 50 years, they satisfy additional checks to ensure it is reasonable to assume they are actively traded.
Are not government bonds or government related as these will not be considered as corporate bonds since the government is the majority stakeholder.
Be non-collateralized bonds. Collaterised bonds are asset backed securities rather than loans taken by companies for business purposes so these aren’t valued as corporate bonds.
Before incorporating these bonds in our analysis, their yields get adjusted by a calculated A-AA spread so they can be treated as proxies for AA-rated bonds. We call these bonds synthetic AA bonds. Also zero coupon bonds with a yield (interest) rate equal to coupon rate of a par can be included in the bond selection.
The Eurozone AA rated corporate bonds exists at up to durations of about 15 years, and after this, the number of bonds reduces significantly. Therefore for duration above 15 years, we need to incorporate additional information from A rated bonds with durations higher than 15 years. This allows us to extrapolate the curve for longer durations which adjusts their yields by the A-AA spread.
Using the Eurozone MYC methodology, we are able to create an A rated curve, that is compared against the AA corporate rate curves durations of greater than 7 years. We take the average spread and then exclude outliers.
At the moment, there are not any long-date euro dominated corporate bonds that are AAA-rated and satisfy our criteria.
Step 2: Fit a curve of best fit
Regression analysis is used when constructing the curve of best fit that linked yields to maturity to the maturity time of the selected bond yields. For regression purposes, we choose the fourth degree polynomial based on the logarithm of the time of maturity which minimizes the square differences between itself and data points excluding outliers.
24
We determine the curve of best fit using the least squares regression, which minimizes the sum of the squares of the differences between the actual data points and regression line. In order to eliminate the effects of bonds that appear to be outliers, we exclude bonds where the yields to maturity are more than two standard errors from the regressed yield to maturity based on the initial calculation. If the curve has been fitted well, then the differences between the theoretical and actual bond prices should spread evenly around zero. Many positive differences suggest the discount rate is higher that determined by Eurozone MYC; while negative differences of equal proportion suggest the discount rate is lower. The regression analysis is then rerun on the reduced data set to determine the final maturity yield curve.
Step 3: Convert par coupon yield curve into the equivalent zero coupon spot rate curve.
We convert the regressed yield curve into a spot rate curve using the bootstrap method which assumes that the price of coupons bonds for given maturity equals the present value of the underlying bond cash flows using zero coupon rates.
The principle of no arbitrage opportunities holds. During this conversion, we assume that the regressed coupon yield at each maturity date showed a coupon-paying bond at par. The semi-annually compounded yields are converted into effective annual yields.
Additionally we need to determine the transition point; there are a limited number of corporate bonds with maturities higher than 15 years so to enable us extrapolate the curve for higher durations so we need to determine a transition point to extrapolate the MYC. The model is improved to define the transition point as the average term of the five longest bond yields included in the curve excluding the outliers.
Step 4: Extend and extrapolate the curve beyond the transition point.
Having determined a suitable transition point, we need to determine how to extend the curve beyond this point. We choose to extrapolate the curve in line with the yield on government bonds by holding the spread constant between the derived spot rate and the
25
treasury rate, for example, the spot rate at time 1 is used to determine the spot rate at time 0.5.
Although several governments have issued bonds with terms up to around 50 years in the Eurozone, ECB produces its treasury curve that stops at 30 years due to insufficient data. Consequently, spot rates derived are used until the duration equal to the average maturity term for the last five available AA rated corporate yields included in the curve with 30 years maximum, in order to produce a more stable curve. The spot rates from the duration between 30 years to 50 years are determined by holding the spread above treasury rates constant.
In conclusion, the main importance of the MYC is to directly calculate the PV of liabilities. It is however easier to calculate the liabilities using a single equivalent discount rate rather than a yield curve. In order to determine the single discount rate, we need to use scheme specific cash flows. The cash flow discounter mainly assumes that the MYC spot rates remains constants from the time of 50 years onwards therefore the sample cash flow single equivalent rates can be used as a guide to the most appropriate scheme discount rate by comparing the duration of the scheme specific liabilities to that of the sample scheme.
26 3.4 Discount Rates for sample plans
Cashflows are used to derive the scheme profiles and the categories of liabilities differ from one country to the next, for example the liabilities in the Netherlands are increased with limited price increases or with known increases.
The scheme profiles in the Netherlands are characterized as duration periods corresponding to them as shown in the table 3.1 below;
Scheme Profile Approximate Duration
Scheme Liabilities Discount Rate per year
Short Intermediate 15 years 20% older deferreds, 80% pensioners.
2.11%
Intermediate 21 years 25% older actives, 30% deferreds, 45% pensioners.
2.29%
Longer Intermediate
25 years 65% younger actives , 25% deferreds, 10% pensioners
2.36%
Long 30 years 80% young actives, 20%
deferreds
2.42%
Table 3.1: The Discount Rates correspondent to the different Scheme profiles with different
durations
Note that the status description in reference to the relative duration of the liabilities of the members in that country.
3.5 Empirical calculation to determine the Discount Rate using the MYC yield curve.
As the MYC is a cashflow discounter, we need to input the accurate cash flows for the scheme for which we intend to calculate the Discount Rate (Mercer, 2018b).
During the internship process, these input cashflows were determined using the “Tool Uitkeringstromen” which translates to Tool for payment flow in English. As the name suggests, the main purpose of this tool is to estimate the future cashflows for the pension scheme and by doing so we have the expected cashflows for the period we need the Discount rate. While using this tool, we are able to gauge the duration for each of the pension status and therefore the duration of the scheme as a whole. This duration will be
27
used later used as reference in the MYC to achieve the appropriate DR, while assuming the inflation factor to be zero (Mercer, 2018b).
The above mentioned cashflows used are determined by;
𝑈𝑖𝑡𝑘𝑒𝑟𝑖𝑛𝑔 = [𝑅𝐹(𝐴𝑐𝑡𝑖𝑣𝑒𝑠) + 𝑅𝐹(𝐷𝑒𝑓𝑒𝑟𝑟𝑒𝑑𝑠) + 𝑅𝐹(𝑃𝑒𝑛𝑠𝑖𝑜𝑛𝑒𝑟𝑠)] (3.3) The term Uitkering means Payment
Most often, the roll forward period in consideration was one year but this was also dependent of the period of the last full valuation of the pension plan in which case;
𝑅𝑓𝑡 = 𝐶𝑢𝑟𝑟𝑒𝑛𝑡 𝑣𝑎𝑙𝑢𝑎𝑡𝑖𝑜𝑛 𝑑𝑎𝑡𝑒 − 𝐿𝑎𝑠𝑡 𝐹𝑢𝑙𝑙 𝑉𝑎𝑙𝑢𝑎𝑡𝑖𝑜𝑛 𝑑𝑎𝑡𝑒 (3.4) For easier illustration, we shall consider a 1 year roll forward;
For Active members;
𝑅𝐹𝐴1 = [(𝐶𝐹𝐴2∗ 𝐿𝐹𝐴𝑐𝑡) + (𝑁𝐶𝐴2∗ 𝐿𝐹𝑁𝐶 ∗ 𝐽𝑎𝑎𝑟1)] ∗ 𝐽𝑎𝑎𝑟1 + (1 − 𝐽𝑎𝑎𝑟1) ∗ [(𝐶𝐹𝐴1∗
𝐿𝐹𝐴𝑐𝑡) + (𝑁𝐶𝐴1∗ 𝐿𝐹𝑁𝐶 ∗ 𝐽𝑎𝑎𝑟1)] (3.5)
For Deferred members;
𝑅𝐹𝐷1= 𝐿𝐹𝐷𝑒𝑓[𝐶𝐹𝐷2∗ 𝐽𝑎𝑎𝑟1 + (1 − 𝐽𝑎𝑎𝑟1) ∗ 𝐶𝐹𝐷1] (3.6)
For Pensioners;
𝑅𝐹𝑅1= 𝐿𝐹𝑅𝑒𝑡[𝐶𝐹𝑅2∗ 𝐽𝑎𝑎𝑟1 + (1 − 𝐽𝑎𝑎𝑟1) ∗ 𝐶𝐹𝑅1] (3.7) To the final non zero cashflow;
𝑅𝐹𝐴𝑡−2 = [(𝐶𝐹𝐴𝑡∗ 𝐿𝐹𝐴𝑐𝑡) + (𝑁𝐶𝐴𝑡∗ 𝐿𝐹𝑁𝐶∗ 𝐽𝑎𝑎𝑟1)] ∗ 𝐽𝑎𝑎𝑟1 + (1 − 𝐽𝑎𝑎𝑟1) ∗
[(𝐶𝐹𝐴𝑡−1∗ 𝐿𝐹𝐴𝑐𝑡) + (𝑁𝐶𝐴𝑡−1∗ 𝐿𝐹𝑁𝐶 ∗ 𝐽𝑎𝑎𝑟1)] (3.8)
𝑅𝐹𝐷𝑡−2= 𝐿𝐹𝐷𝑒𝑓[𝐶𝐹𝐷𝑡∗ 𝐽𝑎𝑎𝑟1 + (1 − 𝐽𝑎𝑎𝑟1) ∗ 𝐶𝐹𝐷𝑡−1] (3.9)
𝑅𝐹𝑅𝑡−2 = 𝐿𝐹𝑅𝑒𝑡[𝐶𝐹𝑅𝑡∗ 𝐽𝑎𝑎𝑟1 + (1 − 𝐽𝑎𝑎𝑟1) ∗ 𝐶𝐹𝑅𝑡−1] (3.10)
28
𝑅𝐹𝐴; 𝑅𝐹𝐷 ; 𝑅𝐹𝑅 Is the roll forward cashflow associated with an active, deferred and retired
participant respectively. Each of these values is referenced to the time at which they are paid.
𝐶𝐹𝐴; 𝐶𝐹𝐷 ; 𝐶𝐹𝑅 Is the accrued liability associated with an active, deferred and retired
participant respectively. Each of these values is referenced to the time at which they are paid.
𝑁𝐶𝐴 is the normal cost associated with an active participant respectively. Deferred and Retired participants do not have a normal cost value.
𝐿𝐹𝑆𝑡𝑎𝑡𝑢𝑠; 𝐿𝐹𝑁𝐶 is the liability ratio. It is defined as the ratio of the Final studio liabilities to
the Estimated Liabilities by the tool.
𝐿𝐹𝑆𝑡𝑎𝑡𝑢𝑠/𝑁𝐶 = 𝐹𝑖𝑛𝑎𝑙 𝑆𝑡𝑢𝑑𝑖𝑜 𝑙𝑖𝑎𝑏𝑖𝑙𝑖𝑡𝑖𝑒𝑠 𝑜𝑓 𝑡ℎ𝑒 𝑠𝑡𝑎𝑡𝑢𝑠 𝑜𝑟 𝑁𝐶𝐸𝑠𝑡𝑖𝑚𝑎𝑡𝑒𝑑 𝐿𝑖𝑎𝑏𝑖𝑙𝑖𝑡𝑖𝑒𝑠 𝑜𝑓 𝑡ℎ𝑒 𝑠𝑡𝑎𝑡𝑢𝑠 𝑜𝑟 𝑁𝐶 (3.11)
𝐽𝑎𝑎𝑟1 is the yearly factor of the roll forward period, which in this case would be equal to 1. The liabilities are usually valued for a period of 120 years; therefore the total number of cashflows would not exceed 120 cashflows.
3.6 Converting the cashflows to determine a single effective discount rate
Once the cashflows have been determined using the “Tool Uitkering”, we then apply the MYC methodology to determine the appropriate Discount Rate identical to the plan. During the internship process and for majority of the Dutch plan valuations, firstly we need to specify the scheme profile, which in turn determine the appropriate spot rates curve. The “User Defined” scheme profile is selected as the cashflows we are using is specific to the scheme in question and follows that the spot rates allow for the user defined property. Firstly, the cashflows are adjusted to the measurement year of the curve since the MYC is updated every month’s end. The adjusted cashflows are then converted in to weighted cashflows.
29
= 𝐴𝑑𝑗𝑢𝑠𝑡𝑒𝑑 𝐶𝑎𝑠ℎ𝑓𝑙𝑜𝑤 ∗ (𝑌𝑒𝑎𝑟 𝐼𝑛𝑑𝑒𝑥 + 0.5) (3.12) We use the 0.5 as the default timing for the cashflow; we assume that the benefits payments are made at the middle of year. We need to discount the cashflows with the spot rate for the years from the measurement year. These discounted cashflows also be referred to Mercer Discounted Cashflows.
𝐷𝑖𝑠𝑐𝑜𝑢𝑛𝑡𝑒𝑑 𝐶𝑎𝑠ℎ𝑓𝑙𝑜𝑤𝑠 = 𝐴𝑑𝑗𝑢𝑠𝑡𝑒𝑑 𝐶𝑎𝑠ℎ𝑓𝑙𝑜𝑤𝑠 ∗ (1 + 𝑠𝑝𝑜𝑡 𝑟𝑎𝑡𝑒%)−(𝑌𝑒𝑎𝑟 𝐼𝑛𝑑𝑒𝑥+0.5)
(3.13) A preliminary discount rate (DR %) is suggested considering the cashflows and the scheme profile so we use this rate
𝐷𝑅% 𝐷𝑖𝑠𝑐𝑜𝑢𝑛𝑡𝑒𝑑 𝑐𝑎𝑠ℎ𝑓𝑙𝑜𝑤𝑠 = 𝐴𝑑𝑗𝑢𝑠𝑡𝑒𝑑 𝐶𝑎𝑠ℎ𝑓𝑙𝑜𝑤𝑠 ∗ (1 + 𝐷𝑅%)−(𝑌𝑒𝑎𝑟𝐼𝑛𝑑𝑒𝑥+0.5)
(3.14) The respective discounted cashflows are summed up identically; the totals of these discounted cashflows are then compared. If the Total Discounted cashflows = DR% Discounted Cashflows then we can conclude that;
𝑬𝒇𝒇𝒆𝒄𝒕𝒊𝒗𝒆 𝑫𝒊𝒔𝒄𝒐𝒖𝒏𝒕 𝑹𝒂𝒕𝒆 = 𝑃𝑟𝑒𝑙𝑖𝑚𝑖𝑛𝑎𝑟𝑦 𝐷𝑖𝑠𝑐𝑜𝑢𝑛𝑡 𝑅𝑎𝑡𝑒 (3.15) Alternatively, we calculate the Macaulay Duration of the cashflows that was already calculated by the “Tool Uitkering” and make an estimation of the Effective Discount Rate considering the yield curve duration properties. This is a more robust method compared to the former method that is mainly dependent on the judgement of the analyst.
3.7 Conclusion
After the procedure of determining the discount rate has been finalized, the rate is communicated to the consultant-in-charge and consolidating actuary-in-charge for the professional review. Only after the ultimate sign-off from the consolidating actuary, the Discount Rate is then used for the valuation process.
30
4. SENSITIVITY ANALYSIS OF
DISCOUNT RATES
Having determined an effective discount rate for the valuation, in this chapter we will now consider how the liabilities are sensitive to the changes in discount rate. Sensitivity analysis can be done in many ways and techniques. The basic principle is to change one or several assumptions and see the quantitative impact such change has on the final liabilities.
In financial reporting, for example, sensitivity analysis would generally be based on changes in assumptions regarding discounts, interest or exchange rates, prices, pension obligations, etc. However, if a profit estimate is more sensitive to changes in other economic assumptions, such as development or operating costs, the sensitivity analysis should be based on changes in those assumptions.
A sensitivity analysis is an easy and quick tool that provides useful information for decision-making. It helps to identify those critical assumptions that give rise to volatility of assets, liabilities and consequently financial results. By the means of sensitivity analysis, the attention of management and users of financial statements is brought to the most risky areas. If risks and uncertainties were not considered in financial statements, too much confidence might have been unduly placed on the financial results of an entity which could be misleading information of the entity’s financial situation (Ahlgrim et al, 2003).
This analysis may vary from different pension plans with different valuation discount rate. Therefore in order to compare sensitivity information for these plans, the sensitivities must be adjusted to the same discount rate. Sensitivity results are either reported for going concern valuations or solvency valuations, the results are highly consistent between the two forms of valuation.
The sensitivity information is very important in accounting valuations, mostly sensitivity information in relation to assumptions that affect the determination of the obligations. Importantly if the sensitivity on the discount rate is valued as an aggregate with actives and inactives then it is advised to include the sensitivity to a change in the salary increase rate