DESIGN AND IMPLEMENTATION OF THE OCEANOGRAPHIC MODELING AND OBSERVATION
NETWORK (REMO) FOR OPERATIONAL OCEANOGRAPHY AND OCEAN FORECASTING
Jose Antonio Moreira Lima
1, Renato Parkinson Martins
1, Clemente Augusto Souza Tanajura
2,
Afonso de Moraes Paiva
3, Mauro Cirano
2, Edmo Jose Dias Campos
4, Ivan Dias Soares
5,
Gutemberg Borges Franc¸a
6, Rodrigo de Souza Obino
7and Jo˜ao Bosco Rodrigues Alvarenga
7ABSTRACT.This paper is concerned with the planning, implementation and some results of the Oceanographic Modeling and Observation Network (REMO) for Brazilian regional waters. Ocean forecasting has been an important scientific issue over the last decade due to studies related to climate change as well as applications related to short-range oceanic forecasts. It is a challenge to design an ocean forecasting system for a region with poor observational coverage ofin situdata such as the South Atlantic Ocean. An integrated approach is proposed here in which the large-scale circulation in the Atlantic Ocean is modeled in a first step, and gradually downscaled into higher resolution regional models. This approach is able to resolve important processes such as the Brazil Current and associated meso-scale variability, continental shelf waves, local and remote wind forcing, and others. This article presents the overall strategy to develop the models using a network of Brazilian institutions and their related expertise along with international collaboration. This work has some similarity with goals of the international project Global Ocean Data Assimilation Experiment OceanView (GODAE OceanView), in which REMO takes part.
Keywords: ocean models, ocean measurements, data assimilation.
RESUMO.Este artigo apresenta o planejamento, implementac¸˜ao e alguns resultados da Rede de Modelagem e Observac¸˜ao Oceanogr´afica, com acrˆonimo REMO, para ´aguas territoriais brasileiras. A previs˜ao de condic¸˜oes oceˆanicas tem sido um importante t´opico de pesquisa cient´ıfica ao longo da ´ultima d´ecada, devido a estudos relacionados com mudanc¸as clim´aticas assim como interesse por previs˜oes sin´oticas de curto prazo de vari´aveis tais como correntes marinhas e temperatura da ´agua. ´E um desafio realizar o projeto de um sistema de previs˜ao para uma regi˜ao oceˆanica com baixa disponibilidade de medic¸˜oes, como o Oceano Atlˆantico Sul. Uma proposta de desenvolvimento integrado ´e apresentada neste trabalho, onde um modelo de circulac¸˜ao oceˆanica de todo Oceano Atlˆantico foi implementado como passo inicial, e gradualmente foram aninhados modelos regionais com maior resoluc¸˜ao espacial. Este artigo apresenta a estrat´egia de desenvolvimento destes modelos oceˆanicos utilizando o conhecimento cient´ıfico disponibilizado por pesquisadores de uma rede de instituic¸˜oes brasileiras, com eventual colaborac¸˜ao de pesquisadores internacionais. Esta iniciativa brasileira possui pontos comuns com um projeto de cooperac¸˜ao cient´ıfica internacional, denominado Global Ocean Data Assimilation Experiment OceanView (GODAE OceanView), da qual a REMO faz parte.
Palavras-chave: oceanografia operacional, modelagem oceˆanica, sensoriamento remoto, medic¸˜oes oceanogr´aficas, assimilac¸˜ao de dados.
1Centro de Pesquisas e Desenvolvimento Leopoldo Am´erico Miguez de Mello – PETROBRAS/CENPES, Av. Horacio Macedo, 950, Cidade Universit´aria, 21941-915 Rio de Janeiro, RJ, Brasil. Phone: +55(21) 2162-6284 or 6848 – E-mails: [email protected], [email protected]
2Departamento de F´ısica da Terra e do Meio Ambiente, Instituto de F´ısica, Universidade Federal da Bahia, Campus de Ondina, Travessa Bar˜ao de Jeremoabo, s/n, 40170-280 Salvador, BA, Brasil. Phone: +55(71) 3283-6685 or 6686 – E-mails: [email protected], [email protected]
3Programa de Engenharia Oceˆanica – COPPE/PENO, Universidade Federal do Rio de Janeiro, Av. Horacio Macedo, 2030, Cidade Universit´aria, Caixa Postal 68508, 21941-914 Rio de Janeiro, RJ, Brasil. Phone: +55(21) 2562-8754 – E-mail: [email protected]
4Departamento de Oceanografia F´ısica, Qu´ımica e Geol´ogica, Instituto Oceanogr´afico, Universidade de S˜ao Paulo, Prac¸a do Oceanogr´afico, 191, Cidade Universit´aria, 05508-120 S˜ao Paulo, SP, Brasil. Phone: +55(11) 3091-6597 – E-mail: [email protected]
5N´ucleo de Oceanografia F´ısica, Instituto de Oceanografia, Universidade Federal do Rio Grande, Av. It´alia, Km 8, 96203-900 Rio Grande, RS, Brasil. Phone: +55(53) 3233-6710 – E-mail: [email protected]
6Departamento de Meteorologia – IGEO, Universidade Federal do Rio de Janeiro, Av. Athos da Silveira Ramos, 274, Cidade Universit´aria, 21941-916 Rio de Janeiro, RJ, Brasil. Phone: +55(21) 2598-9253 – E-mail: [email protected]
7Centro de Hidrografia da Marinha (CHM), Sec¸˜ao de Modelagem Oceanogr´afica/REMO, Rua Bar˜ao de Jaceguay, s/n, Ponta da Armac¸˜ao, 24048-900 Niter´oi, RJ, Brasil. Phone: +55(21) 2189-3614 – E-mails: [email protected], [email protected]
INTRODUCTION
Numerical ocean forecasting models have always lagged their meteorological counterparts. Mankind necessities associated with atmospheric weather forecasting for human safety, agri-culture and aviation were probably paramount, while a large network of meteorological stations already available helped the meteorologists with better initial conditions and model re-analysis. Oceanographers, on the other hand, had to deal with lack of oceanic measurement stations and problems related with shorter spatial scales associated with their meso-scale phenom-ena of interest that would require higher model spatial resolution and much larger computational power. A Brazilian oceanic fore-casting network should be planned using previous experience of atmospheric and oceanic numerical modeling, and it is very use-ful to briefly review early efforts of meteorologists to develop and implement the tools of modern numeric weather prediction.
Smagorinsky (1983) provides a good review paper on the subject, where it is described the early attempts after World War II of the Institute of Advanced Studies (IAS) in Princeton and the im-portant contribution of a group of high-level visionary researchers such as J.G. Charney, N.A. Phillips, J.D. Von Neumann, G.D. Platzman and others. Moura (1996) also provides a good de-scription of the initial efforts to develop numeric meteorological forecasting systems after 1942, highlighting the importance of the model proposed by Charney et al. (1950), which represented a break-through step into numerical weather prediction overcom-ing the problems of a pioneerovercom-ing work proposed by Richardson (1922,apud Moura, 1996). The advent of the Electronic Numer-ical Integrator and Calculator (ENIAC), initially at the U.S. Army Aberdeen Proving Ground in Maryland and later in Princeton, was also a major step to solve the proposed numerical schemes. Both authors emphasize how important was the establishment of the General Circulation Research Section in 1955, a joint venture of the U.S. Weather Bureau, Air Force and Navy, that would later become the Geophysical Fluid Dynamics Laboratory (GFDL) in 1963, initially based in Washington and moved to Princeton in 1968. Smagorinsky (1983) remembers that this laboratory con-sidered getting involved with oceanic modeling for two reasons: techniques developed for atmospheric modeling seemed trans-ferable to the oceans and, most important, it started to be realized that long-term evolutions of the atmosphere and its climatic prop-erties could not be understood without understanding the interac-tion with the oceans.
Semtner (1995) reviews the early years of numerical ocean circulation modeling and the contribution of GFDL researchers
such as K. Bryan and M.D. Cox. Their original model, presented in Bryan (1969), used explicit finite differencing scheme and the “rigid lid” approximation to eliminate high-speed external gravity waves. This model after many improvements would be-come the “GFDL model”, a geopotential or “z-level” coordinate model that represented the workhorse of many scientific modeling studies and ocean forecasting initiatives. Its updated version, named Modular Ocean Model (MOM), was developed and it is still supported by the GFDL. Since then, a hierarchy of numeri-cal models that simulate the ocean circulation solving primitive equations with some simplifying assumptions and prescribed forcing and boundary conditions have been developed over the last decades, generally referred as “Ocean General Circu-lation Models” (OGCMs). Significant contributions have been provided by an isopycnal model proposed by Bleck & Boudra (1981), the Miami Isopycnic Coordinate Ocean Model (MICOM), that improved the representation of water masses spreading along preferential isopycnal surfaces, and a “terrain-following” or “sigma” coordinate model proposed by Blumberg & Mellor (1987), the Princeton Ocean Model (POM), with better bottom resolution over coastal and continental shelf regions. More re-cent developments, relying on increasing computational power and improved physical and numerical schemes, include the Hybrid Circulation Ocean Model – HYCOM, (Bleck, 2002), and the Regional Ocean Modelling System – ROMS, (Shchep-etkin & McWilliams, 2005). These are progressively gaining widespread applications.
Today, ocean forecasting systems are gradually reaching the operational state of atmospheric forecasting models, some-thing that was quite unthinkable a few years ago. Dombrowsky et al. (2009) reviews the main oceanic forecast systems that are operative under the Global Ocean Data Assimilation Exper-iment (GODAE). This project was continued by GODAE Ocean-view, providing partnership and strong commitment of many re-search groups around the world to initialize oceanic forecast-ing usforecast-ing OGCMs on a routine basis. Many systems, such as the HYCOM/Navy Coupled Ocean Data Assimilation System (HYCOM/NCODA) in the USA, Forecasting Ocean Assimila-tion Model (FOAM) in Great Britain, Mercator-Ocean in France, BLUElink in Australia, Towards an Operational Prediction System for the North Atlantic European Coastal Zones (TOPAZ) in Nor-way and others, are providing operational oceanic forecasts using distinct data assimilation schemes, such as Ensemble Kalman fil-ter, Optimal Interpolation (OI), and variational methods, in order to incorporate data from satellites (sea surface altimetry, sea sur-face temperature, sursur-face wind, etc) and fromin situ
measure-ments (T/S profiles from Argo floats, XBTs and CTDs). After the World Ocean Circulation Experiment (WOCE) in the 1990’s and with the income of the Global Ocean Observing System (GOOS), as an effort endorsed by the Intergovernmental Oceanographic Commission (IOC) and the World Meteorological Organization (WMO), new datasets have been available for oceanographers to improve model results and standards of accuracy of their fore-casting capabilities. Brassington (2011) provides an overview of definitions, applications and system elements related to opera-tional ocean forecasting systems.
Data assimilation (DA) schemes produce the so-called ob-jective analysis by combining model outputs within situ and re-mote sensed observations considering both the model and the observational errors. The analysis is used as initial condition for the forecasts. Since part of the model predictability depends directly on the quality of the initial condition, DA is a key-com-ponent of any forecasting system. DA schemes are able to incor-porate data from satellites and buoys using different mathemati-cal and computational strategies to constrain the model solution, and the analysis are also used for diagnostic studies and to com-plement monitoring systems. DA systems are based on optimal interpolation, Kalman filters or variational methods (Kalnay, 2003; Cummings et al., 2009). However, the realization of an assimila-tion system is not a trivial task, since it requires a rigid quality control system of the observational data, an estimate of the model error covariance matrix in the multivariate model space, strategies to reduce the high dimensionality of the analysis error minimiza-tion problem and deep knowledge of the model formulaminimiza-tion and code, among other issues.
While global high-resolution operational systems are rapidly becoming available, there is still need for regional systems in which not only even higher resolutions can be attained but also particular attention can be directed to local or specific phenomena of interested. This view is acknowledged by the Oceanographic Modeling and Observation Network – REMO (acronym for “Rede de Modelagem e Observac¸˜ao Oceanogr´afica”, in Portuguese), a Brazilian effort towards operational oceanography that is under construction and permanent improvement by researchers from different institutions in Brazil since 2007. This effort and prelim-inary results granted REMO full membership in GODAE Ocean-View at the end of 2010. This membership allows REMO to better participate in an international forum dedicated to planning and development of operational oceanography, including modeling, observation and data assimilation. This paper discusses the de-sign and implementation of the first version of REMO’s opera-tional system. It also presents near future steps towards
improv-ing the current ocean forecastimprov-ing system. A set of companion articles in this issue will address specific research topics and results produced within REMO initially developed models.
MOTIVATION
Brazil has a very extensive continental margin that extends from approximately 4◦N to 35◦S. The oceanic circulation along the
Brazilian continental shelf and slope is directly affected by com-plex systems of large-scale currents associated with many distinct features, such as the Equatorial Atlantic circulation on the northern border, the South Atlantic subtropical gyre along the eastern bor-der, and the Brazil-Malvinas Confluence on the southern border. High-resolution regional ocean models must deal with initial and boundary conditions that reproduce the effects of the large-scale circulation upon them.
The development of numerical ocean models with forecast-ing capabilities is a largely desired goal for countries with an ex-tensive oceanic border such as Brazil. The main motivation fac-tors to implement an ocean forecasting system are related with navigation safety, search and rescue operations, economic ex-ploitation of subsea resources, fishery industry, nautical sport activities, and many others. Some motivation aspects are briefly discussed below.
Surface current maps are one of the main inputs of drift models that simulate trajectories of floating objects and human beings in a search and rescue operation, also called SAR mis-sion. As an example, one of the most difficult SAR operations in Brazil was the accident with Air France flight AF 447 on June 1st 2009. The airplane disappeared in the middle of the equatorial Atlantic Ocean somewhere between the Archipelago of Fernando de Noronha and the African continent. Many institutions partici-pated in the SAR mission, including the Centro de Hidrografia da Marinha (CHM) of the Diretoria de Hidrografia e Navegac¸˜ao (DHN) of the Brazilian Navy. They used a SAR computational software in order to evaluate possible trajectories of debris and help setting up a search area for eventual survivors or unfortunate diseased bodies, as well as traceback the probable accident site where the plane reached the sea surface (Fig. 1). As it would be expected, surface currents field was one of most important factors to run the model, along with surface wind field.
For navigational safety purposes, the world ocean is di-vided into 16 areas of responsibility, called either METAREAs (for meteorological information) or NAVAREAs (for navigational warnings), each the responsibility of a National Meteorological Service (NMS). The Brazilian Navy is the responsible for the
Figure 1 – Search and Rescue mission of Air France flight AF 447 airplane debris. Search area provided by the International Aeronautical and Maritime
Search and Rescue (IAMSAR) method with surface current field in the background. Courtesy: CHM.
dissemination of metocean information and safety of navigation in an extensive area of the South Atlantic Ocean called METAREA V, that covers the region between latitudes 35.5◦S to 7◦N and
longitudes 55◦W to 20◦W, as delimitated in Figure 4. Thus, any
ship distress informed by the Global Maritime Distress and Safety System (GMDSS) or SAR mission within this region must be accomplished with aid of the Brazilian Navy. This calls for the capability of the Brazilian Navy of both understanding and fore-casting ocean currents within this domain.
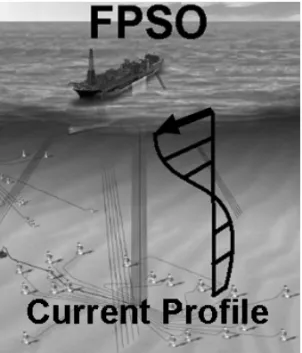
Another important issue is that Brazil relies on offshore pro-duction for supply of most of its oil and gas internal consump-tion. About 91% of Brazilian oil production on May 2013 came from offshore oil fields (ANP, 2013). The forecast of waves, ocean currents and sub-surface thermohaline structure is very impor-tant for planning of many offshore operations, such as deep sea drilling, interventions with remotely operated vehicles, installa-tion of subsea equipment and many other applicainstalla-tions. For in-stance, the design of deep water oil production and water injec-tion risers requires a good knowledge of current profiles (Lima et
al., 2009). Figure 2 presents a schematic view of a Floating Pro-duction Storage and Offloading (FPSO) platform that has many attached risers and mooring lines, adapted from an article of Costa Filho (2005) that describes the design of this type of off-shore production systems. Distinct directions of currents flowing along vertical water column affect the final configuration of the mooring lines and risers.
DESIGN OF REMO FORECASTING SYSTEM
It is always a problem for developing countries to pace up with all the new ocean technologies and computational resources re-quired to do state-of-the-art research on ocean numerical model-ing, mainly due to shortage of economic resources that could be invested into scientific grants to develop such a specialized area of science. A wise way to surpass this problem is to join efforts and bring institutions and specialized professionals to work together into a common goal of ocean modeling research establishing the basis of an operational oceanic forecasting
system. This is the main objective of the REMO consortium, which brings together Brazilian universities, the Brazilian Navy and the Brazilian-state oil company research center to work for the common objective of developing an operational numerical oceanic forecasting system. This section will briefly outline the proposed approach and how the distinct institutions shared exper-tise and established goals towards a Brazilian initiative on ocean forecasting system.
Figure 2 – Schematic view of a Floating Production Storage and Offloading
(FPSO) platform with attached risers and mooring lines affected by vertical pro-file of ocean currents. Adapted from Costa Filho (2005). Courtesy: Petrobras.
The introduction presented examples of how specialized groups of researchers can join expertise to achieve a common objective, as was done for atmospheric weather prediction in the middle 1950 decade, and more recently for oceanic forecasting in the first decade of the XXI century. Based on these previous experiences, a group of Brazilian oceanographers and numeri-cal modelers searched in 2006 to design a network of models and ocean observations that would permit development of an oceanic forecasting system for a region of interest in the western South Atlantic Ocean. The group included universities located on distinct regions of the Brazilian coast, what would permit wide-spread knowledge of regional oceanic conditions. Within REMO, Federal University of Rio Grande (FURG) represented the south-ern border, University of S˜ao Paulo (USP) and Federal Univer-sity of Rio de Janeiro (UFRJ) represented the southeast and east regions, and Federal University of Bahia (UFBA) represented the northeast and north regions. The Centro de Hidrografia da Marinha (CHM), the Navy’s Hydrographic Center, with its previ-ous experience on marine meteorological weather prediction is responsible for operation of ocean forecast models, and
PETRO-BRAS Research Center (CENPES) provided the financial re-sources and centralized the efforts for the network implementa-tion, subjected to approval of research funds by Agˆencia Nacional do Petr´oleo, G´as Natural e Biocombust´ıves (ANP). The Instituto de Estudos do Mar Almirante Paulo Moreira (IEAPM) also gave its contribution in the initial phase. Table 1 presents the planned phases of REMO network.
REMO was designed with three main task groups: models development, observations (remote sensing and metocean meas-urements), and models operation, as presented in the box dia-grams of Figure 3. The models development required intensive applied research at the universities, in order to implement a hi-erarchy of numerical grids as backbone for development of an operational modeling system for the South Atlantic, which could be used for research purposes and to support oil industry and navy operations along the Brazilian shelf. This effort includes the set up of a lower resolution large-scale grid of HYCOM that would cover both the South and North Atlantic Oceans and would provide lateral boundary conditions to a higher-resolution basin-scale grid of HYCOM centered on the METAREA V. Meso-scale versions of HYCOM and ROMS would be nested or receive boundary conditions from the METAREA V HYCOM grid.
Tasks regarding the oceanic observations and remote sens-ing were also detailed planned because they will provide data to be assimilated by the models as well as information to evaluate their results. Satellite remote sensing information is an essential product of this group, because models require accurate along-track Sea level anomaly (SLA) and Sea Surface Temperature (SST) data to constrain data assimilation schemes and provide fore-cast initial conditions. Ocean measurements using surface buoys and moorings are also planned to providein situoceanographic data. This represents an important effort to improve the cov-erage of oceanographic data measurements along the Brazilian continental slope.
Operational model tasks are mainly executed by CHM that has already extensive experience with marine weather forecasting models for METAREA V. They are running ocean models initially developed by university researchers and later on implemented in their operational computational facilities. CHM is also support-ing the development of data assimilation schemes. UFBA will be running pre-operational forecasts with and without data assimi-lation, as redundancy and development towards the main opera-tional system in CHM.
The main products delivered are forecasts of oceanic three-dimensional fields of velocity (U,V), thermohaline structure (T,S), and sea surface elevation (EL). REMO also supports improvement
Table 1 – Planned phases of REMO network.
2007 2008 2009 2010 2011 2012 2013 2014 2015 2016 2017 ∙ ∙ ∙ ∙ ∙ ∙
Phase 1 Phase 2 Phase 3
Build up of network infrastructure Development of data assimilation Upgrading data assimilation (laboratories and high techniques for remote sensing techniques using previous results
performance computing) fields and ocean observations and extended knowledge
Initial setup and tests of distinct Implementation of synoptic scale Upgrading the ocean hindcast configurations of selected operational ocean forecasting databases using improved
numerical ocean models with data assimilation assimilation techniques
Capacitate human resources Build up of inicial ocean hindcast Consolidation of an integrated to pursue specialized research databases using selected models ocean forecasting system with in ocean modeling (hydrodynamic ocean bases) contribution of public or private
Figure 3 – Task groups (models development, operation, observations) and products to be delivered by the oceanic forecasting system as designed
by REMO network. Logos identify institutions involved with each task.
of atmospheric model forecasts to provide better meteorological forcings to ocean circulation and wave models driven by the re-sulting wind fields. The products are used to support many activ-ities, as described in the motivation section, such as search and rescue operations, input to oil spill simulation models, naviga-tional safety bulletins and others applications. It is also expected to provide results for scientific publications and to support aca-demic activities on physical oceanography and related fields.
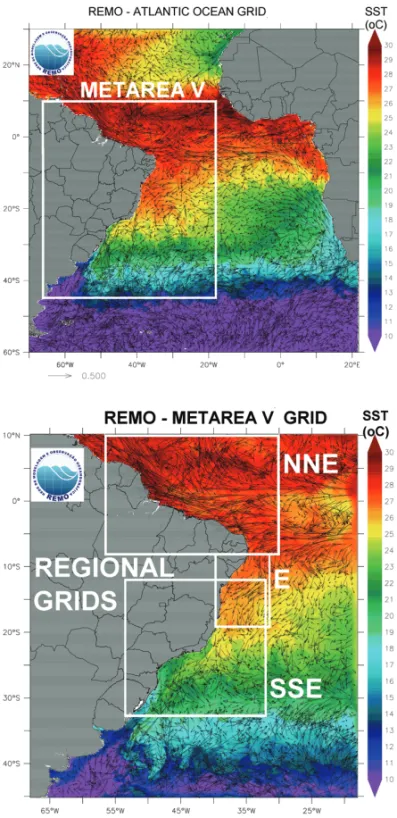
BASIN SCALE AND REGIONAL OCEAN MODELING The basic hierarchy of model configurations for REMO network includes a basin scale eddy-permitting version of HYCOM, now-adays with 1/4◦ horizontal resolution but already planned to
use higher horizontal resolution, that covers both the South and North Atlantic Oceans and provides boundary conditions for an eddy-resolving version of the same model, with 1/12◦horizontal
resolution, covering the METAREA V ocean area (Fig. 4). Regional configurations, with 1/24◦and higher horizontal resolutions are
then nested for specific domains of interest, using versions of HYCOM, ROMS and other available models. There are three planned regional sub-domains: a south-southeast (SSE) grid, an east (E) grid and a north-northeast (NNE) grid.
Figure 4 – REMO models nesting configuration, showing the eddy-permitting
Atlantic basin domain (up panel), the eddy-resolving METAREA V domain, and some examples of higher resolution regional domains (down panel).
In the basin scale configuration, model domain was designed in order to place the boundaries far away from the area of interest. The north domain extends to 50◦N, where the boundary is closed
and a relaxation zone to climatology forces the vertical shear. This approach, and in particular this latitude, have been shown in previous simulations (Paiva et al., 2000; Paiva & Chassignet, 2001) to provide good results with isopycnal models. Mediter-ranean inflow is simulated, also through a relaxation zone around Gibraltar, in order to maintain salt balance in long-term simula-tions together with river outflow, which is implemented via a pre-cipitation equivalent. In the southern domain, inflow and outflow conditions in the Drake and south of Africa forces the Antarctic Circumpolar Current, and a simple ice model is implemented. The model was spun-up under National Center for Environmen-tal Prediction (NCEP)/National Center for Atmospheric Research (NCAR) synoptic atmospheric forcing for 30 years. Boundary conditions were then provided for a 7-year high-resolution sim-ulation within the METAREA V domain, carried up to 2009. From this point on simulations were carried out in both domains in an assimilative mode. Details of the model configuration, discus-sion of its main results and of the strengths and weakness of this approach are presented in a companion paper (Gabioux et al., 2013). While the METAREA V and the regional versions can be nested using results from simulations performed elsewhere if desired (e.g., global runs), our present approach, which takes into account the available computational power within REMO network, is desirable in order to provide necessary autonomy to the system.
The METAREA V South Atlantic nested grid is showed in the right panel of Figure 4. Its domain extends from 10◦N to 45◦S
and from 18◦W to 68◦W. It is implemented using a 1/12◦
horizon-tal resolution HYCOM model with 21 vertical σθlayers. Initially,
the grid was warmed up with a 10-year simulation with COADS climatological forcing and later with a 7-year run from 2003 to 2009 using NCEP/NCAR 6-hour reanalysis forcing. Right now, daily forecasts are being done at CHM using 0.1◦horizontal
res-olution HRM synoptic forecasts with the Cooper & Haines (1996) assimilation scheme taking SSH from the HYCOM/NCODA anal-ysis since November 2009.
Regarding the regional ocean modeling component, efforts are concentrated into numerical grids that would solve particu-lar details of ocean circulation at some regions of the Brazilian shelf. The first implemented regional grid was a south-southeast (SSE) sub-domain with high resolution 1/24◦horizontal grid
HY-COM model using 21 vertical σθ layers, and horizontal domain
from 12◦S to 32◦S and from 34◦W to 54◦W (Fig. 5, left panel).
The lower boundary was placed at 32◦S to avoid perturbations of
the Brazil and Malvinas Currents Confluence further south. The objective of this regional grid was to cover the main Brazilian
Figure 5 – South-southeast Brazilian shelf regional grid covering an oceanic area that comprises Esp´ırito Santo, Campos and Santos offshore sedimentary basins
(left panel). East Brazilian shelf regional grid covering Camamu, Almada and Jequitinhonha basins (right panel).
offshore production regions (Esp´ırito Santo, Campos and San-tos basins). The model was warmed up with a 6-year simulation from 2004 to 2009 using analyses from the NCEP Global Data Assimilation System (GDAS). A similar SSE grid was also setup with ROMS using the same horizontal resolution but higher ver-tical discretization (32 s-levels) in order to compare results and evaluate strategies of data assimilation with distinct models. The second implemented regional sub-domain was an east (E) domain with high resolution 1/36◦horizontal SSE grid ROMS model
us-ing 32 s-levels, and a horizontal domain extendus-ing from 8◦S to
19◦S and from 32◦W to 40◦W (Fig. 5, right panel). The upper
boundary will be extended further northward in order to intersect with the N-NE grid. A comprehensive description of the east grid and its results are provided at Amorim et al. (2013).
There are distinct metrics to evaluate results of numerical ocean forecast models. Many tests are being considered to eval-uate the model results and compare with available measured oceanographic data. One of the best measurement programs in the Atlantic Ocean is the Prediction and Research Moored Array in the Tropical Atlantic (PIRATA), part of the Brazilian component of GOOS-Brazil. Figure 6 presents a comparison of 15◦C and
25◦C isotherms depths from the 1/4◦horizontal resolution
HY-COM model with an equatorial PIRATA buoy moored at 0◦N and
35◦W and a tropical PIRATA buoy moored at 10◦S and 10◦W.
Figure 6 – Comparison of 15◦C and 25◦C isotherm depths of the 1/4◦
hori-zontal resolution HYCOM model and two PIRATA buoys (upper panel shows data from an equatorial buoy and lower panel presents data from a tropical buoy).
Paiva et al. (2012) made the first version of a hindcast hydrodynamic database integrating the 1/24◦horizontal
resolu-tion south-southeast (SSE) regional HYCOM model for seven years from 2004 to 2010, using Cooper & Haines (1996) assim-ilation scheme for SLA extracted from AVISO altimetry gridded fields, synoptic atmospheric forcings from NCEP Reanalysis 2 fields, and local tidal forcing using the eight main harmonic components extracted from TPXO7.2 model. The results of tidal elevation show a very good agreement with measured data from
the Global Level Ocean Observing System (GLOOS-Brazil) in stations located inside the grid domain. As an example, the model sea surface elevation was able to capture both astronomi-cal and meteorologiastronomi-cal sea surface fluctuations at Maca´e, Rio de Janeiro (Fig. 7).
Figure 7 – Sea surface elevation of 1/24◦degree SSE HYCOM model (magenta
line) and measured GLOOS data at Maca´e, RJ (blue line) from September 15thto October 1st2005.
Figure 8 – Meridional component of the velocity of 1/24◦horizontal
resolu-tion SSE HYCOM (magenta line) and measured current data at locaresolu-tion FPSO-BR (offshore Cape S˜ao Tom´e, 1260-m water depth, measurement level –45 m) from January 1stto December 31st2007.
The BC flow at the vicinity of Cape S˜ao Tom´e is mainly southward due to the northward alignment of bathymetric con-tours in the region, but it is also affected by large meanders or eddies (Silveira et al., 2008) associated with baroclinic insta-bility mechanisms. The time series of meridional component of the velocity of 1/24◦horizontal resolution HYCOM obtained by
Paiva et al. (2012) showed a good agreement with measured current data at location of the production platform FPSO-BR
(located at 21.9322◦S, 38.8183◦W) in a local depth of 1260 m.
Figure 8 presents modeled and measured time series at level 45 m below the surface for a one-year time interval of available data (2007). The directional scatter diagrams of measured current data at this site and modeled results also shows good agreement with dominant currents flowing southward with similar velocity ranges (Fig. 9).
Figure 9 – Directional scatter diagrams of measured current data at location
FPSO-BR (offshore Cape S˜ao Tom´e, 1260-m water depth, measurement level – 45 m, up panel above) and 1/24◦horizontal resolution SSE HYCOM (down panel
above) from January 1stto December 31st2007.
DATA ASSIMILATION DEVELOPMENT APPROACH One of the long-term objectives of the REMO consortium is to implement an operational predictive model with a multivariate ocean data assimilation system. The assimilation of geophysi-cal data into dynamigeophysi-cal models of the ocean has become one of the most attractive scientific areas during the last decade. This
was mostly caused by the demands on improvements of climate predictability, increase in computational resources, and substan-tial developments in the global ocean observational system (Clark et al., 2009; Cummings et al., 2009). The main goal of data as-similation has historically been to improve short-range forecasts, since model predictability is strongly dependent on the initial con-dition (e.g., Kalnay, 2003). However, data assimilation has other important applications too. For instance, it is used in long-term integrations to produce reanalysis for climate studies and in sup-port and complement to monitoring systems.
Among the simpler methods are the ones in which both the model error covariance matrix and the gain matrix are prescribed, such as in the Bergthorsoon and Doos method (Daley, 1991) and simplifications of the optimal interpolation scheme (e.g. Derber & Rosati, 1989). Among the more complex methods are the four-dimensional variational method (4D-Var) and the Ensemble Kalman filter. The former requires the construction of a linear adjoint version of the model and a complex itera-tive process with forward and backward integrations in time to minimize the model error trajectory along an observational time window (Weaver et al., 2003; Moore et al., 2011). The latter uses the model equations to predict the model error covariance matrix and find the optimal Kalman gain matrix and the optimal anal-ysis in each assimilation step (Ghil & Malanotte-Rizzoli, 1991; Cohn, 1997; Evensen, 2003). However, the realization of both of these approaches is very difficult. For the 4D-Var, the calcu-lation of each analysis may take tens of iterations, high com-putational cost – since each iteration consumes approximately same computing time as two model forecasts in the observational window –, and the construction of the adjoint version of the non-linear model is not trivial. The Ensemble Kalman filter requires an ensemble forecasting system with tens of members, the in-version of matrices O(N), where N is the number of the observa-tions, commonly O(106-107), and several numerical techniques to enable its realization.
Data assimilation efforts under REMO considered several methods discussed in the previous paragraph and two main methodologies were initially selected considered for operational purposes. The first is based on the work of Mellor & Ezer (1991) and Ezer & Mellor (1994, 1997), hereafter referred to as E&M (Oliveira, 2009). This approach was implemented into HYCOM in operational mode in February 2012. The second is the Ensemble Optimal Interpolation (EnOI) (Evensen, 2003; Xie & Zhu, 2010). It is planned to substitute the E&M scheme in the operational system by the end of 2013. However, other techniques are also under investigation. One is a version of the Kalman Filter based
on the Fokker-Planck equation (Belyaev et al., 2001; Tanajura & Belyaev, 2009), and the other is the 4D-Var. The former was al-ready applied into HYCOM (Belyaev et al., 2012) and the latter is available for ROMS. For specific application with HYCOM, an optimal interpolation scheme and the Cooper & Haines (1996) scheme have also been employed to assimilate satellite along-track SLA (Lima & Tanajura, 2013; Tanajura et al., 2013).
In the E&M approach, synthetic data of vertical profiles of temperature and salinity are calculated from previously computed correlation factors considering the three-dimensional tempera-ture and salinity fields, SST and SSH. Since the correlation fac-tors are computed inz-space and HYCOM is a hybrid coordi-nate model, a strategy to transform the model variables from hybrid-coordinate toz-coordinate space was developed using Lagrangian multipliers to constrain the mean temperature and salinity in each model layer (Oliveira, 2009). The OI scheme was then applied to assimilate the synthetic data of potential temper-ature and density. The analyses were transformed back to hybrid coordinates and blended to other model variables using routines already available in HYCOM to produce the model initial condi-tion for the next assimilacondi-tion cycle.
Using a twin approach, Oliveira (2009) performed assimi-lation experiments inz-coordinates over the Southwest Atlantic (15◦S-35◦S, 32◦W-56◦W) to show that the E&M method was
correctly implemented in HYCOM and was able to constrain the ocean state towards the given data. The twin experiment was conducted by first performing a one-year run forced with Com-prehensive Ocean-Atmosphere Data Set (COADS) atmospheric fields, after a 30-year spin-up. Model results from day 201 un-til day 321 were saved to serve as “reality” and to provide SSH and SST as pseudo-data for the data assimilation run. Then, four 120-day runs from day 201 until 321 forced with the COADS cli-matological fields for the corresponding period were performed with the same initial condition taken on day 21 of the one-year run. The first run was a control run without assimilation, in which only the atmospheric forcing was able to modify the ocean state. The second run was an assimilation run, in which the model state was altered by the atmospheric forcing and by assimilation of SST every 5 days. The third and forth runs were similar to the second run, but only SSH and both SST and SSH, respectively, were given as data to the E&M scheme. Several evaluations were made. It was clear that the assimilation runs were quite distinct from the control run. In about a month, the differences were al-ready substantial. The vertical profile of the root mean square error (RMSE) of the temperature with respect to “reality” was calculated for each run considering the 120 days of simulation.
The best results were attained when both SSH and SST (fourth run) were used in the E&M scheme, as shown in Figure 10. The largest error of the control run was about 2◦C at 400 m depth.
The largest error of the fourth run was about 1◦C around 50 m
depth. These errors are related to misrepresentations of the mixed layer depth and of the thermocline structure.
Figure 10 – Vertical profiles of RMSE of temperature (◦C) for the runs
with-out assimilation (continuous line); with assimilation considering only SST (line with squares), with assimilation considering only SSH (line with circles) and with assimilation considering both SST and SSH (line with diagonal cross). Modified from Oliveira (2009).
The work by Oliveira (2009) was further developed in CHM under REMO cooperation. The correlations between SST, SSH and the vertical profiles T and S were recalculated taking the analysis of the HYCOM/NCODA system for the HYCOM with 1/12◦horizontal resolution. The inputs to the system are SSH
and SST from the HYCOM/NCODA analysis. This specific E&M based system was implemented in operational mode by CHM researchers starting in February 2012.
The first steps toward the EnOI started with the implemen-tation of a simplified OI scheme – with prescribed model er-ror covariance matrix – to assimilate along-track SLA data from Jason-1 and Jason-2 satellites. In this scheme, after having the SLA analysis, the mean SSH is added to it to produce an SSH field and feed the E&M or the Cooper & Haines (1996) scheme. The latter corrects the model layer thicknesses to match a given SSH field. This method is able to make substantial changes in the upper ocean circulation and on the thermocline structure, but not on the overall thermohaline profile. More details on the as-similation of SLA with OI and the use of the Cooper & Haines scheme can be found in this edition (Lima & Tanajura, 2013; Tanajura et al., 2013)
Unless higher performance computational resources are available, EnOI is expected to be the main data assimilation method employed into REMO operational models in the near future. The method is discussed in Evensen (2003) and in Sakov et al. (2012), but for HYCOM it follows very closely the work by Xie & Zhu (2010) and Xie et al. (2011). Today, the method is applied separately to assimilate T-S profiles from Argo floats, along-track satellite SLA data and SST data into HYCOM. Several tests were already performed and its implementation should be consolidated at the end of 2013, including a par-allelized version of the current sequential code. In the EnOI approach, an ensemble of model states is used to estimate the model error covariance matrix and the OI formula is applied to calculate the optimal analysis. The ensemble members are chosen considering the ocean high frequency intraseasonal vari-ability, so that a different error covariance matrix is calculated for each assimilation date. The members are selected from a long-term free model run without assimilation performed a priori. A simulation from 1998 until 2010 with daily outputs has been used to provide a set of states for the ensemble and used in the computational implementation of the method into HYCOM 1/4◦ horizontal resolution, which covers the whole
Atlantic from 78◦S to 50◦N.
In the first tests to assimilate T-S from Argo, different num-bers of ensemble memnum-bers were employed, from 30 to 132. The analysis was sensitive to the increase of ensemble members from 30 until 100 members. After that, only small differences were observed. In REMO, at least 100 members will be used in EnOI. As an example, results from an experiment with 132 mem-bers are presented. Argo data was assimilated each 3 days from 1 January until 31 March 2010, considering an observational win-dow of also 3 days. A weight function is applied in the obser-vational error matrix to consider larger errors for the older data with respect to the assimilation time. The model was forced by analyses from NCEP GDAS, namely, short and longwave fluxes, 2-m temperature, 2-m mixing ratio, 10-m winds and precipita-tion minus evaporaprecipita-tion each 6 h along the integraprecipita-tion. A total of 3647 T-S vertical profiles were assimilated. Following Xie & Zhu (2010), the observed T-S profiles and the model isopycnic coor-dinates were used to produce a synthetic “observed” layer thick-ness profile. These thickthick-nesses were assimilated to change the model layer thicknesses and the horizontal velocity. After that, T and S were assimilated separately, but in the isopycnic layers, a choice was made to maintain the analysis of S and diagnose T, as in Xie & Zhu (2010). In the assimilation run, T-S produced an analysis that was used as initial condition for the following
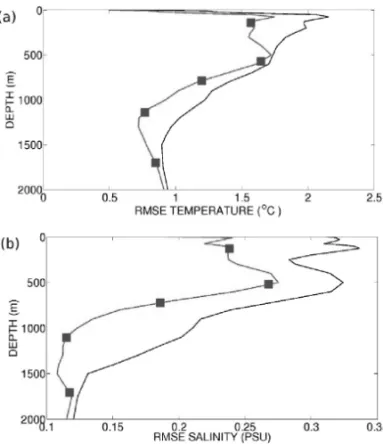
integration period. In the control run, no assimilation was em-ployed. The T and S RMSE for 24 h “forecasts” along the experi-ment were calculated with respect to Argo profiles. Therefore, this evaluation was performed with independent data, i.e., the RMSE of the 24 h “forecasts” was calculated with the Argo data that were used only in the next assimilation cycle. The results show that EnOI could substantially reduce the RMSE of T and S from surface until 2000 m, i.e., until where Argo data are available (Fig. 11). The errors are reduced by about 0.3-0.4◦C, and by more than 0.05 in
psu. It is clear that despite the benefits of the assimilation, the control run errors limit a more effective result of the assimilation run. Longer experiments are under way and they should produce larger reduction of the errors.
Figure 11 – Vertical profiles of RMSE with respect to Argo data for (a)
temper-ature (◦C) and (b) salinity (psu) for 24 h forecast from January 1stuntil March
31st2010 produced by the assimilation run (line with rectangles) and the control run (continuous line).
EnOI was also used to assimilate along-track SLA data from Jason-1 and Jason-2 satellites. The data were adjusted using the technique proposed in Tanajura et al. (2013) in this edition, in which the adjusted SLA mean and the model SLA mean along each satellite track were the same. Therefore, the model SLA is corrected only locally, by imposing troughs and ridges according to the modified data, without including in the analysis well-known biases that exist between the model SLA and the observed SLA. A free model run forced with NCEP GDAS reanalysis 2 from 1 January 1998 until 31 December 2010 produced the model
states for the ensemble and the initial condition for several ex-periments. An experiment was performed from 1 January to 31 March 2011 in which HYCOM was forced with NCEP reanalysis 2, without assimilation and with assimilation each 3 days taking a 24-hour observation window. The results showed a reduction of the centered RMSE of the 24 h SLA “forecast” calculated with respect to AVISO 1/3◦horizontal resolution gridded data from
about 0.09 m to about 0.075 m (Fig. 12). In addition, there was a substantial improvement in the correlation from less than 0.3 in the control run to about 0.55 in the 24 h forecast of the assimi-lation run in only 30 assimiassimi-lations during the 90 day integration. The standard deviations of the model control run and of the assim-ilation run are similar to each other, around 0.06 m, but smaller that the 0.09 m of the observations. This indicates that the model 1/4◦horizontal resolution is not enough to capture the observed
variability of SLA. HYCOM with higher horizontal resolutions, namely 1/12◦and 1/24◦, are also running in operational mode
in CHM. As soon as the EnOI is consolidated, it will also be implemented in these other grids. Other experiments will be done in which the observational window will be increased to 48 h. This increase, combined with improvements in horizontal res-olution and longer integrations, should produce more effective reduction of the error and increase in the correlation, as well as improvement in the ocean circulation forecast.
Figure 12 – Taylor diagram for SLA (m) from January 1stto March 31st2011 produced by the control run (rectangle) and the 24 h “forecast” of the assim-ilation run (circle) with respect to AVISO 1/3◦horizontal resolution gridded
data (triangle). The blue dashed semi-circles represent the centered root mean squared error with respect to AVISO data.
Successful preliminary experiments have been done to as-similate SST into HYCOM with EnOI. Reynolds SST analyses with
1/4◦ of horizontal resolution were assimilated and the overall
error of the analysis in the HYCOM 1/4◦SST was about 0.5◦C.
The assimilation of SST produced a large impact in the mixed layer temperature and it did not affect S or T below 300 m. Other SST fields with higher resolution will be used in future assimilation experiments.
The next step in the development of the EnOI into HYCOM will be the realization of assimilation of T-S Argo profiles, along-track SLA data and SST in a relatively short integration window, around 6 or 12 h. Also, the codes are under parallelization to meet the needs of the operational system.
As mentioned above, other initiatives in data assimilation involve a version of the Kalman Filter into HYCOM and the 4D-Var into ROMS. The former was proposed by Belyaev et al. (2001). It uses the Fokker-Planck equation in the formulation to calculate the Kalman Gain matrix. The model error co-variance matrix in this approach is estimated from the joint probability density distribution of the errors among two observational points and from the solution of the Fokker-Planck equation, assuming that the model error is a stochastic diffusive variable. The feasi-bility, applications and limitations of this scheme are discussed in Tanajura & Belyaev (2002, 2009). Application into HYCOM including a comparison with an Ensemble Kalman Filter and a simplified OI is shown in Belyaev et al. (2012).
Assimilation into ROMS under REMO will get momentum in 2013 with planned experiments of 4D-Var scheme. It is also planned for the future that the EnOI code used into HYCOM would be adapted to ROMS. The initial experiments will use a sub-grid extracted from the ROMS 1/24◦model off the
Brazil-ian south-southeast coast. The 4D-Var is already available with ROMS (Moore et al., 2011), but its realization is not trivial, since its formulation and algorithm are quite complex and the compu-tational cost is high. International collaboration in the framework of GODAE OceanView is under way to promote a solid and fast development of assimilation into ROMS.
REMOTE SENSING AND OCEANOGRAPHIC OBSERVATIONS
As previously discussed in the design of REMO forecasting system, an important task group is related with sea surface mote sensing and oceanographic observations. Regarding re-mote sensing, efforts have been concentrated on developing routine methodologies to estimate SST and SSH fields using available data from environmental satellites. Presently, the esti-mated SST fields via remote sensing have high standards,
how-ever, there is a problem associated with cloud coverage, which is still a challenge for generating clear images to identify oceano-graphic features in tropical and equatorial regions with an ex-tensive cloud coverage rate. In order to minimize the cloud-contaminated pixels in the SST field, REMO remote sensing spe-cialists developed a cloudy free SST composition method to gen-erate a daily blended (infrared and microwave) SST in a regu-lar horizontal grid (0.05◦). The merge (or composition) of SST
AVHRR (Advanced Very High Resolution Radiometer) data – with spatial horizontal resolution of 0.081◦– from NOAA
satel-lites series and SST TMI (Microwave Imager) data from TRMM (Tropical Rainfall Measuring Mission) – with spatial horizon-tal resolution of 0.25◦– is based on Barnes Objective Analysis
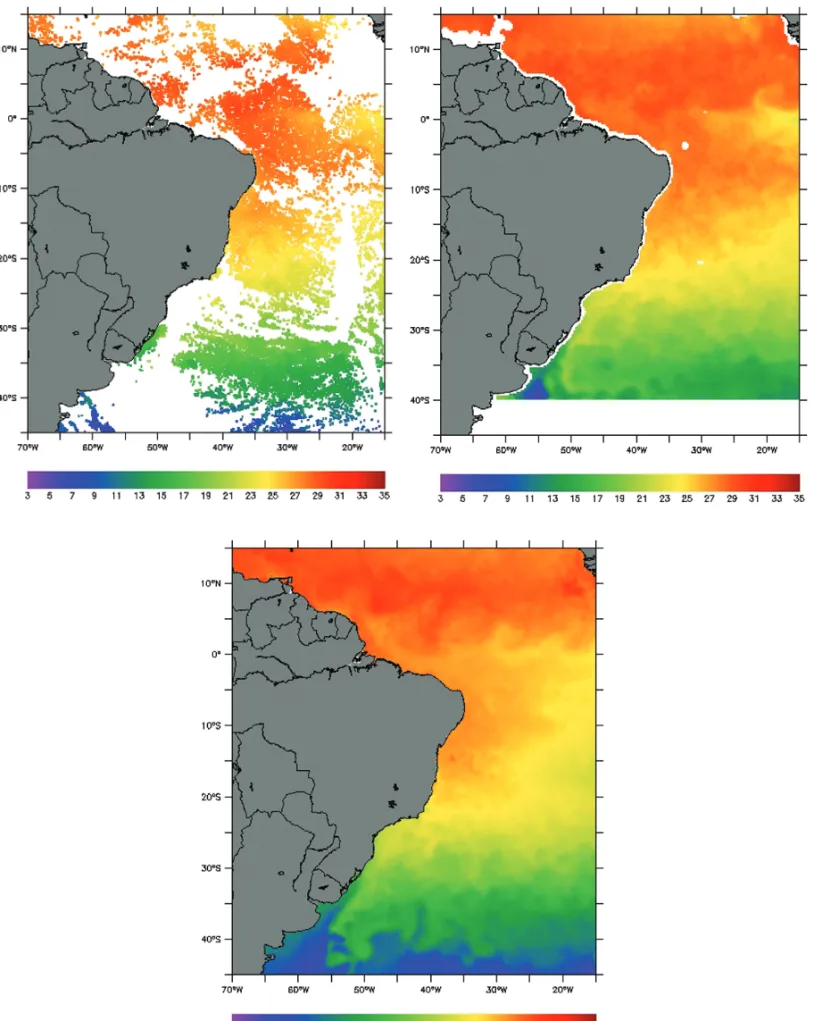
(OA) method (Barnes, 1964). The main steps of the methodology are extracting SST data and removing noise, selecting cloud-free SST values for a specified continuous time period (it has been used 24 hours), applying the OA, land masking; and systemati-cally validating the remote SST results againstin situ SST data. Figure 13 presents an example of the SST field composition (AVHRR and TMI) for REMO’s METAREA V modeled region.
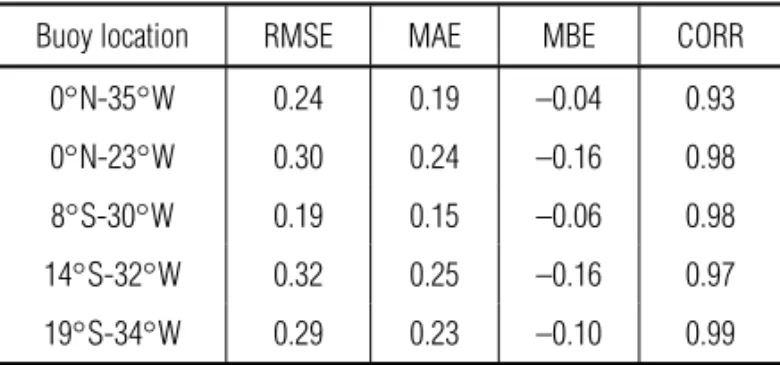
REMO’s SST composition algorithm has achieved very good results. Statistic parameters such as the RMSE (Root Mean Squared Error), MAE (Mean Absolute Error), MBE (Mean Bias Error), CORR (Correlation) have been used to evaluate composed fields againstin situ SST (at approximately 1.0-m depth) from five PIRATA buoys. Results for the period August 1st, 2005 to July 31st, 2006, are presented in Table 2.
Table 2 – RMSE, MAE, MBE and CORR statistics for comparison of estimated
fieldsversus in situSST (1-m depth) at five PIRATA buoy sites from Aug. 2005 to Jul. 2006.
Buoy location RMSE MAE MBE CORR
0◦N-35◦W 0.24 0.19 –0.04 0.93
0◦N-23◦W 0.30 0.24 –0.16 0.98
8◦S-30◦W 0.19 0.15 –0.06 0.98
14◦S-32◦W 0.32 0.25 –0.16 0.97
19◦S-34◦W 0.29 0.23 –0.10 0.99
Concerning data assimilation on ocean modeling, sea sur-face altimetry data play an important hole as they provide rel-evant information about ocean dynamics. Currently, as of our knowledge, there are no free publically available near-real time altimetric data with all required filtering, homogenization and specific geophysical and atmospheric corrections required to provide a high standard product to be directly assimilated into
Figure 13 – The cloud-free SST composition (lower central panel) is obtained using AVHRR SST (upper left panel) and TMI SST (upper right panel). This example
numerical ocean models with accuracy levels that would permit full resolution of detailed meso-scale phenomena in the west-ern South Atlantic Ocean. REMO’s remote sensing specialists are pursuing to develop near-real time routines for establish-ment of a solid and reliable SSH framework for data assimila-tion purposes. As on-going research, a joint project was estab-lished with French research company Collect Localisation Satel-lites (CLS) to develop an along-track sea level anomaly (SLA) product level 3 and gridded SLA product oriented to some regions of the Brazilian shelf and ocean border, in order to fulfil assimila-tion and assessment needs of the models. This project is called ATOBA, an acronym for “Altimetry Tailored and Optimised for Brazilian Applications”.
Figure 14 – Difference of variance of the SLA estimated by FES2012 and
GOT4V8 tidal models. This is a product of the cooperation project ATOBA be-tween REMO and CLS.
Within the cooperative framework of this project, it has been done studies to refine along-track filtering and sub-sampling, evaluation and choice of atmospheric (wet troposphere) and geo-physical (ocean tides) corrections, and validation to improve the along-track SLA data. Concerning the gridded data prod-uct, the choice of adaptative time and space scales for Objec-tive Analysis has been reviewed. One of the Brazilian regional products uses tides estimated by FES2012 model (Carr`ere et al., 2012) as ocean tidal corrections. The comparison between FES2012 and GOT4V8 that is used in the Ssalto/DUACS SLA data processing can be seen in Figure 14. This result shows that FES2012 reduces the SLA variance near the coast, what represents better ocean tidal corrections. Figure 15 presents spectra comparison between along-track SLA from ATOBA and Ssalto/DUACS available at AVISO website. The filtering
tech-nique used in ATOBA data processing can better preserve the meso-scale signals.
Figure 15 – Comparison of the mean spectrum of Jason-2 SLA against
Salto/Duacs and ATOBA-V1 data processing in the South Atlantic region between latitudes 30◦S and 40◦S.
Another important component of any oceanic forecasting system is an available network of data measurement stations that would provide information to be assimilated or to evalu-ate model results. This is a critical component because it re-quires expensive resources as metocean equipment, oceano-graphic vessels, and specialized personnel to deploy and re-cover moorings and metocean buoys. There are already some on-going initiatives of continuous oceanographic measurements in the Brazilian border of South Atlantic ocean, such as the PIRATA (Bourl`es et al., 2008) and the PNBOIA (portuguese acronym for “Programa Nacional de Boias”), both programs with participation of CHM. REMO is collaborating to improve and maintain meto-cean equipment of existing PNBOIA buoys, and deploying other buoys and moorings that would provide oceanographic informa-tion on two critical capes of southeast Brazilian shelf: Cabo de S˜ao Tom´e and Cabo Frio. Silveira et al. (2008) describe instabil-ities of the BC in this region and show that vorticity waves as-sociated with BC meandering along the shelf break is one of the mechanisms associated with large eddy growth on S˜ao Tom´e and Cabo Frio capes. Two pairs of mooring are designed to be de-ployed on this region to provide information to be assimilated in the oceanic models with objective to improve forecasting capa-bility of meso-scale activity. Figure 16 shows locations of meto-cean buoys and moorings with REMO collaboration. It is also pre-sented some proposed transects for gliders or XBTs deployment. Table 3 presents their existing or planned configurations.
Figure 16 – Oceanographic measurements with REMO collaboration for the
S-SE Brazilian ocean border: metocean buoys PN1, PN2 and PN3 from PNBOIA (triangles), moorings from UFRJ (circles) and proposed gliders or XBTs transects GT1, GT2 and GT3 (solid blue lines).
It should also be pointed out that the four planned moorings to be deployed by UFRJ with REMO funding will be equipped with metocean surface buoys designed and manufactured in Brazil, denominated BMO-BR (Mendes et al., 2011) as presented in Figure 17. High costs associated with purchasing, operating and maintaining foreign built oceanographic equipment in Brazil is one of the main problems that limits widespread use of these ocean observing systems. REMO is pursuing to use equipment with low operative costs. The 2.5 m diameter BMO-BR hull was also designed to measure surface gravity waves and field tests were already done with good results. This is another positive action of the REMO consortium to improve physical oceano-graphic sciences in Brazil.
CONCLUDING REMARKS
This paper outlined various aspects associated with design and implementation of the REMO modeling consortium, a Brazilian initiative on operational ocean forecasting and physical oceano-graphy. As presented in previous sections, initial results are very promising because they bring together expertise of all involved institutions. The main goal of developing numerical ocean models with assimilative skills for the South Atlantic basin and Brazilian continental shelf is being closely pursued.
Design of the development, observational and operational phases were carefully discussed among participants in such a way that REMO would consolidate a reliable and long-term initiative with significant contributions of Brazilian Navy, universities, and interested public and private partners that would like to contribute to this project. The main problems associated with lack of
expe-rienced specialists on ocean forecasting, adequate computational resources for operational purposes and lack ofin situ observa-tions are gradually being worked out. The pathway for that has been achieved by:
i) training graduate students at participant universities; ii) improving computational resources by installing
High-Performance Computers (HPC) at universities and CHM; iii) gradually mounting an observational network to provide
metocean data for assimilation and model evaluation purposes.
While the practical aspects of ocean forecast are kept in mind, and are considered as a desirable forthcoming goal, spe-cial emphasis in REMO is also put in academic and scientific oriented studies. Some of the issues that should be under future investigation are: surface thermodynamic forcing feedback and its importance in setting the baroclinic structure of the upper ocean, connection to deeper layers through subduction and ven-tilation of the thermocline, effects of meso-scale processes upon large scale aspects of the circulation and climate variability, eddy-current and eddy-topography interactions in the Brazil Cur-rent and their impact on eddy development and translation, open boundary forcing, and data quality control for assimilation purposes.
The complex flow of the Brazil Current with its meanders and eddies along the continental slope is very difficult to accu-rately forecast, because it requires better estimates of the SLA fields close to the shelf break along the western border of the South Atlantic Ocean. REMO’s remote sensing task group is strongly pursuing to improve the quality of SLA estimates for this region of the Brazilian shelf in order to increase the skills of altimetry assimilation in our operational models. For the modeling stand point, efforts are concentrated on testing a new higher horizontal and vertical resolution grid for the Atlantic Basin domain extending the western boundary into the Indian Ocean in order to properly solve the contribution of Agulhas eddies. This model will be fully assimilative using an EnOI data assimilation scheme for both surface SLA and SST fields and sub-surface T&S fields.
It is expected that ongoing work under REMO will be an ef-fective contribution to operational oceanography in Brazil, and on an international level, collaboration with the GODAE Ocean-View project. The operational models results can be accessed on web sites<http://www.mar.mil.br/dhn/chm/meteo/prev/modelos>or <http://www.rederemo.org>, the last site also presents
informa-Table 3 – Configuration of existing and planned oceanographic measurements with REMO collaboration.
Index Location Depth Measurements
ST1 Upper slope Cabo S˜ao Tom´e 300 m meteoro, long range current and T profile
ST2 Offshore Cabo S˜ao Tom´e 200 m meteoro, long range current and T profile
CF1 Upper slope Cabo Frio 300 m meteoro, long range current and T profile
CF2 Offshore Cabo Frio 2000 m meteoro, long range current and T profile
PN1 PNBOIA buoy Rio Grande 200 m wave, meteoro, short range current profile
PN2 PNBOIA buoy Santa Catarina 200 m wave, meteoro, short range current profile
PN3 PNBOIA buoy Santos 200 m wave, meteoro, short range current profile
GT1 Pre-Salt Santos Basin transect 100m-2500m T and S profiles
GT2 Campos Basin transect 100m-2500m T and S profiles
GT3 Cabo de S˜ao Tom´e transect 100m-2500m T and S profiles
Figure 17 – Brazilian metocean buoy BMO-BR that will be used in REMO moorings. Left panel presents buoy dimensions and right panel
is a first buoy under prototype field tests.
tion about participants, scientific publications and ongoing ac-tivities. The scientific results and products developed by REMO may reach a broad variety of scientists, students and general users of oceanographic information so that other applications can become feasible to promote benefits to the Brazilian soci-ety. New participants are encouraged to participate in the net-work contributing with their expertise to improve results, join-ing the scientific group REMO through the site that catalogs the directory of Brazilian research groups. This is an initiative
of the Conselho Nacional de Desenvolvimento Cient´ıfico e Tec-nol´ogico (CNPq).
As final remark, one of the main aspects of any oceanographic operational system is its sustainability because it requires expen-sive and continuous resources, such as HPC facilities, special-ized researchers to operate the models and vessels to deploy and recover metocean equipment. It is not reasonable to believe that a single funding source would be able to maintain such com-plex systems over a long period of time, covering all operational
oceanography needs of an extensive ocean region as the Brazilian territorial waters, also called the “Blue Amazon”. REMO is open to share its developed products and receive funding contributions from public partners (interested ministries and governmental in-stitutions), as well as from private companies from sectors that would greatly benefit from the use of operational oceanography products, such as oil & gas operators, offshore services, navi-gation, fisheries, etc. The capability to provide useful products to distinct partners will probably be the most important point to build up a funding framework to maintain REMO over a mid or long time frame, as well as being of direct benefit to Brazilian scientific knowledge over its territorial waters.
ACKNOWLEDGMENTS
The authors would like to acknowledge Petr´oleo Brasileiro S.A. – PETROBRAS for providing research funds and Agˆencia Nacional do Petr´oleo, G´as Natural e Biocombust´ıveis (ANP) for their ap-proval. The Brazilian Navy also provided useful resources, such as the labour of specialized officers, a spacious building for re-searchers and additional computational power. Participant univer-sities (UFRJ, UFBA, USP and FURG) provided researchers with valuable expertise. More than 50 researchers have collaborated with REMO over the last six years. Nowadays they are about 25. We would appreciate to explicitly thank all of them, but unfortu-nately, it is not possible to name them all here. We will choose the ones that have directly helped to build this article providing fig-ures and comments: Marcelo Andrioni (CENPES), Leonardo Lima and Davi Mignac (UFBA), Victor Daher (CHM), Claire Dufau (CLS) and Rosa Paes, Mariela Gabioux and Vladimir Costa (UFRJ). REFERENCES
AMORIM FN, CIRANO M, MARTA-ALMEIDA M, MIDLETON JF & CAM-POS EJD. 2013. The Seasonal Circulation of the Eastern Brazilian Shelf between 10S and 16S: a modeling approach. Continental Shelf Research, 65: 121–140.
ANP – AGˆENCIA NACIONAL DO PETR´OLEO, G´AS NATURAL E BIOCOM-BUST´IVEIS. 2013. Boletim da Produc¸˜ao de Petr´oleo e G´as Natural – Maio 2013. Boletim elaborado pela Superintendˆencia de Desenvolvimento e Produc¸˜ao. 26 pp. Available on: <http://www.anp.gov.br/>. Access on: July 11, 2013.
BARNES S. 1964. A Technique for Maximizing Details in Numerical Weather Map Analysis. J. Appl. Meteor., 3: 395–409.
BELYAEV KP, TANAJURA CAS & O’BRIEN JJ. 2001. A data assimilation method used with an ocean circulation model and its application to the Tropical Atlantic. Appl. Math. Modelling, 25: 655–670.
BELYAEV KP, TANAJURA CAS & TUCHKOVA N. 2012. Comparison of methods for Argo drfiters data assimilation into a hydrodynamical model of the ocean. Oceanology, 52: 643–653.
BLECK R & BOUDRA DB. 1981. Initial testing of a numerical ocean circulation model using a hybrid (quasi-isopycnic) vertical coordinate. J. Phys. Oceanogr., 11: 755–770.
BLECK R. 2002. An oceanic general circulation model framed in hybrid isopycnic-cartesian coordinates. Ocean Modelling, 37: 55–88. BLUMBERG AF & MELLOR GL. 1987. A description of a three-di-mensional coastal ocean circulation model. In: HEAPS N (Ed.). Three-dimensional ocean models. AM. Geophys. Union, 16 pp.
BOURL`ES B, LUMPKIN R, McPHADEN MJ, HERNANDEZ F, NOBRE P, CAMPOS E, YU L, PLANTON S, BUSALACCHI AJ, MOURA AD, SERVAIN J & TROTTE J. 2008. The PIRATA program: history and accomplish-ments of the 10 first years tropical Atlantic observing system’s backbone. Bulletin of the American Meteorological Society, 89(8): 1111–1125. BRASSINGTON GB. 2011. System Design for Operational Ocean Fore-casting. In: SCHILLER A & BRASSINGTON GB (Eds.). Operational Oceanography in the 21stCentury, Springer S+B Media B.V: 441–486. BRYAN K. 1969. A Numerical Method for the Study of the Circulation of the World Ocean. Journal of Computational Physics, 4: 347–376. CARR`ERE L, LYARD F, CANCET M, GUILLOT A & ROBLOU L. 2012. FES2012: A new global tidal model taking advantage of nearly 20 years of altimetry. Proceedings of meeting “20 Years of Altimetry”, Venice. 22 pp. CHARNEY JG, FJORTOFT R & VON NEUMANN J. 1950. Numerical inte-gration of the barotropic vorticity equation. Tellus, 2: 237–254. CLARK C, HARRISON D, JOHNSON M, BALL G, GONI G, WILSON S, BENVENISTE J, FELLOUS JL, GOHIL B, JACOBS G, LE TRAON P, LINDSTROM E, MINGSEN L, NAKAGAWA K & PARISOT F. 2009. An overview of global observing systems relevant to GODAE. Oceanogra-phy, 22: 22–33.
COHN S. 1997. An introduction to estimation theory. J. Meteor. Soc. Japan, 75: 257–288.
COOPER M & HAINES K. 1996. Altimetric assimilation with water prop-erty conservation. J. Geosphys. Res., 101 (C1): 1059–1077.
COSTA FILHO FH. 2005. Barracuda and Caratinga FPSO Design. Proceedings of the 2005 Offshore Technology Conference (OTC 2005). Paper number 17058, 7 p.
CUMMINGS J., BERTINO L, BRASSEUR P, FUKIMORI I, KAMACHI M, MARTIN MJ, MOGENSEN K, OKE P, TESTUT CE, VERRON J & WEAVER A. 2009. Ocean data assimilation systems for GODAE. Oceanography, 22: 96–109.
DALEY R. 1991. Atmospheric data analysis. Cambridge University Press, Cambridge, 457 pp.
DERBER J & ROSATI A. 1989. A global data assimilation system. J. Phys. Oceanogr., 19: 1333–1347.
DOMBROWSKY E, BERTINO L, BRASSINGTON GB, CHASSIGNET EP, DAVIDSON F, HULBURT HE, KAMACHI M, LEE T, MARTIN MJ, MEI S & TONANI M. 2009. GODAE systems in operation. Oceanography, 22(3): 80–95.
EVENSEN G. 2003. The ensemble Kalman filter: Theoretical formulation and practical implementation. Ocean Dyn., 53: 343–367.
EZER T & MELLOR GL. 1994. Continuous assimilation of Geosat altime-ter data into a three-dimensional primitive equation Gulf Stream model. J. Phys. Oceanogr., 24: 832–847.
EZER T & MELLOR GL. 1997. Data Assimilation Experiments in the Gulf Stream Region: How Useful Are Satellite-Derived Surface Data for Now-casting the Subsurface Fields. Jour. of Atmospheric and Oceanic Tech-nology, 14: 379–1391.
GABIOUX M, COSTA VS, SOUZA JMA, OLIVEIRA BF & PAIVA AM. 2013. Modeling the South Atlantic Ocean from medium to high resolution. Revista Brasileira de Geof´ısica, 31(2): 229–242.
GHIL M & MALANOTTE-RIZZOLI P. 1991. Data assimilation methods in meteorology and oceanography. Adv. Geophys., 33: 141–266. KALNAY E. 2003. Atmospheric modeling, data assimilation and pre-dictability. Cambridge University Press, 341 pp.
LIMA JAM, RIBEIRO OR, CECOPPIERI W & MATHESON GG. 2009. Directional extreme current profiles based on complex orthogonal func-tions (C EOF) for offshore design. Proceedings of the ASME 28th Inter-national Conference on Ocean, Offshore and Arctic Engineering (OMAE 2009). Paper number 79467, 8 pp.
LIMA LN & TANAJURA CAS. 2013. Estudo do impacto da assimilac¸˜ao de dados altim´etricos na previsibilidade de curto-prazo do modelo oceˆanico HYCOM sobre a Metarea V do Oceano Atlˆantico. Revista Brasileira de Geof´ısica, 31(2): 271–288.
MELLOR GL & EZER T. 1991. A Gulf Stream model and an altimetry assimilation scheme. J. Geophys. Res., 96: 8779–8795.
MENDES ALT, LIMA JAML, BARREIRA RA, PEREIRA RM, SOUZA L & PIRES C. 2011. Desenvolvimento de uma boia-ond´ografo de projeto Nacional. Proceeding do XIV Congresso Latino-Americano de Ciˆencias do Mar – XIV COLACMAR, Cambori´u, SC, Brazil.
MOORE A, ARANGO H, BROQUET G, POWELL B, ZAVALA-GARAY J & WEAVER A. 2011. The Regional Ocean Modeling system (ROMS) 4-dimensional variational data assimilation systems Part I: System overview and formulation. Prog. Oceanogr., 91: 34–49.
MOURA AD. 1996. Von Neumann e a previs˜ao num´erica de tempo e clima. Estudos Avanc¸ados [online]. 10 (26): 227–236. Available on: <http://www.scielo.br/scielo.php?script=sci
arttext&pid=S0103-40141996000100021&lng=en&nrm=iso>. Access on: July 11, 2013.
OLIVEIRA JF. 2009. Um esquema de assimilac¸˜ao de dados oceano-gr´aficos para o modelo oceˆanico HYCOM ao largo da costa sudoeste brasileira. Ph.D. Thesis. Laborat´orio Nacional de Computac¸˜ao Cient´ıfica (LNCC) 157 pp.
PAIVA AM, CHASSIGNET EP & MARIANO A. 2000. Numerical simu-lations of the North Atlantic Subtropical Gyre: Sensitivity to boundary conditions. Dyn. Atmos. Oceans, 32: 209–238.
PAIVA AM & CHASSIGNET EP. 2001. The impact of surface flux param-eterizations on the thermodynamic adjustment of a North Atlantic ocean model. J. Phys. Oceanogr., 31(7): 1860–1879.
PAIVA AM, GABIOUX M, COSTA VS & OLIVEIRA BF. 2012. Base Hidro-dinamica SSE. Relat´orio do Grupo de Estudos de Processos Oceˆanicos, ´Area de Engenharia Costeira e Oceanogr´afica, Programa de Engenharia Oceˆanica, COPPE, UFRJ, 120 pp.
RICHARDSON LF. 1922. Weather prediction by numerical process. London, University Press. 236 p.apud. MOURA 1996.
SAKOV P, COUNILLON F, BERTINO L, LISAETER KA, OKE PR & KORABLEV A. 2012. TOPAZ4: an ocean-sea ice data assimilation sys-tem for the North Atlantic and Arctic. Ocean Science, 8: 633–656. SILVEIRA ICA, LIMA JAM, SCHMIDT ACK, CECCOPIERI W, SARTORI NETO A, FRANCISCO CPF & FONTES RFC. 2008. Is the Meander Growth in the Brazil Current System off Southeast Brazil due to Baroclinic insta-bility? Dynamics of Atmospheres and Oceans, 45: 187–207.
SHCHEPETKIN AF & McWILLIAMS JC. 2005. The Regional Ocean Modeling System: a split explicit, free surface, topography following coordinates ocean model. Ocean Modelling, 9: 347–404.
SEMTNER AJ. 1995. Modeling Ocean Circulation. Science, 269: 1379– 1385.
SMAGORINSKY J. 1983. The beginnings of numerical weather predic-tion and general circulapredic-tion modeling: early recollecpredic-tions. Advances in Geophysics, 25: 3–37.
TANAJURA CAS & BELYAEV KP. 2002. On the oceanic impact of a data assimilation method on a coupled ocean-land-atmosphere model. Ocean Dynamics, 52: 123–132.
TANAJURA CAS & BELYAEV KP. 2009. A sequential data assimilation method based on the properties of diffusion-type process. Appl. Math. Model., 33: 2165–2174.
TANAJURA CAS, COSTA FB, SILVA RR, RUGGIERO GA & DAHER VB. 2013. Assimilation of sea surface height anomalies into HYCOM with an Optimal Interpolation scheme over the Atlantic Ocean Metarea V. Revista Brasileira de Geof´ısica, 31(2): 257–270.
WEAVER AT, VIALARD J & ANDERSON DLT. 2003. Three- and four-di-mensional variational assimilation with a general circulation models of