Estimating effects of Haitian immigration on the
Brazilian labor market
FGV/DAPP
*Wagner Faria de Oliveira
†2018, Working Paper
.
Abstract
This article aims to study the effects of the recent Haitian immigration to Brazil on labor market outcomes of natives such as mean wage and net formal admissi-ons, where the municipalities are the units of analysis. Due to its inherent natural experiment characteristic, the identification strategy for the event is a compara-tive interrupted time series design, where the comparison group is obtained with a nearest-neighbor matching using a propensity score procedure. We used mainly data from formal labor registries provided by the Brazilian Ministry of Labor, also combined with IBGE’s sources to obtain the covariates for the propensity score esti-mation. After controlling the bias, we find no evidence that the Haitian immigration had an impact (either positive or negative) in the labor market outcomes of natives. The article is part of FGV/DAPP’s project called "An assessment of the potential impacts of the new migration flows in Brazil".
Keywords: Labor Economics. Immigration Economics. Quasi-experimental Design
and Analysis.
*Fundação Getulio Vargas, Departament of Public Policy Analysis (http://dapp.fgv.br/). †Researcher at FGV/DAPP and PhD student at FGV/EPGE. Contact: [email protected].
Estimating effects of Haitian immigration
on the Brazilian labor market
1
Introduction
This study intends to measure the effects of Haitian immigration to Brazil after an earthquake in 2010 for Brazilian formal labor market outcomes for natives such as mean real wages and dismissal rate. The study will use quasi-experimental analysis to estimate those effects, based on a comparative interrupted time series design, combined with a nearest neighbor matching based on a propensity score to create a comparison group. Similar issues were already analyzed in the literature, but there is still no study of this kind for this specific case.
After this brief introduction, section two brings the context of analysis, containing a brief explanation of the phenomenon. Next, at section three, we bring up some literature on the topic and we discuss the identification strategy for the study. In section four we present a description of the data used for the estimates. Section five brings the main results and findings, while section six finishes the article with a discussion of those results and pointing the next steps for further research.
2
Context
On January the 12𝑡ℎ of 2010, The Republic of Haiti suffered a massive earthquake
whose epicenter, close to the capital city of Port-au-Prince, has had catastrophic conse-quences for the country’s population. The Red Cross estimated that around three million people were affected by the earthquake1, of which 316,000 people died, according to a
2011 revised estimate presented by Haitian then Prime Minister Jean-Max Bellerive2.
Considering that Haiti’s population in 2010 was around 9.9 million, the earthquake had affected almost a third of the country’s population and had killed just over 3%of the local population. Although in a purely quantitative frame, we can conclude that the earthquake had an overwhelming impact for the Haitian population.
1 http://www.cbsnews.com/news/red-cross-3m-haitians-affected-by-quake/ 2 http://www.reuters.com/article/worldNews/idBRSPE70B0N620110112
Besides that, Haiti is one of the poorest countries on the planet3 and with a low
level of human development4. This is associated with a lack of resilience in relation to this
type of natural phenomenon. Faced with the restrictions imposed on the country for its full recovery, the volume of Haitians leaving the country in search for better living conditions increased considerably. By using the United Nations estimates5 for the international stock
of migrants, we calculated the proportion of Haitians living outside Haiti, which was 9.9%
in 2010 and has gone up to 10.1% in 2015, which is equivalent to an increase of 103,215 Haitians living outside Haiti. In addition, according to UNHCR (2015)6 - the United
Nations High Commissioner for Refugees - the total number of persons of concern7 from
Haiti jumped from 33,097 in 2010 to 73,094 in 2014.
Brazil was one of the main destinations for Haitians since 2010. If we look at the same data from UNHCR (2015), we see that the number of Haitians who entered the country under refugee or similar conditions moved from just seven in 2009 to 595 in 2010 and reached 29,241 in 2014. However, this number is probably smaller than the set of all Haitians who have actually come to settle permanently in Brazil. If we look only at the formal labor market, we see that the number of Haitian records reached 30,484 in 2014, of which 29,799 arrived after 20108. If we add to this the amount of Haitians who worked in informality or who have sought to start a business of their own or who were undocumented, the volume is probably much larger than these figures show. As an illustration, the data from the International Traffic System (STI) of the Brazilian Federal Police (OBMIGRA,2016), shows that 72,406 Haitians entered Brazilian borders between 2010 and 2015, while 12,656 came out in the same period, resulting in a net inflow of 59,750.
At first, Haitians began the normal process of requesting refuge from the Brazilian
3 According to the World Bank classification (WORLD BANK, 2017), Haiti is part of the low-income
group of countries, with a Gross National Income (GNI) per capita of less than US$ 1,005 in 2010, being the 187𝑡ℎin a ranking of 215 countries in that year.
4 Haiti was ranked 145𝑡ℎ in 2010’s HDI (Human Development Index) ranking according to this year’s
Human Development Report (UNDP, 2011).
5 UN-DESA, 2015. 6
http://popstats.unhcr.org/en/persons_of_concern
7 "Persons of concern"refers to the sum of all groups of interest of UNHCR including refugees, internally
displaced persons, asylum seekers, etc.
8 Based on data from the Annual Social Information Record - RAIS - a database provided by the
Brazilian Ministry of Labor (OBMIGRA,2016). In this case, all individual records were used regardless of whether or not they were active on December the 31𝑡ℎ, i.e. we considered all Haitians who had at
authorities, but as they did not generally meet the criteria of CONARE (National Com-mittee for Refugees9) for granting refuge, many requests were rejected. As a response, the
CNIg (National Immigration Council10) established a recommendation to grant resident
status to Haitians on human rights grounds by means of a normative resolution11, as
shown by Fernandes, Milesi e Farias (2012).
Even though the main gateway for Haitians in Brazil was the land border in the North and Central-West regions, Haitian immigrants were not evenly distributed throughout the Brazilian territory, nor were they concentrated only on the major economic centers. In fact, the majority of Haitians in Brazil are located in the South, which is, curiously, the most distant Brazilian region from Haiti12. By looking at the RAIS 2014
data, we can see that 59.2% of formally working Haitians were in the South region (the
state of Santa Catarina being the main destination), followed by the Southeast, with 28.2%, mainly due to the concentration in the metropolitan region of São Paulo. All the
other regions together responds to only 12.6% of this population. It is worth noting that
the Northeast is residence to only 0.3%of Haitians with a formal job contract.
Several hypotheses may arise to explain this concentration in the southern-most region of the country. First, there is the social networking effect, that is, the fact that immigrants tend to migrate to areas where national communities from that country were already established13. In fact, considering 2014 RAIS data, there are 685 records14 of
Haitians living and working in Brazil before 2010, of which 407 (59.4%) located in the South region. Secondly, immigrants may have chosen places that offered better opportu-nities, both in terms of labor market outcomes and in terms of economic performance or well-being. In fact, the average per capita income of the locations where previous
Hai-9 Body linked to the Brazilian Ministry of Justice composed by members of other ministries and civil
society entities, responsible for examining refuge requests and promoting refugee assistance actions.
10 Body linked to the Brazilian Ministry of Labor with representatives from other public administration
bodies and civil society entities. It is responsible for formulating migration policies in Brazil and solving cases that are not supported by existing legal provisions or with different possible interpretations.
11 Normative Resolution 97/2012, available at:
http://acesso.mte.gov.br/trab_estrang/ resolucoes-normativas.htm. Accessed on 17/02/2017
12 This suggests that using distance as an instrument in an IV design might not be very suited to this
case as it was inKugler e Yuksel (2008)’s study. We will come back to this issue later.
13 Borjas(1995a) shows that immigrants tend to be located in areas with higher percentage of immigrants
living previously in the US.
14 This number is quite different from that shown in the Brazilian Demographic Census (IBGE,2010),
which records only 54 Haitians living in the country in 2010. As it is an administrative registry, it is natural that RAIS shows a larger number than the Census, which is based on sampling.
tian migrants were located is 41.5%higher than the national per capita income in 201015,
suggesting that places with a better living standard would have been preferred by immi-grants.
We can also verify differences in labor market outcomes. Based on data from CAGED16, it can be seen that in 2009 there was a general positive balance between
admissions and dismissals in the labor market of around 400,000, from which 220,000 in cities chosen by Haitians after 2010 and 180,000 in the other cities. Weighted by the population, these values respectively represent 0.25%and 0.18%. This data suggests that Haitians would have chosen places that, on average, presented greater possibilities in terms of labor market integration. Such information suggests the need to control for these aspects to have an unbiased estimate of the Haitian immigration effect on the labor market of those places.
3
Quasi-experimental Design
Before the earthquake, the presence of Haitians in Brazil was actually inexpressive. Thus, the mass arrival of Haitians who started to compose the Brazilian labor market - as shown by the RAIS data reported above - constitutes a situation in which an exogenous cause may have affected the local labor market, a situation that would characterize a na-tural experiment. The observation of a phenomenon whose causality seems to be strongly tied to an exogenous cause (an environmental catastrophe in this case) is convenient for causal inference studies, since it contributes to avoid self-selection bias. Nevertheless, it is necessary to give a special treatment to this subject. The fact that Brazil has been a major destination for Haitians over the last few years cannot be attributed to mere chance, given that the United Nations Stabilization Mission in Haiti (MINUSTAH) has been led by Brazil since 2004.
The reason why Haitians came to Brazil cannot be reduced to the earthquake it-self, although this may be a good proxy for the study. This is an approximation because, as Fernandes, Milesi e Farias(2012) shows, what explains the emigration of Haitians is a set of vulnerabilities: political instability, social and economic issues and frequent
environ-15 Calculated using GDP data at current prices and Population of 2010 (IBGE,2010).
16 General Registry of Employed and Unemployed People, a monthly database provided by the Brazilian
mental disasters. Besides, Haitian immigrants had been distributed in a very specific way over the Brazilian territory, as shown in the previous section, a fact that was certainly driven by several issues, including economic (regions with greater economic performance or greater labor supply) and social (regions previously inhabited by Haitian communities or immigrants from other countries).
Actually, the former President of CNIg gave an interview17 in 2012 where he
de-clared that many industries, including construction and meat-processing were actually recruiting Haitians in the other regions of Brazil to bring to the south. The demand for low-skilled and high turnover labor in this branch of industry was high at that moment and there was not enough supply from natives. So there is evidence that Haitians started heading massively to the south (mainly to Santa Catarina state) accepting this kind of job even when it was below their qualifications, since they came to Brazil fleeing from a dramatic situation in their country.
The literature on natural experiments of this nature is not scarce. US-based lite-rature on the subject portrays at least two other very similar cases: the Mariel Boatlift, whose effect on the Miami labor market was first studied by Card(1990), and the case of
Hurricane Mitch, which was responsible for mass outflows of citizens from Central
Ame-rican countries to the southern-most AmeAme-rican states, which was the subject of a study byKugler e Yuksel(2008). There is also extensive literature worldwide on this kind of na-tural experiment (see, for example, Hunt(1992), Carrington e DeLima(1996),Friedberg (2001) and Angrist e Kugler (2003).
A meta-analysis on this issue is presented byFriedberg e Hunt (1995). Based on a theory that migrants may affect the price of labor in both a closed and an open economy (in the last case, this effect might be ambiguous) because they are perfect substitutes of the local labor force, there is a common hypothesis that mass migration might affect negatively both employment and wages of natives. However, the meta-analysis claims that the empirical evidence suggests that this effect is not present. That is also the case in the seminal work of Card(1990), that shows that the Mariel Boatlift did not have an impact in employment or wages of both Cubans and non-Cubans in the Miami labor market, a fact that might be explained by growth in low skilled labor-intensive industries in the
region at that time and by out-migration, which is the fact that people that would have migrated to Miami did not because of the presence of international migrants. This was precisely the main object of Kugler e Yuksel(2008), which detected a displacement effect on earlier-generation Latin-American migrants after controlling for out-migration.
The common identification strategy in the literature for this kind of study is a comparative interrupted time series (CITS) design frequently associated with an instru-mental variable. In this case, we propose a mixed strategy involving CITS and propensity score matching design where the comparative group is created by the propensity score estimation (SHADISH; COOK; CAMPBELL,2002). The idea is to create a control group which was just similar do the treatment group (cities with Haitian migration) before the migration waves, based on a set of covariates. We used as covariates a set of variables related to the socioeconomic and demographic context of the cities and also labor market outcomes and migration statistics. They are described in the next section.
The propensity score for each city was estimated with the fitted values from the logistic generalized least squares regression where the dependent variable (𝑑ℎ𝑎𝑖𝑡𝑖𝑎𝑛) was a dummy which is one for the cities that had Haitian immigration and 0 if not. The expression is shown below:
𝑑ℎ𝑎𝑖𝑡𝑖𝑎𝑛𝑖 = 𝛽0+ 𝛽1𝑋𝑖+ 𝑢𝑖 (1)
where 𝑋𝑖 is a matrix of covariates and 𝑢𝑖 is an error term with logistic distribution. All
variables here are index by i (municipality).
Each treatment city was paired with one in the non-treatment pool of cities using the nearest-neighbor matching technique (RUBIN, 1973). The idea is to match each tre-atment city to another one without Haitians on its formal labor market between 2010 and 2014 in terms of the closest propensity score, so that we performed a one-to-one matching18. The control group of the present analysis is composed by the cities without the presence of Haitians that matched the characteristics of those in the treatment group through the propensity score. If the groups are correctly balanced before the migration waves, and show common trends in the dependent variables, then we expect that any change in the treatment group compared to the control group after the waves started might be attributed to the presence of Haitians in the labor market. Based on the
pirical evidence, we expect that after controlling the bias generated by a simple pooled ordinary least squares (POLS) estimation we do not find a significant effect of the Haitian migration on labor market outcomes of natives.
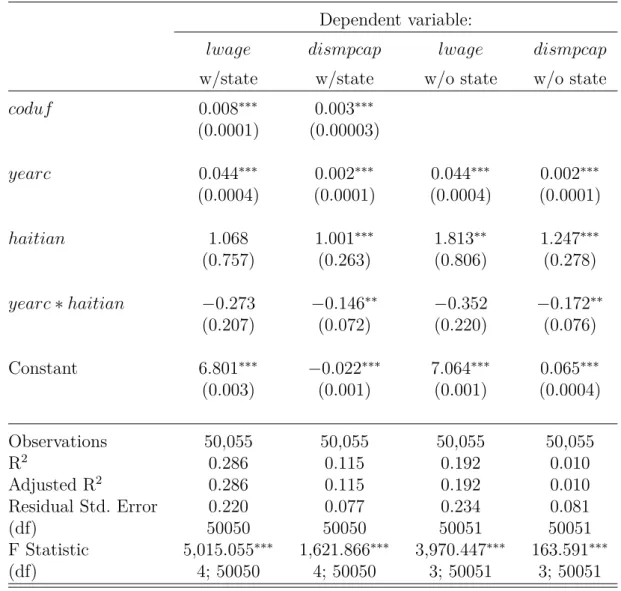
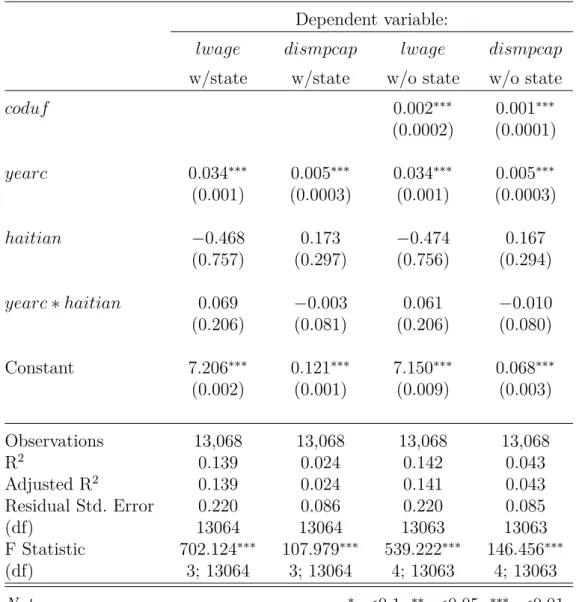
So we propose a mixed strategy (STUART et al., 2014) where we first create a comparison group with the propensity score matching and then we run the regression that captures the effect of the Haitian immigration on the chosen dependent variable as a difference-in-differences regression:
𝑑𝑒𝑝𝑣𝑎𝑟𝑖𝑎𝑏𝑙𝑒𝑖𝑡 = 𝛽0+ 𝛽1ℎ𝑎𝑖𝑡𝑖𝑎𝑛𝑖𝑡+ 𝛽2𝑦𝑒𝑎𝑟𝑐𝑖𝑡+ 𝛽3ℎ𝑎𝑖𝑡𝑖𝑎𝑛𝑖𝑡* 𝑦𝑒𝑎𝑟𝑐𝑖𝑡+ 𝜖𝑖𝑡 (2)
where the dependent variables used were 𝑙𝑤𝑎𝑔𝑒 (logarithm of mean real wage) and
𝑑𝑖𝑠𝑚𝑝𝑐𝑎𝑝 (number of dismissals in the formal labor market as a proportion of the city
population), ℎ𝑎𝑖𝑡𝑖𝑎𝑛 is the share of Haitians in the formal labor market, 𝑦𝑒𝑎𝑟𝑐 is the centered year variable, where 2010 is set to 0, and 𝛽3 is the parameter of interest. 𝜖𝑖𝑡 is a
normally distributed error term. All variables are indexed by i (municipality) and t (year). A final remark is that unlike the cases reported inCard(1990) andKugler e Yuksel (2008), Haitian migration to Brazil had a smaller volume (around 40,000 and 70,000 as shown above) and occurred in many waves since 2010. In the case of the Mariel Boatlift, for example, over 120,000 Cubans were reported arriving in Florida in just one year. So we might expect that the effect, if it does exist, is probably very subtle.
We used R software for the analysis conducted here. We used MatchIt package (HO et al., 2011) for the matching analysis and the routines created by Peter Steiner for the summer course on quasi-experimental design and analysis of the Northwestern University for graphic analysis. We used the stargazer package (HLAVAK, 2018) to present the results in LaTeX language.
4
About the Data
In Brazil, except for decennial censuses, there is no individual data on foreign-born people in periodic surveys. The reason is that sample surveys could not take account of foreigners in a statistically representative way, since foreign-born population is just about 0.3%of the population (IBGE, 2010) and is scattered around the country. This is a huge obstacle for this kind of study in Brazil, and we recognize that it is a relevant constraint. In that case, we use administrative registries as our main source of data for the treatment
variable. We restrict our analysis to the impacts on formal labor market effects, since we can take account only of formally working Haitians. For the same reason, we are not able to measure the effect of the presence of Haitians in a city on individual records of Brazilian citizens, since the sample surveys take account only of bigger cities (metropolitan regions). As described in the context section, Haitians are concentrated in the south region and not only on the capital cities.
These restrictions implied in the usage of administrative registries instead of sam-ple surveys and in the election of municipalities as the unit of analysis, and not individuals. Our main source of data is the Annual Social Information Record - RAIS - provided by the Brazilian Ministry of Labor (MTE, 2018). It contains all the individual records of formal workers in Brazil.
For this study, we will consider the yearly share of Haitian immigrants in the formal labor market (ℎ𝑎𝑖𝑡𝑖𝑎𝑛) until 2014. This year’s choice is due to two reasons: first, since 2015, the Brazilian economy has entered into a recession, with rapidly increasing levels of unemployment and falling economic growth associated to political instability, which could generate a confounding effect in the analysis. Secondly, as a direct effect of the first, because there is a concrete possibility, though not properly measured yet, that some of the Haitians who migrated previously may have returned to their country or migrated to other countries due to the lack of opportunities in Brazil.
There is an important detail to highlight in this context. RAIS database has adop-ted a specific code to register Haitian nationality only from 2011 onwards. This means that in previous years Haitians were identified by a generic code, in this case, "Other Latin Americans". Therefore, we will assume that the effects, if any, will be felt from 2011 onwards, and not from 2010, which will not cause great damage to the analysis, since the phenomenon studied "expanded at the end of 2010 and in the first half of 2011, when the message of the possibility of obtaining residence in Brazil was probably ’transmit-ted’ through the family and social networks of the migrants themselves"(FERNANDES; MILESI; FARIAS, 2012).
We wanted to explore the effects of Haitian migration on common labor market outcomes for natives such as wage and employment status. For this study, we obtained yearly mean wages from RAIS database and deflated it using the series of the Brazilian official inflation index, the IPCA (Extended National Consumer Price Index) (IBGE,
2018), using 2014 as baseline year. Then we used the logarithm of this variable in the estimates (𝑙𝑤𝑎𝑔𝑒). Due to data constraints explained above, instead of employment status or unemployment rate (since we are dealing with cities), we obtained data from RAIS as a proxy: we used the yearly native dismissals in the formal labor market as a proportion of the city population (𝑑𝑖𝑠𝑚𝑝𝑐𝑎𝑝).
For the propensity score estimation, we used a set of covariates, obtained from IBGE. Since the matching process was executed for the pre-test period (before 2010), the 2010’s IBGE Census was the main source (IBGE,2010). Here is the list of covariates used with a brief justification for each, except for general parameters such as population and per-capita GDP. When the source is not reported, data comes from 2010’s census.
1. 𝑙𝑝𝑜𝑝: city population. We used its logarithm to control its right-skewed distribution. 2. 𝑙𝑔𝑑𝑝𝑝𝑐: per-capita GDP from IBGE’s municipal GDP database (IBGE, 2017). We
used the logarithm of 2010’s observation to avoid problems with outliers.
3. 𝑔𝑒𝑛𝑑𝑒𝑟: percentage of women in the city labor force. In individual data studies, we usually get gender as part of the worker characteristics vector, so we tried to replicate this for the city patterns.
4. 𝑟𝑎𝑐𝑒: percentage of black people in the city labor force. The justification is similar than that for gender.
5. 𝑎𝑔𝑒: percentage of working-age (15 to 64 years) in the city population. The justifi-cation is similar than that for gender and race.
6. 𝑒𝑑𝑢𝑐: percentage of tertiary-educated (bachelor or above) in the labor force. The justification is similar than that for gender, race and age. It is also a good proxy for high-skilled labor force in the city.
7. 𝑢𝑛𝑒𝑚𝑝: city unemployment rate. We wanted to have similarities in the labor market outcomes as a whole, so we used the unemployment rate as a proxy.
8. 𝑚𝑖𝑔𝑟𝑎𝑛𝑡: percentage of international migrants in the city population. This is a very important variable because of the tendency of migrants to go where previous migrants have settled.
9. 𝑔𝑟𝑜𝑤𝑡ℎ: 2006-2010 city real GDP growth from IBGE’s municipal GDP database (IBGE,2017). We deflated each year’s nominal GDP with the IPCA. The variable is important for the matching cities because it captures similarities in recent economic growth pattern of the city, something that is related to the labor market and the living standards.
10. 𝑎𝑔𝑟𝑜𝑝: 2006-2010 mean percentage of the primary sector (farming) in the city’s economic activity (yearly gross added value) obtained from IBGE’s municipal GDP database (IBGE,2017). We used this variable because of the evidence that Haitians were hired on the meat-processing sector, so we wanted to pair cities that had a similar pattern. There was no data available on the percentage of added value from the specific meat sector, so we used the farming sector (also includes agriculture) as a proxy.
We excluded 6 cities19 from the database because they were officially created in
some moment between 2006 and 2014, so there are no data available for the whole series. We also excluded the city of Guamaré (RN) because its GDP data had negative values in the database and the city of São José de Princesa (PB) due to the unavailability of dismissals data from RAIS. This will not be of great damage because these cities have no register of haitian inhabitants.
The next section presents the results of each step of the present work using the data here presented.
5
Findings
First of all, we start by observing the characteristics of the groups created by the propensity score matching. The next two tables present descriptive statistics for covariates, separated by the indicator of the presence of Haitians in the formal labor market. After deleting 8 cities, as explained above, we have a set of 5562 observations, where 726 of them had Haitians working formally after 2010 and 4836 had not. As the two tables show, descriptive statistics of the two groups vary quite a lot, which is probably an aspect of the self-selection bias embedded in the cities chosen by Haitian migrants.
19 Mojuí dos Campos (PA), Balneário Rincão (SC), Pescaria Brava (SC), Pinto Bandeira (RS) and
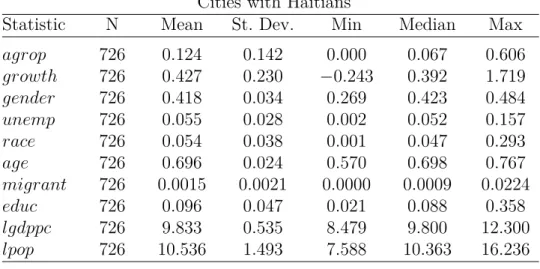
Table 1: Summary Statistics for Covariates - cities with and without Haitians on the formal labor market (before matching)
Cities with Haitians
Statistic N Mean St. Dev. Min Median Max
𝑎𝑔𝑟𝑜𝑝 726 0.124 0.142 0.000 0.067 0.606 𝑔𝑟𝑜𝑤𝑡ℎ 726 0.427 0.230 −0.243 0.392 1.719 𝑔𝑒𝑛𝑑𝑒𝑟 726 0.418 0.034 0.269 0.423 0.484 𝑢𝑛𝑒𝑚𝑝 726 0.055 0.028 0.002 0.052 0.157 𝑟𝑎𝑐𝑒 726 0.054 0.038 0.001 0.047 0.293 𝑎𝑔𝑒 726 0.696 0.024 0.570 0.698 0.767 𝑚𝑖𝑔𝑟𝑎𝑛𝑡 726 0.0015 0.0021 0.0000 0.0009 0.0224 𝑒𝑑𝑢𝑐 726 0.096 0.047 0.021 0.088 0.358 𝑙𝑔𝑑𝑝𝑝𝑐 726 9.833 0.535 8.479 9.800 12.300 𝑙𝑝𝑜𝑝 726 10.536 1.493 7.588 10.363 16.236
Cities without Haitians
Statistic N Mean St. Dev. Min Median Max
𝑎𝑔𝑟𝑜𝑝 4,836 0.221 0.139 0.000 0.196 0.753 𝑔𝑟𝑜𝑤𝑡ℎ 4,836 0.427 0.417 −0.881 0.386 15.141 𝑔𝑒𝑛𝑑𝑒𝑟 4,836 0.381 0.039 0.195 0.382 0.501 𝑢𝑛𝑒𝑚𝑝 4,836 0.067 0.039 0.000 0.062 0.418 𝑟𝑎𝑐𝑒 4,836 0.073 0.055 0.000 0.061 0.578 𝑎𝑔𝑒 4,836 0.658 0.037 0.459 0.662 0.879 𝑚𝑖𝑔𝑟𝑎𝑛𝑡 4,836 0.0007 0.0058 0.0000 0.0000 0.3772 𝑒𝑑𝑢𝑐 4,836 0.059 0.029 0.003 0.055 0.274 𝑙𝑔𝑑𝑝𝑝𝑐 4,836 9.048 0.670 7.721 9.010 12.652 𝑙𝑝𝑜𝑝 4,836 9.247 0.986 6.691 9.235 14.246
Source: the authors, based on data fromIBGE(2010),IBGE(2017), andIBGE(2018).
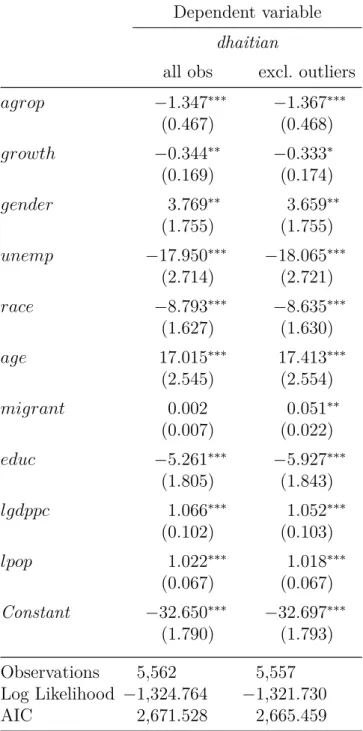
With these observations we ran the regression (1) to obtain propensity scores as its fitted values. The results are shown in the next table. Two variables among the covariates had outlier values (𝑔𝑟𝑜𝑤𝑡ℎ and 𝑚𝑖𝑔𝑟𝑎𝑛𝑡) so we ran the regression with all observations and after dropping the five outliers20. The results shown in the table reveal that without
the outliers, all variables were significant under a 5% level, except for 𝑔𝑟𝑜𝑤𝑡ℎ, which was significant under a 10%level.
20 The cities of Cairu-BA and Alto Horizonte-GO had more then 1, 000%real GDP growth between 2006
and 2010 in accordance with IBGE data. Also, the cities of Sant’Ana do Livramento-RS, Itaí-SP and Chuí-RS had more than 4%of its population composed by international migrants, which is really above the Brazilian average as seen in table 1.
Table 2: Propensity Score Estimation - All observations and without outliers Dependent variable
dhaitian
all obs excl. outliers
𝑎𝑔𝑟𝑜𝑝 −1.347*** −1.367*** (0.467) (0.468) 𝑔𝑟𝑜𝑤𝑡ℎ −0.344** −0.333* (0.169) (0.174) 𝑔𝑒𝑛𝑑𝑒𝑟 3.769** 3.659** (1.755) (1.755) 𝑢𝑛𝑒𝑚𝑝 −17.950*** −18.065*** (2.714) (2.721) 𝑟𝑎𝑐𝑒 −8.793*** −8.635*** (1.627) (1.630) 𝑎𝑔𝑒 17.015*** 17.413*** (2.545) (2.554) 𝑚𝑖𝑔𝑟𝑎𝑛𝑡 0.002 0.051** (0.007) (0.022) 𝑒𝑑𝑢𝑐 −5.261*** −5.927*** (1.805) (1.843) 𝑙𝑔𝑑𝑝𝑝𝑐 1.066*** 1.052*** (0.102) (0.103) 𝑙𝑝𝑜𝑝 1.022*** 1.018*** (0.067) (0.067) Constant −32.650*** −32.697*** (1.790) (1.793) Observations 5,562 5,557 Log Likelihood −1,324.764 −1,321.730 AIC 2,671.528 2,665.459 Note:*𝑝 < 0.1;**𝑝 < 0.05;***𝑝 < 0.01
Source: the authors, based on data fromMTE(2018),IBGE(2010),IBGE(2017), andIBGE(2018).
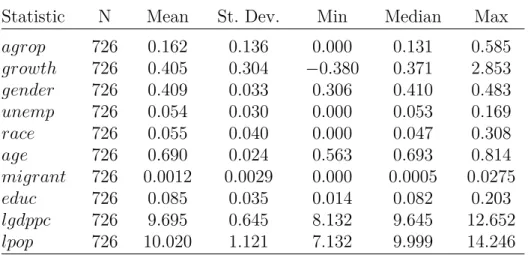
With the propensity scores at hand we performed a nearest neighbor matching technique, resulting in a one-to-one pairing for each treatment city. Each city in the treat-ment group was paired with one city in the treattreat-ment group. As a result, we dropped the majority of the cities without Haitians on the labor market because their characteristics, on average, were very different from the ones that had Haitian migrants working formally. So we ended up with the 726 cities with Haitians and the control group had 726 cities
among the 4836 cities without Haitians. So we end up with 1452 cities for the study. As shown by the next table with the descriptive statistics of covariates in the control group, we see that now the variables have more similar characteristics then in table 1 in basically every variable. This is an evidence that the matching process create a reasonable counter factual for the treatment group.
Table 3: Summary Statistics for Covariates after matching - Control group
Statistic N Mean St. Dev. Min Median Max
𝑎𝑔𝑟𝑜𝑝 726 0.162 0.136 0.000 0.131 0.585 𝑔𝑟𝑜𝑤𝑡ℎ 726 0.405 0.304 −0.380 0.371 2.853 𝑔𝑒𝑛𝑑𝑒𝑟 726 0.409 0.033 0.306 0.410 0.483 𝑢𝑛𝑒𝑚𝑝 726 0.054 0.030 0.000 0.053 0.169 𝑟𝑎𝑐𝑒 726 0.055 0.040 0.000 0.047 0.308 𝑎𝑔𝑒 726 0.690 0.024 0.563 0.693 0.814 𝑚𝑖𝑔𝑟𝑎𝑛𝑡 726 0.0012 0.0029 0.000 0.0005 0.0275 𝑒𝑑𝑢𝑐 726 0.085 0.035 0.014 0.082 0.203 𝑙𝑔𝑑𝑝𝑝𝑐 726 9.695 0.645 8.132 9.645 12.652 𝑙𝑝𝑜𝑝 726 10.020 1.121 7.132 9.999 14.246
Source: the authors, based on data fromIBGE(2010),IBGE(2017), andIBGE(2018).
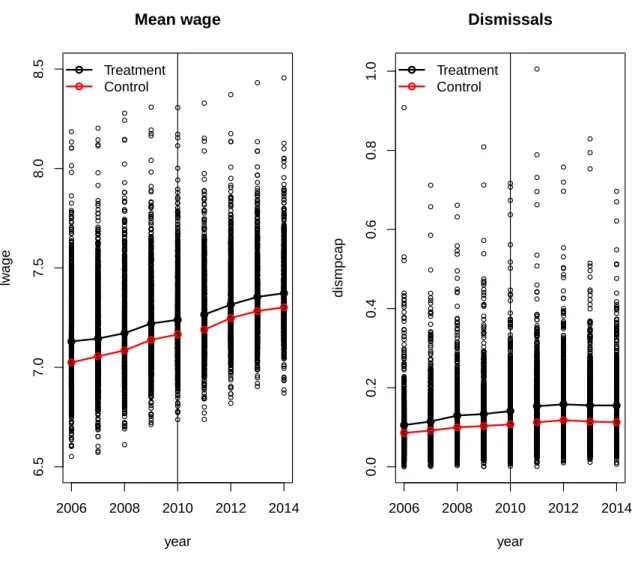
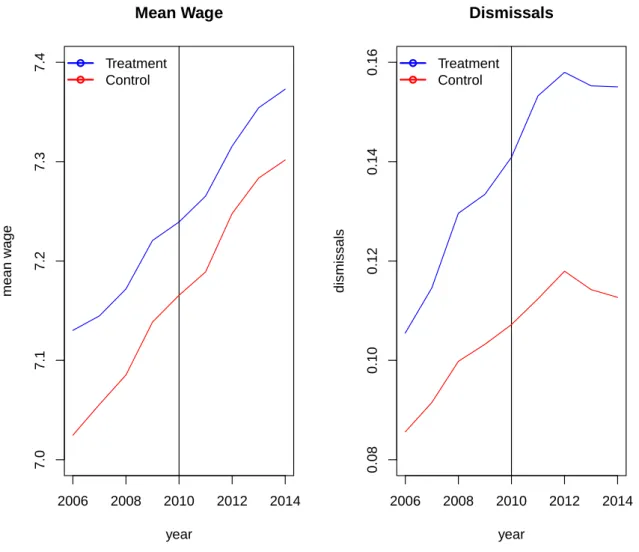
Now that we have the comparison group, we can analyze the panel data ranging from 2006 to 2010 for these 1452 cities. Some graphic analysis can show some evidence of the common trends assumption of time series design. We see that the path of means of both dependent variables show similar trends through time, except for the fact that dismissals (as a proportion of the population) seemed to be growing at a faster rate in treatment cities than control cities before the arrival of Haitians.