Otimização da extração de pectina do maracujá (Passiflora edulis flavicarpa)
usando o método de superfície de resposta
Optimization of pectin extraction from passion fruit (Passiflora edulis flavicarpa)
using the response surface method
DOI:10.34117/bjdv6n5-132
Recebimento dos originais: 19/04/2020 Aceitação para publicação: 08/05/2020
Cariny Maria Polesca de Freitas
Mestre em Engenharia Química pela Universidade Federal de Viçosa
Endereço: Universidade Federal de Viçosa, Departamento de Química, Av. PH Rolfs, 36570-900, Viçosa/MG, Brasil.
E-mail: [email protected]
Angélica Ribeiro da Costa
Professora da Universidade Federal de Viçosa
Endereço: Universidade Federal de Viçosa, Departamento de Química, Av. PH Rolfs, 36570-900, Viçosa/MG, Brasil.
E-mail: [email protected]
Fábio de Ávila Rodrigues
Professor da Universidade Federal de Viçosa
Endereço: Universidade Federal de Viçosa, Departamento de Química, Av. PH Rolfs, 36570-900, Viçosa/MG, Brasil.
E-mail: [email protected]
Maurino Magno de Jesus Júnior
Mestre em Engenharia Química pela Universidade Federal de Viçosa
Endereço: Universidade Federal de Viçosa, Departamento de Química, Av. PH Rolfs, 36570-900, Viçosa/MG, Brasil.
E-mail: [email protected]
Manoela Maciel dos Santos Dias
Professora do Centro Universitário de Viçosa
Endereço: Centro Universitário de Viçosa, Departamento de Engenharia Química, Av. Maria de Paula Santana, 36576-340, Viçosa/MG, Brasil.
E-mail: [email protected]
Rita de Cássia Superbi de Sousa
Professora da Universidade Federal de Viçosa
Endereço: Universidade Federal de Viçosa, Departamento de Química, Av. PH Rolfs, 36570-900, Viçosa/MG, Brasil.
RESUMO
A casca de maracujá, um subproduto gerado durante o processamento de frutas na indústria, foi usada como matéria-prima para a extração de pectina. Este trabalho teve como objetivo otimizar as variáveis que influenciam a extração. Para tanto, foram realizadas quatro etapas: i) produção da farinha da casca de maracujá; ii) estudo da influência das variáveis (temperatura, tempo e concentração de ácido cítrico) na extração da pectina da farinha com o design 23; iii) otimização de variáveis significativas para obtenção da pectina com bom rendimento e alto grau de esterificação usando o delineamento compósito central rotacional; e iv) extração da pectina da casca in natura usando os níveis estabelecidos pela condição otimizada. Os resultados indicaram que a pectina foi obtida a partir de farinha e casca in natura com alto grau de esterificação e rendimento médio de 13,18% e 13,44%, em condições operacionais de 52,5 min; 80 °C e 0,0002 mol.L-1 de ácido cítrico.
Palavras-chave: Ácido galacturônico, Farinha, Rendimento, Subproduto.
ABSTRACT
Passion fruit peel, a byproduct generated during fruit processing in the industry, was used as a raw material for pectin extraction. This work aimed to optimize the variables that influence the extraction. For this purpose, four steps were performed: i) production of passion fruit peel flour; ii) study of the influence of the variables (temperature, time and concentration of citric acid) on the extraction of flour pectin with the design 23; iii) optimization of significant variables to obtain pectin with good yield and high degree of esterification using central composite rotational design; and iv) pectin extraction from fresh peel using the levels established by the optimized condition. The results indicated that pectin was obtained from flour and fresh peel with a high esterificationdegree and an average yield of 13.18% and 13.44%, under operating conditions of 52.5 min; 80 °C and 0.0002 mol.L-1 of citric acid.
Keywords: Galacturonic acid, Flour, Yield, Byproduct.
1 INTRODUCTION
Passion fruit peel is a byproduct generated in large quantities during fruit processing to produce pulp and juice. In 2018, 602,651 tons of passion fruit were harvested in Brazil (IBGE, 2018), which generated approximately 319,405 tons of byproduct, since the peel represents about 53% of the total fruit mass (Freitas et al., 2019; Oliveira et al., 2002).
Most of the time, the by-products are discarded without any use. However, it is worth noting that the passion fruit peel has potential for use, as it has significant amounts of fiber, especially pectin (Kulkarni and Vijayanand, 2010; Pinheiro et al., 2008).
Pectin is a galacturonic acid polysaccharide, widely used as a stabilizing and gelling agent in the food industry due to its technological and functional properties. It has applications in other industrial areas, such as the pharmaceutical and biotechnology industry such as cosmetics manufacturing, wound healing and colon cancer prevention (Filho et al., 2020; Liew et al., 2019; Kanse et al., 2017; Saberian et al., 2017; Oliveira, 2015).
The use of pectin is associated with the degree of esterification (DE), which corresponds to the ratio of esterified groups of galacturonic acid to the total group of galacturonic acids. When this ratio is higher than 50%, pectin is nominated ashigh DE,and when less than 50%, it is referred to as
low DE. The main difference between them is that high DE pectins are used in products with high sugar concentration; while low DE pectins need calcium ion to produce the gel. Regarding the time required for gelation, as DE increases, time decreases (Güzel and Akpinar, 2019; Tuan et al., 2019; Kliemann, 2010; Willats et al., 2006; Turquois et al., 1999).
Usually, pectin extraction is performed by conventional methods and occurs under the influence of various factors such as temperature and time. On an industrial scale, acid extraction is performed, and generally strong acid solutions such as nitric, phosphoric, sulfuric, and hydrochloric acid are used. However, these acids can be a source of environmental pollution. Therefore, they are being replaced by organic acids as well as citric acid (Najafabadi et al., 2020; Canteri et al., 2012; Vriesmann et al., 2012; Pinheiro et al., 2008).
According to the need for the better valorization of by-products and the importance of pectins in various industrial segments, the present study aimed to determine an optimal condition for pectin extraction from passion fruit peels taking into account the effects of the three variables, namely citric acid concentration, temperature and extraction time, using response surface methodology.
2 MATERIAL AND METHODS
2.1 FEEDSTOCK
Passion fruits were purchased at a local market in Viçosa-MG, selecting healthy fruits with different degrees of ripeness to mimic the real scenario currently used in the industry. Before the extraction process, the fruits were washed and sanitized with chlorinated water (200 ppm for 15 minutes) and then cut in half and pulped (Bonine Remover 0.25 df Itamel, Brazil).
2.2 CHEMICALS
All chemicals used were analytical reagent grade. Citric acid was purchased from Sigma Aldrich (Germany), while ethanol was obtained from Neon (Brazil), purity≥99.5. Commercial pectin from citrus peel was acquired from Sigma Aldrich (USA). All water used was purified using a Milli-Q referencesystem (Millipore, Bedford, MA, USA).
2.3 FLOUR PRODUCTION
Passion fruit peels were oven-dried (400/4ND, Ethiktechnology, Brazil) with air circulation at 55 °C and weighed on analytical balance (FA 2204C, accuracy 0.0001 g) untilconstant mass. Subsequently, dried peels were grounded into powder using an electric blender (SM 224, Motores Electric, Brazil) and sieved to obtain a particle size of less than 42 mesh. Finally, the
material was placed in desiccator to prevent moisture absorption until its physical-chemical characterization.
2.4 FLOUR CHARACTERIZATION
Obtained flour was characterized in terms of its moisture, ashes, proteins, lipids, and carbohydrates content (AOAC, 1990). Briefly, moisture was determined by oven-drying method at 105 °C ± 2 °C until constant mass, and ashes by calcination (2 hours at 200 °C± 5 °C) and muffle incineration (4 hours at 550 °C± 5 °C). Proteins were quantified by the Kjeldahl method, and lipidswere measured with Soxhlet extraction. The difference calculated total carbohydrates. All analyses were done in duplicate.
2.5 EXTRACTION OF PECTIN FROM PASSION FRUIT PEEL FLOUR
The extraction conditions were selected based on (Oliveira, 2015; Liew et al., 2014; Kulkarni and Vijayanand, 2010).The effects of citric acid concentration, time, and temperature on the pectin extraction from passion fruit peel flour were studied. The aqueous citric acid solution was prepared with Milli-Q water at the desired concentration for each experiment. Extraction was performed in a closed container in a glycerin bath under constant agitation using a magnetic stirrer.
Pectin was extracted following the methodology of (Casas-Orozco et al., 2015) with some modifications. Initially, the acidified solution was heated to the desired temperature. At this time, theflour was added to the vessel under magnetic stirring for a specific time while maintaining the 1:30 w/v ratio. After extraction, the solution was vacuum filtered and cooled to 4 °C. The pectin was precipitated by adding absolute ethyl alcohol (purity 99.5%) at a ratio of 2:1 for 1 hour. The precipitated pectin was vacuum filtered and then washed twice with absolute ethyl alcohol to remove soluble impurities such as salts and sugars. The pectin was dried at 45 °C in an oven until it reached constant mass. Extraction yield (R) was calculated by Equation 1:
(%) p 100 f m R m (1)
mp : extracted pectin mass (g), mf : flour mass used for extraction (g).
2.6 DEGREE OF ESTERIFICATION
The degree of esterification (DE) of pectin was determined by titration (Bocheck et al., 2001). Initially, the dried pectin sample (0.2 g) was solubilized in 1 mL of absolute ethyl alcohol (purity 95%). Then 20 mL of distilled water at 40 °C was added, keeping the solution under stirring
for 2 hours. The solution was mixed with three drops of phenolphthalein and titrated with NaOH solution 0.1 mol.L-1 until pink color appeared, and the volume spentwas recorded as V1. Then 10 mL of NaOH 0.1 mol.L-1was added, and the sample was stirred on a magnetic stirrer
for 2 hours. Subsequently, the solution was neutralized by the addition of 10 mL of HCl 0.1 mol.L -1and titrated with NaOH 0.1 mol.L-1. The result was recorded as V
2. The DE was calculated using
Equation 2: 2 1 2 (%) 100 ( ) V DE V V (2)
V1 : volume of NaOH used in initial titration (mL), V2 : volume usedin final titration (mL).
2.7 EXPERIMENTAL DESIGN AND STATISTICAL PLANNING
The statistical planning for pectin extraction from passion fruit flour was divided into two stages. In the first stage, a 23design with three repetitions at the central point was applied. Mass yield of extracted and degree of esterification were the response or dependent variables. The independent variables were: extraction time (min), temperature (ºC), and citric acid concentration (mol.L-1). The values of the coded and decoded factors are presented in Table 1.
Table 1– Factorial design matrix 23, variables and levels coded and decoded
Variable Level
-1 0 +1
Time (min) 30 75 120
Temperature (°C) 60 75 90
Acid concentration (mol.L-1) 0.0052 0.0234 0.0416
The significance of each effect was evaluated with the levels used. From this, the second step was performed: process optimization through the response surface methodology. For this, the planning was conducted according to the central composite rotational design (CCRD). At this stage, the independent variables were established from the influence they exert on the process, as studied in the preliminary planning. The CCRD consisted of seventeen experiments, including eight factorial experiments (+1, -1 level), six axial experiments (+ α, −α), and three repetitions at the center point (0) to estimate the pure error. The coded and decoded values of the factors are presented in Table 2.The response surface methodology was used to determine the optimum extraction conditions in terms of yield and esterification degree of the extracted pectins.
Table 2– Matrix of the central composite design, variables, and coded and decoded levels
Variable Level
-α -1 0 +1 +α
Time (min) 14.66 30 52.5 75 90.34
Temperature (°C) 63.18 70 80 90 96.82
Acid concentration (mol.L -1)
0.0002
0.0052 0.0126 0.02 0.03
The regression coefficients model for linear, quadratic terms and interactions was calculated using multiple linear regressions and validated by analyses of variance (ANOVA), significance was defined at p<0.05. After the evaluation, the regression coefficients obtained in the second stage were used to generate the response surface graphs.
2.8 EXTRACTION OF PECTIN FROM THE FRESH PEEL
From the levels established by the optimized condition, experiments were performed in triplicate to extract the pectin from the freshpeel. The objective of this step was to evaluate whether flour production is necessary for extraction.
2.9 FOURIER TRANSFORM INFRARED (FT-IR) SPECTROSCOPY
Samples of commercial pectins and extracted from the flour of passion fruit peel and fresh peel were analyzed in order to identify and characterize the functional groups present on the surface of the material. For this, the infrared analysis was used on a Varian FT-IR 660 with the Pike GladiATR accessory (USA), from 450 cm-1 to 4000 cm-1.
3 RESULTS AND DISCUSSION
3.1 PHYSICOCHEMICAL COMPOSITION OF PASSION FRUIT PEEL FLOUR
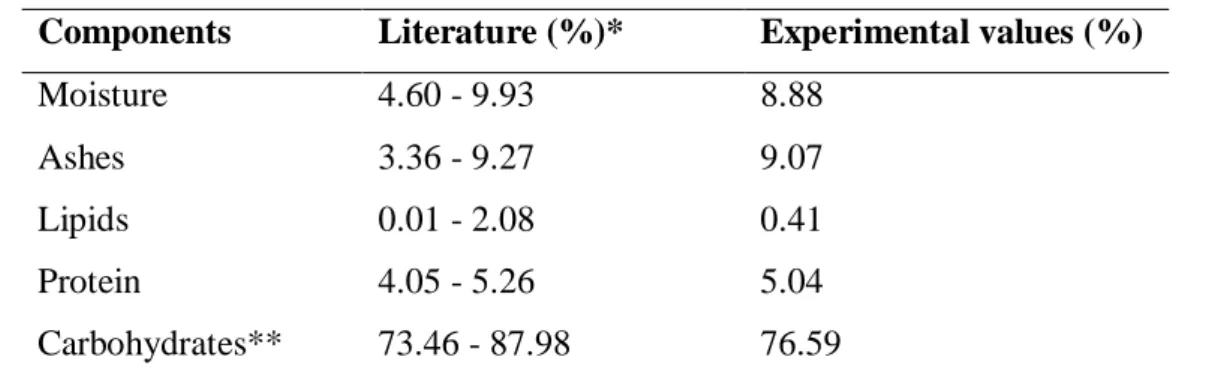
Flour characterization data are similar to those reported in the literature (Table 3).Variations in the results can be explained by the fact that it is organic matter, in which factors such as degree of ripeness, harvest time and different soil types directly affect the fruit characteristics.
Table 3–Physicochemicalcompositionflour
Components Literature (%)* Experimental values (%)
Moisture 4.60 - 9.93 8.88
Ashes 3.36 - 9.27 9.07
Lipids 0.01 - 2.08 0.41
Protein 4.05 - 5.26 5.04
Carbohydrates** 73.46 - 87.98 76.59
* Quantity reported by the authors: (Kliemann, 2010; Oliveira et al., 2015; Pinheiro et al., 2008) ** Amount determined the by difference.
3.2 PECTIN EXTRACTION
Some steps of the process are presented in Figure 1. Figure 1A depicts the pectin during the precipitation step, it is possible to observe the yellow coloration of the solution, which is due to the presence of carotenoids.The wet pectin obtained can be seen in Figure 1B and the dry pectin in Figure 1C.
Figure 1 – Images of (A) pectin precipitation step; (B) extracted pectin (wet); (C) extracted pectin (after drying).
A B C
3.3 STATISTICAL PLANNING
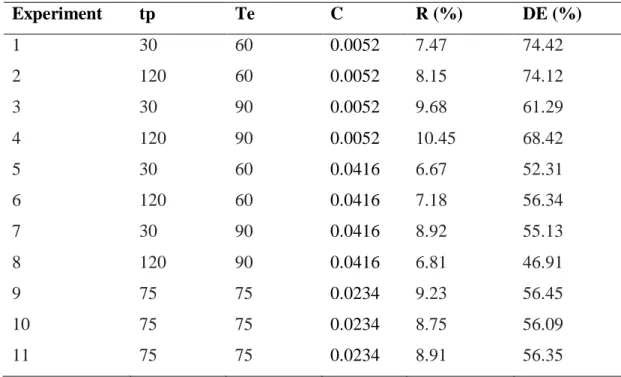
The results of yield and esterification degree obtained by preliminary statistical planning, using the factorial design 23, are presented in Table 4.
Table 4 – Variables and decoded levels for design 23 and the responses obtained for extraction yield (R) and degree of esterification of pectin (DE)
Experiment tp Te C R (%) DE (%) 1 30 60 0.0052 7.47 74.42 2 120 60 0.0052 8.15 74.12 3 30 90 0.0052 9.68 61.29 4 120 90 0.0052 10.45 68.42 5 30 60 0.0416 6.67 52.31 6 120 60 0.0416 7.18 56.34 7 30 90 0.0416 8.92 55.13 8 120 90 0.0416 6.81 46.91 9 75 75 0.0234 9.23 56.45 10 75 75 0.0234 8.75 56.09 11 75 75 0.0234 8.91 56.35
* tp = time; Te = temperature; C = acid concentration.
The effect of the variables was tested by the test t Student (p <0.05). The coefficients are presented in Table 5.
Table 5 – Coefficients of the independent variables, value t, and significance of the factors for the variables response yield and degree of esterification
Factor R DE Effect t p Effect t p Mean 8.168* 94.52 0.0001 61.117* 949.086 0.000001 Curvature 1.596* 4.823 0.0404 -9.634* -39.068 0.0006 tp (min) -0.034 -0.199 0.8607 0.6611* 5.133 0.035920 Te (°C) 1.600* 9.262 0.0114 -6.357* -49.363 0.000410 C (mol.L-1) -1.544* -8.936 0.0123 -16.89* -131.141 0.000058 tpxTe -0.624 -3.613 0.0688 -1.203* -9.345 0.011258 tpxC -0.764* -4.423 0.0475 -2.753* -21.378 0.002181 TexC -0.662 -3.830 0.0619 3.0555* 23.725 0.001772 tpxTexC -0.682 -3.945 0.0586 -4.919* -38.193 0.000685
* Significant effects; ** Significance p <0.05.
As an initial test, the effects for planning 23 (Table 5) show a nonlinear relationship between the factors used and the response variables, since the curvature was significant at a significance level of 5%.
When comparing the significant effects obtained statistically in order to obtain higher yield and esterification degree, it is observed that the independent variables (Te and C) and the interaction time x acid concentration (tpxC) are significant (p < 0.05) for both dependent variables (DE and R), while the interactions of time and tpxTe, TexC and tpxTexC are significant only for DE (p < 0.05).
From the analyzes of the effects, it is possible to observe that, to obtain a higher yield of pectin extraction, it is necessary to use higher temperatures, that improve the rate at which the solute dissolves in the solvent (consistent with what was reported by (Oliveira, 2015; Kulkarni and Vijayanand, 2010)) and lower concentration of citric acid, directly related to pH, which is one of the most critical parameters in the extraction step, as shown by (Kanse et al., 2017).However, to obtain a higher degree of esterification, lower temperatures should be used at very high temperatures may cause degradation of the pectin structure (suitable for the experimental results of (Kulkarni and Vijayanand, 2010)).It is then noted that temperature has an opposite effect on the response variables. The individual effect of the acid concentration factor has the same negative effect on the response variables. By screening the effects, it was possible to stipulate the levels that were used for the optimization step.
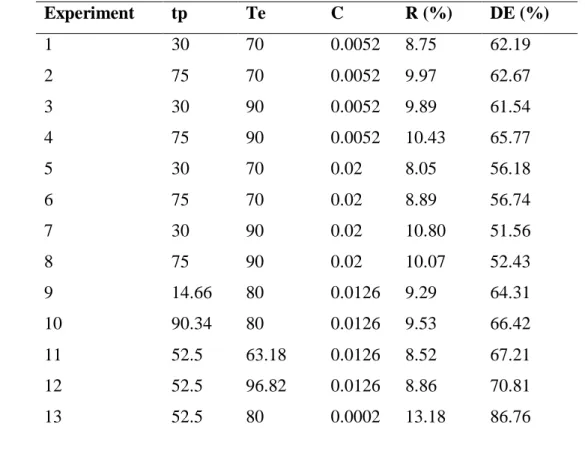
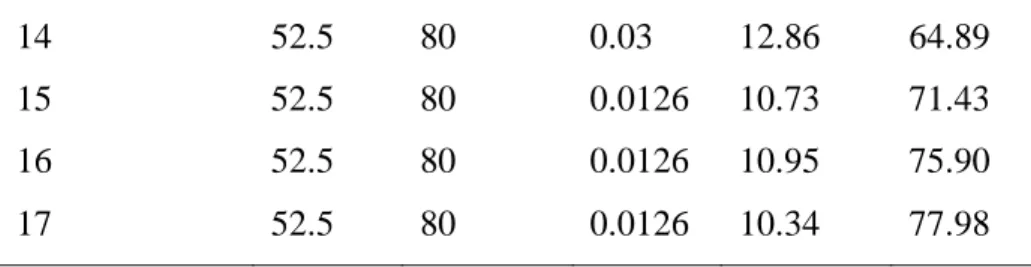
The yield and esterification results obtained by CCRD are presented in Table 6.
Table 6 – Variables and coded levels for the central composite design and the responses obtained for extraction yield and degree of esterification of pectin
Experiment tp Te C R (%) DE (%) 1 30 70 0.0052 8.75 62.19 2 75 70 0.0052 9.97 62.67 3 30 90 0.0052 9.89 61.54 4 75 90 0.0052 10.43 65.77 5 30 70 0.02 8.05 56.18 6 75 70 0.02 8.89 56.74 7 30 90 0.02 10.80 51.56 8 75 90 0.02 10.07 52.43 9 14.66 80 0.0126 9.29 64.31 10 90.34 80 0.0126 9.53 66.42 11 52.5 63.18 0.0126 8.52 67.21 12 52.5 96.82 0.0126 8.86 70.81 13 52.5 80 0.0002 13.18 86.76
14 52.5 80 0.03 12.86 64.89
15 52.5 80 0.0126 10.73 71.43
16 52.5 80 0.0126 10.95 75.90
17 52.5 80 0.0126 10.34 77.98
The results obtained from the Analyzes of Variance (ANOVA) are shown in Table 7. The pure error found was considered low. The t-test was performed with a significance level of 0.05.
Table 7 – ANOVA test for yield and degree of esterification
Variation Source SQ GL QM F p Extractionyield Lackofadjustment 4.222 8.000 0.528 5.412 0.165 Pureerror 0.195 2.000 0.098 - - SS total 31.441 16.000 - - - Degreeofesterification Lackofadjustment 509.146 9.000 56.572 5.042 0.176 Pureerror 22.438 2.000 11.219 - - SS total 1348.713 16.000 - - -
The adjusted models that represent the variation in the dependent variables (yield and esterification degree) as a function of the independent variables studied (time, temperature and acid concentration) are presented by equations 3 and 4. The values of the variables β1, β2, β3, β4, β5, and β6 correspond to time, temperature, acid concentration, time squared, temperature squared, and acid concentration squared, respectively.
^ (%) 46.889 0.125 1 1.357 2 270.097 3 0.0011 4 0.008 5 9230.6 6 R Y (3) ^ (%) 220.22 1.176 1 6.759 2 643.509 3 0.011 4 0.042 5 DE Y (4)
A graphical representation of the quality of the models for yield evaluation and esterification degree can be seen in Figures 2 and 3, respectively.
Figure 2 – (A) Graph of predicted values as a function of observed values and (B) Graph of gross residues as a function of observed values for yield.
A B
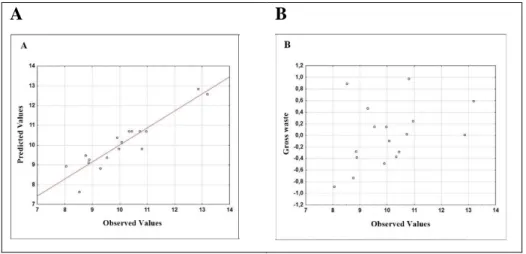
Figure 3 – (A) Graph of predicted values as a function of observed values and (B) Graph of gross residues as a function of observed values for the degree of esterification.
A B
It can be observed that the quadratic model fits the data (Figures 2A and 3A). From the graphs (Figures 2B and 3B), it is noted that the values do not seem to manifest any regular trend, which is ideal for adjusting the data to the model.
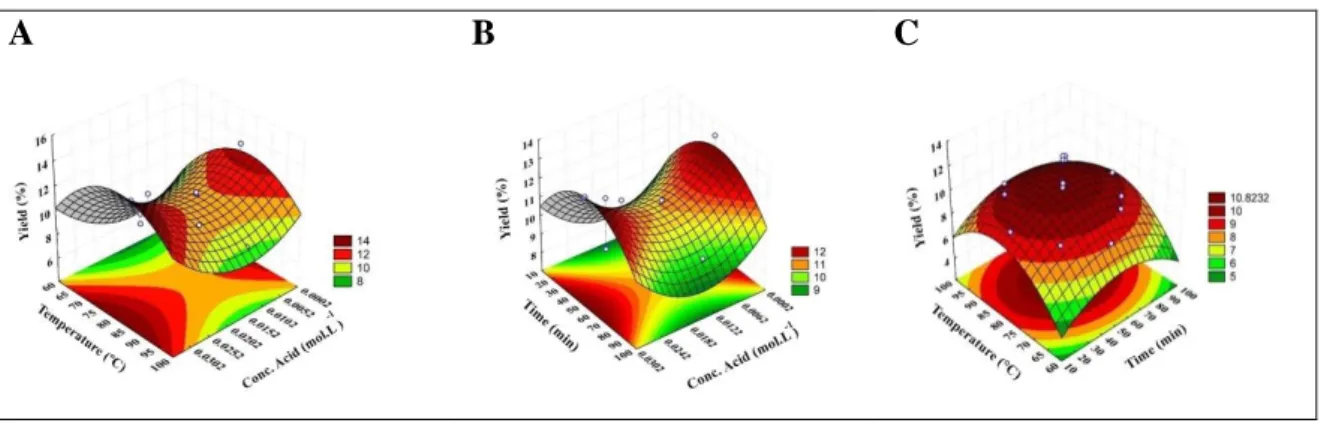
Figure 4 – Response surfaces for the effect of independent variables on yield: (A) Temperature x Concentration of acid; (B) Time x Concentration of acid; (C) Temperature x Time.
A B C
Figure 5 – Response surfaces for the effect of independent variables on the degree of esterification: (A) Temperature x Concentration of acid; (B) Time x Concentration of acid; (C) Temperature x Time.
A B C
From the graphs shown in Figures 4 and 5, it can be noted that:
- Extraction yield increases in values where temperature and time are close to the central point of the studied range, and in low and high acid concentrations. However, considering the economic analyzes, it was decided not to work with higher acid concentrations to minimize costs since the goal is to value an industry by-product. Yield (13.18%) obtained in optimized conditions (80 °C; 52.5 min; 0.0002 mol.L-1) is close to the values found in the literature, for example, 14.8% (Kulkarni and Vijayanand, 2010), 14.6% (Liew et al., 2019) and 10.9% (Oliveira et al., 2015), under different extraction conditions.
- There is an increase in the degree of esterification of pectin when the concentration of citric acid decreases, and the temperature and time are close to the central point of the studied range. In the optimized condition for the extraction yield, the DE also presented a maximum value of 86.76%. This value is higher than literature data, 69.7% (D’Addosio et al., 2005) and 78.59% (Pinheiro et al., 2008), under different extraction conditions.
These observations are in agreement with the literature: The acidic condition favors pectin extraction. Time needs to be sufficient to dissolve the product; thus,a more extended period results in a higher yield. However, when reaching equilibrium, the time should not be prolonged as it may
result in pectin degradation. Higher temperatures increase the rate at which the solute dissolves in the solvent, which results in greater extraction yield. On the other hand, high temperatures reduce the degree of esterification (Kanse et al., 2017; Liew et al., 2014; Kulkarni and Vijayanand, 2010).
These results demonstrate that it was possible to optimize pectin extraction conditions with satisfactory yield and esterification degree, providing potential benefits for industrial extraction, both economically and environmentally.
3.4 FRESH PEEL PECTIN EXTRACTION UNDER OPTIMIZED CONDITIONS
Pectin was also extracted from fresh peels using the harmonic levels established by the optimized condition for pectin extraction from passion fruit peel flour. The water content of the fruit peel was considered for extraction.
The results collected during the experiments showed average yields of 13.44%, that is, better than those found for the extraction of flour and, for the degree of esterification, were calculated 81.25%.
Given the above, it is emphasized that pectin extraction from the fresh peel is efficient, and it is not necessary to produce the flour for later extraction. It is noteworthy that due to the elimination of the drying step for flour production, the process costs are reduced, considering that this is a unit operation of high energy value. Therefore, it is emphasized that the reduction of costs making the process more attractive.
3.5 INFRARED SPECTROSCOPY ANALYZES (FT-IR)
The infrared analyzes performed allowed the chemical observation of the material surface, detailed in Figure 6.
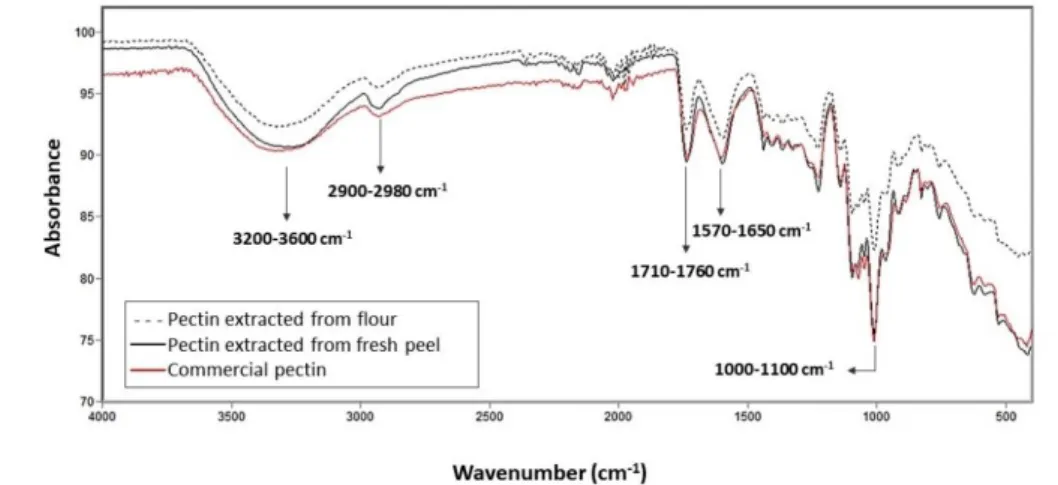
Figure 6 – Infrared spectra (FT-IR) of the pectin samples: commercial, extracted from flour, and extracted from the fresh peel.
Through the infrared spectra of commercial pectin and pectin extracted in the optimized condition, it was possible to observe that the samples have a similar spectrum, indicating correspondence between them.
Regarding the characterization of pectins, it is essential to pay attention to the carbonyl band (1750 cm-1) of the ester-containing the acetyl group (COCH3). The band at 1600 cm-1 corresponds to the carboxylic acid carbonyl. The higher or lesser intensity of this band may be related to the degree of esterification.In order to characterize the other groups existing in the structure of the pectins, the broadband between 3600 cm-1 and 3200 cm-1 stands out, referring to the stretching of the O-H connection. The band between 2960 cm-1 and 2940 cm-1 refers to the C-H stretch of CH3, CH2, and CH. In the case of pectin, the O-H bonds are due to the intermolecular hydrogen bonds of the galacturonic acid chain. The accentuated bands at 1015 cm-1 and 1100 cm-1 are from the stretches of C-OH bonds of secondary alcohols (Sousa et al., 2017; Monfregola et al., 2011; Singthong et al., 2005). It is noteworthy that the values of the bands mentioned and their intensities are very similar to the infrared spectra of pectin found in the literature.
4 CONCLUSION
The process proposed to extract pectin from passion fruit peels using citric acid was validated,the independent variables time, temperature, and acid concentration influence on both the yield and the degree of esterification of the pectin extracted. It was possible to optimize operating conditions to obtain pectin using the response surface methodology; the optimized conditions determined were 52.5 min, 80 °C using0.0002 mol.L-1citric acid.
The extractions made with either peel from fresh passion fruit or the flour resulted from the drying and grinding of the peels resulted in products with a high degree of esterification and an average yield of 13.44% and 13.18%, respectively. It is noteworthy that by performing the process withthe fresh peel, it is possible to eliminate two steps of the process (to dry and grind the material) and, consequently, reduce energy costs.
The use of passion fruit peel for pectin extraction is, therefore, a feasible alternative to reduce the waste disposal problem of such byproducts, which also contribute to attend the high demand for pectin in the national market.
ACKNOWLEDGMENTS
We are thankful to the Brazilian National Council for Scientific and Technological Development (CNPq) for research funding.
REFERENCES
AOAC, 1990. Animal Feed. Off. Methods Anal. 1, 771. https://doi.org/10.1016/b0-12-765490-9/00006-9
BOCHEK, A. M., ZABIVALOVA, N. M., PETROPAVLOVSKII, G. A., 2001. Determination of the esterification degree of polygalacturonic acid. Russ. Journal of Applied Chemistry, v. 74, p. 796-799. https://doi.org/10.1023/A:1012701219447
CANTERI, M. H. G., MORENO, L., WOSIACKI, G., SCHEER, A. P., 2012. Pectin: from raw material to the final product. Polymers, v. 22, p. 149-157. https://doi.org/10.1590/s0104-14282012005000024
CASAS-OROZCO, D., VILLA, A. L., BUSTAMANTE, F., GONZÁLEZ, L. M., 2015. Process development and simulation of pectin extraction from orange peels. Food and Bioproducts Processing, v. 96, p. 86-98. https://doi.org/10.1016/j.fbp.2015.06.006
D’ADDOSIO, R. D., PÁEZ, G., MARÍN, M., MÁRMOL, Z., FERRER, J., 2005. Obtaining and characterization of pectin from Brazilian magazine of agroindustrial technology of La Parra of partita (Passiflora edulis f. Flavicarpa degener). Revista de la Facultad de Agronomía, v. 3, p. 240-249.
FILHO, M. A. C. C., CARDOSO, B. F., FERREIRA, V. R., 2020. Study of the effect of temperature, concentration and pH on ATM pectin viscosity. Brazilian Journal of Development, v. 6, p. 4848-4833. http://doi.org/10.34117/bjdv6n1-347
FREITAS, C. M. P., RODRIGUES, G. S., PINHEIRO, M. F., SILVA, D. J., SOUSA, R. C. S., 2019. Study of the drying kinects of passion fruit (Passiflora edulis flavicarpa) rind. Brazilian Journal of Development, v. 5, p. 20146-20151. https://doi.org/10.34117/bjdv5n10-211
GÜZEL, M., AKPINAR, Ö., 2019. Valorization of fruit by-products: Production characterization of pectins from fruit peels. Food and Bioproducts Processing, v. 115, p. 126-133. https://doi.org/10.1016/j.fbp.2019.03.009
IBGE, 2018. Table 5457 - Area planted or destined for harvest, area harvested, quantity produced, average yield and value of production of temporary and permanent crops. Munic. Agricultural Production. 1–330.
Pectin from Orange Peel’s and Its Applications: Review. International Journal of Innovative
Research in Science, Engineering and Technology, v. 6, p. 19452-19457.
https://doi.org/10.15680/IJIRSET.2017.0609142
KLIEMANN, E., 2010. Pectin extraction from lemon by-product with acidified date juice: Rheological properties and microstructure of pure and mixed pectin gels. Food Science and Technology International, v. 74, p. 796-799. https://doi.org/10.1177/1082013209353093
KULKARNI, S. G., VIJAYANAND, P., 2010. Effect of extraction conditions on the quality characteristics of pectin from passion fruit peel (Passiflora edulis f. flavicarpa L.). Food Science and Technology, v. 43, p. 1026-1031. https://doi.org/10.1016/j.lwt.2009.11.006
LIEW, S. Q., CHIN, N. L., YUSOF, Y. A., 2014. Extraction and Characterization of Pectin from Passion Fruit Peels. Agriculture and Agricultural Science Procedia, v. 2, p. 231-236. https://doi.org/10.1016/j.aaspro.2014.11.033
LIEW, S. Q., TEOH, W. H., YUSOFF, R., NGOH, G. C., 2019. Comparisons of process intensifying methods in the extraction of pectin from pomelo peel. Chemical Engineering and Processing - Process Intensification, v. 143, p. 107586. https://doi.org/10.1016/j.cep.2019.107586 MONFREGOLA, L., BUGATTI, V., AMODEO, P., LUCA, S., VITTORIA, V., 2011. Physical and water sorption properties of chemically modified pectin water with an environmentally friendly process. Biomacromolecules, v. 12, p. 2311-2318. https://doi.org/10.1021/bm200376c
NAJAFABADI, N. S., SAHARI, M. A., BARZEGAR, M., ESFAHANI, Z. H., 2020. Role of extraction conditions in the recovery of some phytochemical compounds of the jujube fruit. Journal of Agricultural Science and Technology, v. 22, p. 439-451.
OLIVEIRA, C. F., GIORDANI, D., GURAK, P. D., CLADERA-OLIVERA, F., MARCZAK, L. D. F., 2015. Extraction of pectin from passion fruit peel using moderate electric field and conventional heating extraction methods. Innovative Food Science and Emerging Technologies, v. 29, p. 201-208. https://doi.org/10.1016/j.ifset.2015.02.005
OLIVEIRA, L. F., NASCIMENTO, M. R. F., BORGES, S. V., RIBEIRO, P. C. N., RUBACK, V. R., 2002. Alternative use of yellow passion fruit peel (Passiflora edulis F. Flavicarpa) to produce sweet syrup. Food Science and Technology, v. 22, p. 259-262. https://doi.org/10.1590/S0101-20612002000300011
PINHEIRO, E. R., SILVA, I. M. D. A., GONZAGA, L. V., AMANTE, E. R., TEÓFILO, R. F., FERREIRA, M. M. C., AMBONI, R. D. M. C., 2008. Optimization of extraction of high-ester pectin from passion fruit peel (Passiflora edulis flavicarpa) with citric acid by using response
surface methodology. Bioresource Technology, v. 99, p. 5561-5566.
https://doi.org/10.1016/j.biortech.2007.10.058
SABERIAN, H., HAMIDI-ESFAHANI, Z., AHMADI GAVLIGHI, H., BARZEGAR, M., 2017. Optimization of pectin extraction from orange juice waste assisted by ohmic heating. Chemical Engineering and Processing. Process Intensification, v. 117, p. 154-161. https://doi.org/10.1016/j.cep.2017.03.025
SINGTHONG, J., NINGSANOND, S., CUI, S. W., GOFF, H. D., 2005. Extraction and physicochemical characterization of Krueo Ma Noy pectin. Food Hydrocolloids, v. 19, p. 793-801. doi:10.1016/j.foodhyd.2004.09.007
SOUSA, A. L. N., RIBEIRO, A. C. B., SANTOS, D. G., RICARDO, N. M. P. S., RIBEIRO, M. E. N. P., CAVALCANTI, E. S. B., CUNHA, A. P., RICARDO, N. M. O. S., 2017. Chemical modification of the caipira melon pectin (Cucumis melo var. Acidulus). Química Nova, v. 40, p. 554-560. http://dx.doi.org/10.21577/0100-4042.20170042
TUAN, N. T., DANG, L. N., HUONG, B. T. C., DANH, L. T., 2019. One-step extraction of essential oils and pectin from pomelo (Citrus grandis) peels. Chemical Engineering and Processing. Process Intensification, v. 142, p. 107550. https://doi.org/10.1016/j.cep.2019.107550
TURQUOIS, T., RINAUDO, M., TARAVEL, F. R., HEYRAUD, A., 1999. Extraction of highly gelling pectic substances from sugar beet pulp and potato pulp: Influence of extrinsic parameters on their gelling properties. Food Hydrocolloids, v. 13, p. 255-262. https://doi.org/10.1016/S0268-005X(99)00007-7
VRIESMANN, L. C., TEÓFILO, R. F., PETKOWICZ, L. O., 2012. Extraction and characterization of pectin from cacao pod husks (Theobroma cacao L.) with citric acid. Food Science and Technology, v. 49, p. 108-116. https://doi.org/10.1016/j.lwt.2012.04.018
WILLATS, W. G. T., KNOX, J. P., MIKKELSEN, J. D., 2006. Pectin: New insights into an old polymer are starting to gel. Trends Food Science and Technology, v. 17, p. 97-104. https://doi.org/10.1016/j.tifs.2005.10.008