Vol.46, n. 2 : pp. 233-242, March 2003
ISSN 1516-8913 Printed in Brazil
BRAZILIAN ARCHIVES OF
BIOLOGY AND TECHNOLOGY
A N I N T E R N A T I O N A L J O U R N A L
Fish Assemblages in a Tidal Flat
Ana Lúcia Vendel
1∗, Sabine Granado Lopes
2, César Santos
2and Henry Louis Spach
21
Departamento de Zoologia; Universidade Federal do Paraná; C. P. 19020; CEP 81531-990; [email protected]; Curitiba - PR - Brazil. 2 Centro de Estudos do Mar; Universidade Federal do Paraná; CEP 83255-000; Pontal do Sul - Pontal do Paraná - PR - Brazil
ABSTRACT
Studies were carried out on fish assemblages in a tidal flat. Samples were obtained monthly at low tide of the half moon in the tidal flat of Paranaguá Bay, Brazil, with two seine nets, one with a 1 mm mesh, 30 m in length and 3 m in height and another with a 10 mm mesh, 65 m in length and 2 m in height. A total of 8,890 fish were captured, comprising 24 families and 53 species. The most abundant species were Harengula clupeola and Atherinella brasiliensis, which represented 63.4% of the total, capture. A seasonal tendency was observed in the abundance of fishes, with less fishes being captured during winter and part of spring. The number of species showed a seasonal pattern, with the gradual decrease through winter and a marked increase in summer. The community structure index indicated seasonal changes in the assemblage. The faunistic similarities between months separated the 12 months into four major groups. The seasonal pattern was apparent in the numerically dominant species and the Cluster Analysis revealed five main groups.
Key words: Tidal flat, fish assemblages, seasonal variation, Brazil
∗ Author for correspondence
INTRODUCTION
Most marine fishes depend on estuaries during part of their life cycle. Besides these marine fish, the estuarine ichthyofauna also encompasses species that spend their entire life in the estuary. A mosaic of habitats, including marsh, mangroves, tidal creeks, tidal flats and the water column, offer several and abundant food resources, protection against predation, besides other favorable environmental conditions for the growth and survival of the initial stages of the fishes life cycles. The use of estuaries as nurseries is crucial for the survival of many species, including several that are important in fishing.
In Brazil, there is little information about the ichthyofauna in shallow marginal areas of estuaries, mainly in the tidal flats, in spite of these
being considered important areas for the recruitment and the breeding of fish (Reise, 1985).
The expression tidal flat is used to represent
MATERIAL AND METHODS
The collections were donne monthly in a tidal flat adjacent to Baguaçu tidal creek in the eurihaline section of Paranagua Bay, Parana, from April 1997 to March 1998 during low tide. The samples were obtained with two seine nets: one of 30 x 3m and a 1mm mesh between adjacent knots and another of 65 x 2m and a 10mm mesh between adjacent knots. Simultaneously, salinity data (with a portable refractometer), temperature and pH (field pH meter) of the surface water were obtained. The climatic data such as air temperature and wind direction and intensity were obtained at the Meteorological Station of the Centro de Estudos do Mar – UFPR; and rainfall was obtained at a meteorological station located in Guaraguaçu River, not very far from the studied area.
To determine the pattern of monthly variation (seasonal) of the composition and abundance of the community, the monthly averages of the following variables were estimated: number of species, number of individuals and capture weight. The following indexes of community structure were also obtained: species richness of Margalef, diversity of Shannon–Wiever, and evenness of Pielou (Pielou, 1969). The unifactorial analysis of variance was used to analyze the significance of the differences (p <0,05) in the standard length and weight of the captured fish (dependent variables) among the months of collection (independent variable). In the a posteriori test of Least Significant Difference the interactions were tested
to evaluate the significance levels between the variables (Sokal and Rohlf, 1981).
With the objective of identifying the assemblages, a Cluster Analysis (R mode) was applied to the log (x+1) transformed density data of the most abundant species, grouping the species using the numeric abundance of the species every month as the attributes. The temporary structure of the assemblages was identified using the Cluster Analysis (Q mode) using the species as the attributes. For this, the similarity among the attributes was calculated using the similarity coefficient of Bray-Curtis, and the grouping method, by the simple average of its similarity values (UPGMA) (Gauch, 1982). Since discreet entities cannot always be found in nature, the Non Metric Multidimensional Scaling was applied to the same data submitted to the Cluster Analysis which, like other ordering techniques, is based on the existence of a continuum in nature. The axes would represent biological or environmental gradients along which, the species or months would be distributed. The evaluation of the influence of the environmental factors on the temporary variation of the community structure was made through the analytical interpretation of the dimensions, using the coefficient of linear
determination (r2) to regress the environmental
variables with the coordinates of the different dimensions.
In this study, the seasons were defined in the following way: September to November = spring; December to February = summer; March to May = autumn; June to August = winter.
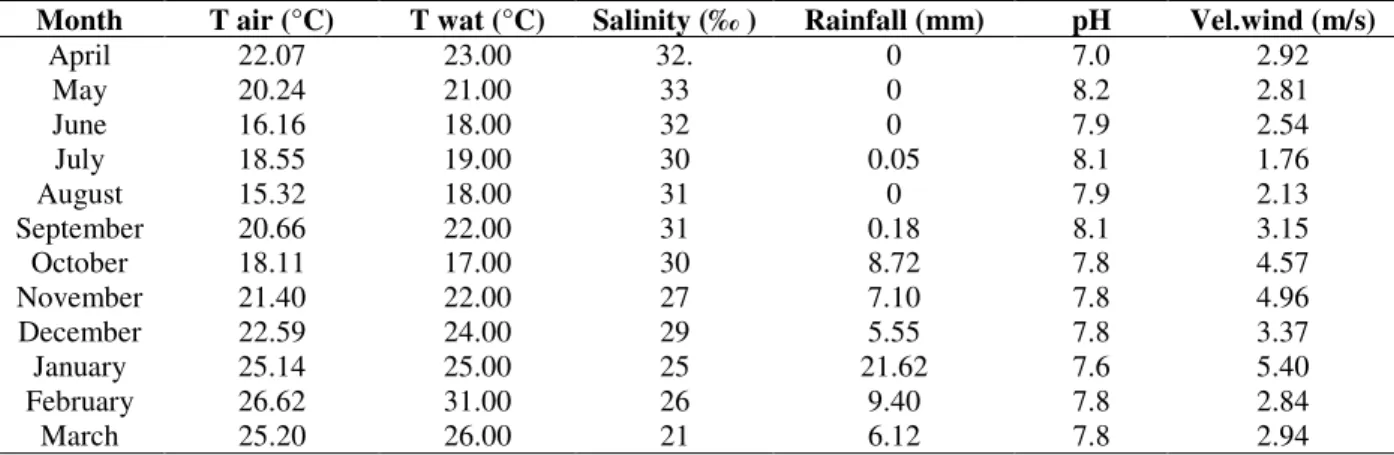
Table 1 - Environmental data recorded in the tidal flat adjacent to Baguaçu tidal creek, Paranagua Bay, Parana. (T
air = air temperature, T wat = water temperature, Vel. wind = wind velocity).
Month T air (°C) T wat (°C) Salinity (‰ ) Rainfall (mm) pH Vel.wind (m/s)
April 22.07 23.00 32. 0 7.0 2.92
May 20.24 21.00 33 0 8.2 2.81
June 16.16 18.00 32 0 7.9 2.54
July 18.55 19.00 30 0.05 8.1 1.76
August 15.32 18.00 31 0 7.9 2.13
September 20.66 22.00 31 0.18 8.1 3.15
October 18.11 17.00 30 8.72 7.8 4.57
November 21.40 22.00 27 7.10 7.8 4.96
December 22.59 24.00 29 5.55 7.8 3.37
January 25.14 25.00 25 21.62 7.6 5.40
February 26.62 31.00 26 9.40 7.8 2.84
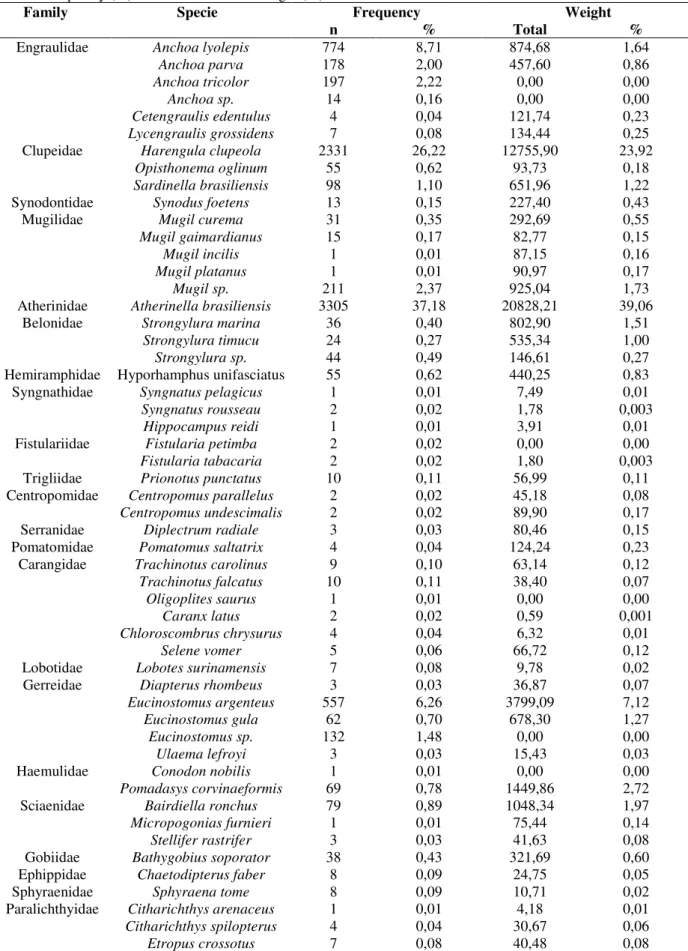
Table 2 - List of the families and species of fish and the values of absolute numeric frequency (n) and relative numeric frequency (%) of total and relative weight (%).
Frequency Weight
Family Specie
n % Total %
774 8,71 874,68 1,64
178 2,00 457,60 0,86
197 2,22 0,00 0,00
14 0,16 0,00 0,00
4 0,04 121,74 0,23
Engraulidae Anchoa lyolepis Anchoa parva Anchoa tricolor
Anchoa sp. Cetengraulis edentulus
Lycengraulis grossidens 7 0,08 134,44 0,25
2331 26,22 12755,90 23,92
55 0,62 93,73 0,18
Clupeidae Harengula clupeola Opisthonema oglinum
Sardinella brasiliensis 98 1,10 651,96 1,22
Synodontidae Synodus foetens 13 0,15 227,40 0,43
31 0,35 292,69 0,55
15 0,17 82,77 0,15
1 0,01 87,15 0,16
1 0,01 90,97 0,17
Mugilidae Mugil curema Mugil gaimardianus
Mugil incilis Mugil platanus
Mugil sp. 211 2,37 925,04 1,73
Atherinidae Atherinella brasiliensis 3305 37,18 20828,21 39,06
36 0,40 802,90 1,51
24 0,27 535,34 1,00
Belonidae Strongylura marina Strongylura timucu
Strongylura sp. 44 0,49 146,61 0,27
Hemiramphidae Hyporhamphus unifasciatus 55 0,62 440,25 0,83
1 0,01 7,49 0,01
2 0,02 1,78 0,003
Syngnathidae Syngnatus pelagicus Syngnatus rousseau
Hippocampus reidi 1 0,01 3,91 0,01
2 0,02 0,00 0,00
Fistulariidae Fistularia petimba
Fistularia tabacaria 2 0,02 1,80 0,003
Trigliidae Prionotus punctatus 10 0,11 56,99 0,11
2 0,02 45,18 0,08
Centropomidae Centropomus parallelus
Centropomus undescimalis 2 0,02 89,90 0,17
Serranidae Diplectrum radiale 3 0,03 80,46 0,15
Pomatomidae Pomatomus saltatrix 4 0,04 124,24 0,23
9 0,10 63,14 0,12
10 0,11 38,40 0,07
1 0,01 0,00 0,00
2 0,02 0,59 0,001
4 0,04 6,32 0,01
Carangidae Trachinotus carolinus Trachinotus falcatus
Oligoplites saurus Caranx latus Chloroscombrus chrysurus
Selene vomer 5 0,06 66,72 0,12
Lobotidae Lobotes surinamensis 7 0,08 9,78 0,02
Gerreidae Diapterus rhombeus 3 0,03 36,87 0,07
Eucinostomus argenteus 557 6,26 3799,09 7,12
Eucinostomus gula 62 0,70 678,30 1,27
Eucinostomus sp. 132 1,48 0,00 0,00
Ulaema lefroyi 3 0,03 15,43 0,03
Haemulidae Conodon nobilis 1 0,01 0,00 0,00
Pomadasys corvinaeformis 69 0,78 1449,86 2,72
Sciaenidae Bairdiella ronchus 79 0,89 1048,34 1,97
Micropogonias furnieri 1 0,01 75,44 0,14
Stellifer rastrifer 3 0,03 41,63 0,08
Gobiidae Bathygobius soporator 38 0,43 321,69 0,60
Ephippidae Chaetodipterus faber 8 0,09 24,75 0,05
Sphyraenidae Sphyraena tome 8 0,09 10,71 0,02
1 0,01 4,18 0,01
4 0,04 30,67 0,06
Paralichthyidae Citharichthys arenaceus Citharichthys spilopterus
Etropus crossotus 7 0,08 40,48 0,08
(Cont. Table 2)
Monacanthidae Stephanolepis hispidus 8 0,09 20,25 0,04
2 0,02 183,66 0,34
400 4,50 4008,08 7,52
31 0,35 1299,61 2,44
10 0,11 90,96 0,17
Tetraodontidae Lagocephalus laevigatus Sphoeroides greeleyi Sphoeroides testudineus
Sphoeroides tyleri
Sphoeroides sp. 2 0,02 0,00 0,00
Total 8890 100,00 53326,08 100,00
RESULTS
Environmental data
The water surface temperature presented the seasonal pattern apparent in the air temperature, with the highest values in the summer and lowest ones in the winter (Table 1). More saline waters prevailed in the coldest periods of the year and the smallest salinities occurred in the summer, coinciding with the maximum precipitation (Table 1). No seasonal pattern was observed in the pH of the water, that was basic during the whole sampling period (Table 1).
Community Structure
A total of 8,890 individuals were captured, weighing 53.326 g, belonging to 54 species of 24
families (Table 2). Two species, Harengula
clupeola and Atherinella brasiliensis, constituted 63.4% and 62.9% of the capture, in number and
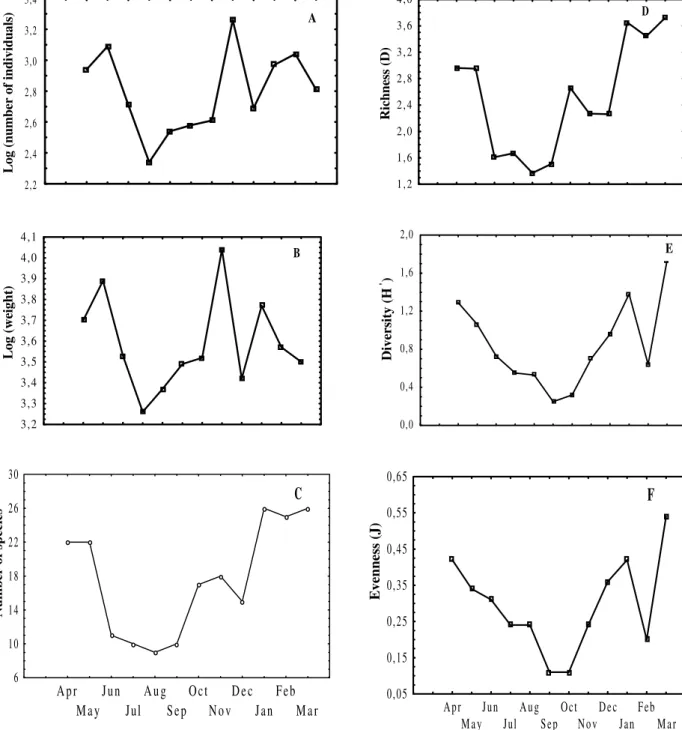
weight, respectively. Of the 54 species present in the area, 31 species showed frequencies of less than 10 individuals (Table 2).The sampled assemblage was made up of 49.65% immature individuals and 50.26% adults. The mean standard length of the fish was 73.31 mm (s=±32.66), indicating the prevalence of small-sized species, most of which had a standard length between 50 and 100 mm. Significant differences (F=15.562, p=0.00) were observed between the monthly averages of standard length, with averages significantly smaller in February, March and May and relatively larger in the spring (Fig. 1A). The mean weight of the specimens was of 7.92 g (s=±12.62), with most individuals weighing less than 20 g. The differences between the monthly averages of weight were also significant (F=5.524, p=0.00), with a significant increase in the summer average compared to the spring average (Fig. 1B), similar to that observed for size.
Figure 1 - Box-Whisker Graph of the result of the Analysis of Variance that evaluates the variations in the mean
standard length and weight of the fish (e = standard error).
Temporal Variation in the Composition
A variation in the number of fishes collected throughout the study period was evident. A seasonal pattern was observed in the abundance,
with the smallest numeric occurrences in the winter and part of the spring. The monthly total capture varied from 218 (July) to 1804 (November) individuals (Fig. 2A). A similar pattern of monthly variation occurred with the
Standard lenght (mm)
5 6 6 0 6 4 6 8 7 2 7 6 8 0 8 4
A p r M a y Jun Jul A u g Sep O c t N o v D e c Jan F e b M a r ±1.96*e ±1.00*e M e a n A
Weight (g)
4 6 8 1 0 1 2 1 4 1 6
A p r M a y J u n Jul A u g S e p O c t N o v D e c J a n F e b M a r
± 1 . 9 6 * e ± 1 . 0 0 * e M e a n
capture weight, with the smallest captures in weight occurring in the winter and in the spring, with the exception of December (Fig. 2B). Comparing the total number of species per collection month, we observed that a smaller amount of species was collected in June (11), July (10), August (9) and September (10). The number
of species was considerably larger in January (26), February (25) and March (26) (Fig. 2C).
The fluctuations in the richness of species also presented a seasonal tendency. The smallest values (<1.70) were registered between June and September, while the values were larger (3.4 to 3.7) from January to March (Fig. 2D).
Figure 2 - Monthly variation in the number of individuals (A), capture weight (B), number of species (C), richness
(D), diversity (E) and evenness (F), in the studied tidal flat.
Log (number of individuals)
2,2 2,4 2,6 2,8 3,0 3,2 3,4
A
Log (weight)
3,2 3,3 3,4 3,5 3,6 3,7 3,8 3,9 4,0 4,1
B
Number of species
6 10 14 18 22 26 30
A p r M a y
J u n Jul
A u g S e p
O c t N o v
D e c Jan
F e b M a r C
Richness (D)
1 , 2 1 , 6 2 , 0 2 , 4 2 , 8 3 , 2 3 , 6 4 , 0
D
Diversity (H
')
0,0 0,4 0,8 1,2 1,6 2,0
E
Evenness (J)
0,05 0,15 0,25 0,35 0,45 0,55 0,65
Apr M a y
Jun Jul
A u g Sep
Oct N o v
D e c Jan
Feb M a r
The seasonality was also evident in the species diversity and in the evenness. The diversity varied from 0.25 (September) to 1.73 (March), with the largest values, occurring in the hottest period of the year, except February (Fig. 2E). The evenness was between 0.11 (September and October) and 0.54 (March) (Fig. 2F).
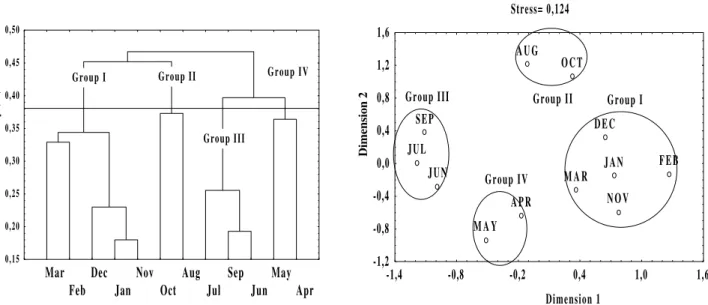
The Cluster analysis of the monthly samples separated them into four main groups at a level of 62% of similarity between the species composition and numeric abundance (Fig. 3). The groups formed with this analysis showed considerable similarity with regard to the number of
individuals, number of species, species diversity and richness. Groups I and IV corresponded to periods with larger number of fishes, of species, diversity and richness, while groups II and III presented smaller values of these population parameters. This categorization also appeared in the MDS analysis, which separated the four groups of samples identified above, with group I appearing to the right of the ordering graph, group III to the left, and the groups II and IV in the intermediary part of the ordering graph (Fig. 3).
Figure 3 - Dendrogram and Ordering graph (MDS) based on the data of numeric abundance of the main 16 taxa,
sampled monthly in the tidal flat. Groups of months delineated at the level of 62% in the Cluster Analysis, are surrounded in the MDS.
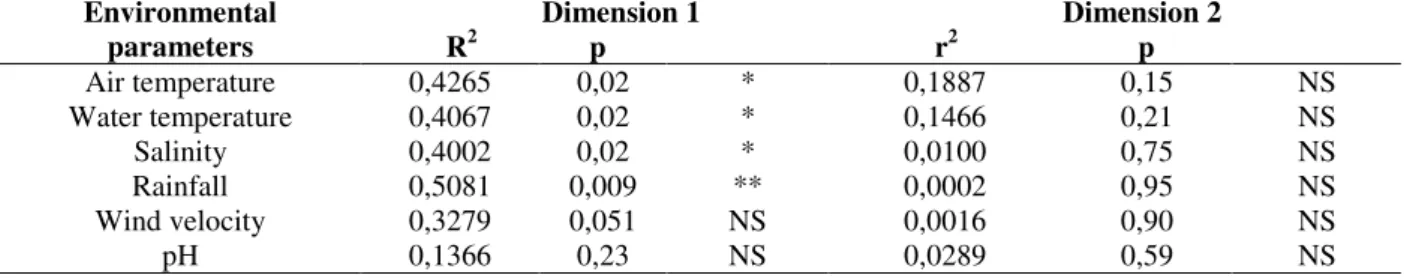
Correlating the coordinates of the months in the different dimensions, against the sampled environmental variables, a significant influence of the factors air temperature (42.65%), water temperature (40.67%), salinity (40.02‰) and rainfall (50.81%) over the temporary variation of the community structure, along dimension 1, was noted. On the other hand, the factors wind speed and pH explained very little about the monthly variation in the numeric abundance of the considered species (Table 3). The grouping of the months of November to March was characterized by the presence of larger air and water temperatures; the largest rainfall and the smallest salinities. The grouping of the months of April and May presented intermediary air and water
temperatures during the year, no rainfall and the largest salinities of the sampled period.
The other two groups of months were characterized by the smallest air and water temperatures, low rainfall values, smaller salinities than in the group IV and larger salinities than in the group I.
Using the Cluster Analyses and MDS, we analyzed the similarities between the patterns of abundance of the most common species present in the twelve months of collection. The groupings of species evident at the level of 59% in the dendrogram (Fig. 4) was also evident in the MDS plotting (Fig. 4), but was not clearly delineated, due to high stress (0.16). Groups I and II, formed by two and three species, respectively, were
Dissimilariety (%)
0,15 0,20 0,25 0,30 0,35 0,40 0,45 0,50
Mar Feb
Dec Jan
Nov Oct
Aug Jul
Sep Jun
May Apr
Group I Group II
Group III
Group IV
Stress= 0,124
Dimension 1
Dimension 2
A P R
M A Y JUN
JUL
A U G
SEP
O C T
N O V D E C
JAN F E B
M A R
-1,2 -0,8 -0,4 0,0 0,4 0,8 1,2 1,6
-1,4 -0,8 -0,2 0,4 1,0 1,6
Group I Group II
Group III
common in coastal waters, especially bays and estuaries, with low occurrences during all seasons, relatively higher in autumn and in winter in the second group. Group III was formed by two species found preferentially in more saline waters of estuaries, present in the spring and autumn and absent in the winter. Group IV was formed by three species, resident in the area and present in the samples of every collection month. A total of six species was not included in these groups. The
migrating species O. oglinum was present almost
exclusively in the autumn; P. corvinaeformis,
a species common in estuaries, appeared mostly in
February, S. brasiliensis, a marine migrant, was
only present in the samples from spring to
summer. The species A. parva and S. testudineus,
common in the shallow areas of estuaries, occurred at low frequencies throughout the year, but mostly in the spring and in the summer. The
species H. clupeola, a fish of coastal waters, was
absent in the area from half of the autumn to almost the end of the spring, occurring at high frequencies in the other seasons of the year.
Table 3 - Results of the correlation between the environmental parameters and the groupings of the samples
(* =significant p <0,05, * * = significant p <0,01, NS = not significant, r2 = determination coefficient).
Dimension 1 Dimension 2
Environmental
parameters R2 p r2 p
Air temperature 0,4265 0,02 * 0,1887 0,15 NS
Water temperature 0,4067 0,02 * 0,1466 0,21 NS
Salinity 0,4002 0,02 * 0,0100 0,75 NS
Rainfall 0,5081 0,009 ** 0,0002 0,95 NS
Wind velocity 0,3279 0,051 NS 0,0016 0,90 NS
pH 0,1366 0,23 NS 0,0289 0,59 NS
Figure 4 - Dendrogram and Ordering graph (MDS) showing the similarities between the most abundant taxa, based
on their occurrences throughout the twelve sampling months in the tidal flat. Groups of species delineated at the level of 59% in the Cluster Analysis, are surrounded in MDS.
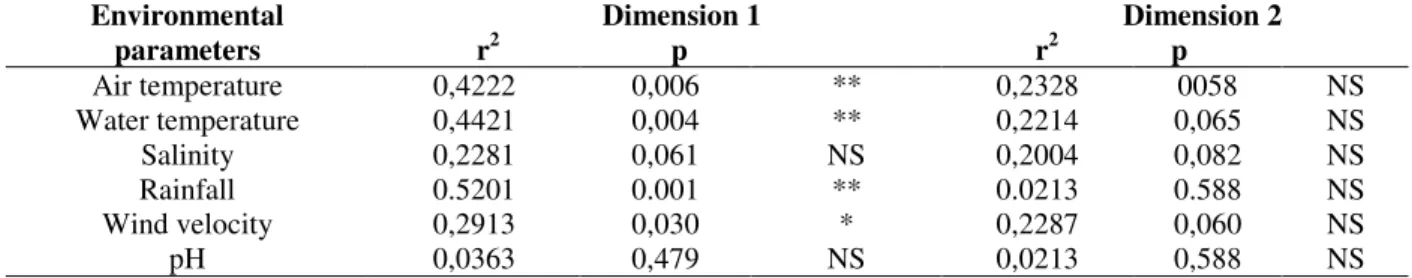
The correlation analysis indicated the relative importance of the environmental variables in the control of the numeric occurrence of the fish. The
air temperature (42.22%), water temperature (44.21%), rainfall (52.01%) and wind speed (29.13%) contributed significantly to explain the
Dissimilariety (%)
0,1 0,2 0,3 0,4 0,5 0,6 0,7
O.oglinum
Pcorvinaeformis
S.brasiliensis
S.marina
H.unifasciatus
S.timucu
E.gula
B.soporatus
A.parva
S.testudineus
A.tricolor A.lyolepis H.clupeola S.greeleyi
E.argenteus
A.brasiliensis
Group I Group II
Group III Group IV
Stress= 0,1613
Dimension 1
Dimension 2
A B R B S O
E A R S T E
S G R E G U
S B R
A P A H C L O O G
A L Y STI
H U N
P C O
S M A
A T R
-1,4 -0,8 -0,2 0,4 1,0 1,6
-1,8 -1,4 -1,0 -0,6 -0,2 0,2 0,6 1,0 1,4 Group I
Group II
variation associated to the abundance of the 16 selected species, (Table 4). The temporary distributions of the species in groups I and IV, present throughout the whole sampling period, did not seem to be influenced by the considered parameters. However, the species in groups II
would be associated to autumn and winter conditions (smaller temperatures, smaller rainfall and larger mean wind speeds), and in group III to spring and summer conditions (larger temperatures, larger rainfall and smaller mean wind speeds).
Table 4 - Results of the correlation between the environmental parameters and the species groups (* =significant
p <0,05, * * = significant p <0,01, NS = not significant, r2 = determination coefficient).
Dimension 1 Dimension 2
Environmental
parameters r2 p r2 p
Air temperature 0,4222 0,006 ** 0,2328 0058 NS
Water temperature 0,4421 0,004 ** 0,2214 0,065 NS
Salinity 0,2281 0,061 NS 0,2004 0,082 NS
Rainfall 0.5201 0.001 ** 0.0213 0.588 NS
Wind velocity 0,2913 0,030 * 0,2287 0,060 NS
pH 0,0363 0,479 NS 0,0213 0,588 NS
DISCUSSION
In general, fishes of the families Sciaenidae, Engraulidae, Atherinidae, Mugilidae, Clupeidae, Bothidae and Pleuronectidae were the most abundant in estuarine areas (Felley, 1987). In the studied tidal flat, there was a numeric dominance of the families Engraulidae, Clupeidae and Atherinidae, with a reduced occurrence of individuals from the other families. These results differed partly from the observations carried out at a site close to the study area, inside Baguaçu tidal creek, where the family Engraulidae prevailed and there were few fishes from the families Clupeidae and Atherinidae (Vendel, 1997). In a tidal flat adjacent to Sucuriú tidal creek, Cunha (1999) a high abundance of clupeids and aterinids was observed, as well as a relative abundance of tetraodontiforms, different from the present study.
The prevalence of H. clupeola and A. brasiliensis,
observed in the tidal flat, was verified previously in another flat of Rasa da Cotinga Island (Cunha, 1999), and also in the surf zone of three beaches of Mel Island (Pinheiro, 1999). Nardi (1999), studying the ichthyofauna of Baguaçu tidal creek, verified that the two species were only present in the tidal creek at high tide, when there was a gradual increase in salinity. Although the specific diversity was high, most of the species were present in the tidal flat in small quantities, what was a characteristic of the estuarine environments (Kennish, 1990). This pattern was also observed in other studies accomplished in the estuary of Paranaguá Bay (Godefroid, 1997; Vendel, 1997;
Abilhôa, 1998; Pinheiro, 1999; Cunha, 1999; Nardi, 1999).
The proportionality observed in the occurrence of juvenile and adult fishes at the studied tidal flat was similar to that found by Nardi (1999) in the internal area of Baguaçu tidal creek. A larger occurrence of adults observed by Cunha (1999), at another tidal flat, was associated with the differences in the net selectivity, since the author used only one net with a 10 mm mesh between adjacent knots. In a beach environment, Godefroid (1997), also using a 1 mm net, captured almost exclusively juvenile individuals. The use of two nets with different meshes and dimensions seemed to have allowed a better representation in the captures of the fishes present in the tidal flat. In the medium and high latitudes, there was a periodic invasion of the shallow areas of the estuaries by the offspring of species of fish that spawn hundreds of kilometers away from the area. These species are transients, in the sense of they are only temporary residents of the habitat, although, in seasonal terms, they can frequently
dominate the community (Weinsten and Heck,
correspond to the period of larger exit of fish for other habitats. Estuaries, coastal bays and shallow habitats are systems that work as important areas for the breeding of fish, mainly in the spring and in the summer, when the occupation indexes and the primary and secondary productions are larger (Allen, 1982; Onuf and Quammen, 1983). The seasonal coincidence of the peaks in abundance of fish and in the secondary production suggests that the food availability can be the main factor influencing the nursery function of these internal areas.
The grouping analysis, applied to the data of this tidal flat revealed that the samples assembled due to similarities in the abundance and in the diversity, corresponding again to the occupation dynamics of the area by juvenile forms and, partly, by adult individuals of resident species. The differences observed in the groupings of samples between this study and the one accomplished inside Baguaçu tidal creek (Nardi, 1999) seemed to indicate the escape of small fish through the mesh of the fixed nets used inside the tidal creek. This escape would have caused low captures in November and December, a period when small fishes prevail in the area.
The higt abundance of marine fishes in the juvenile stages in the tidal flat confirmed the importance of this habitat as a growth and feeding area. Several engraulid, clupeid, mugilid, centropomid and carangid species, common in the captures of the regional fishing (craft and commercial), were present in the tidal flat, mostly at stages that precede the recruitment of the adult population. The results of this study showed that the tidal flat was equally important for the species resident in the estuaries and the for occasional visitors as well as for the reproduction of some species.
The ecological importance of the marginal habitats of estuaries as breeding areas for protection and as a source of nutrients is well documented in the literature. However, it is difficult to quantify the losses for the local fishing, when alterations occur in these habitats. The maintenance and the preservation of small swamp areas or marsh, inside the estuary, are equally difficult to defend, because the value of a small area of the habitat seems inconsequent for the fishing, when considering the total area of the estuary.
However, throughout time, the sum of these small areas can commit considerable part of the habitat that sustains this renewable resource
(Burchmore, 1993). The analysis about composition, structures and temporary variation of fish assemblages in tidal flats, when correlated with biotic and abiotic factors, seems to be the most appropriate initial approach, to estimate the effect of the anthropic activity when a destruction of the habitat occurs.
ACKNOWLEDGEMENTS
This work had a financial support of CNPq and of the Federal University of Parana. The authors thank Rodrigo Godefroid and Marion Hofstaetter for ainding in the identification of some species of fish.
RESUMO
As amostras foram obtidas mensalmente na baixa-mar de quadratura em uma planície de baixa-maré da Baía de Paranaguá, Brasil, com duas redes de pesca tipo picaré: uma com malha de 1mm, 30m de comprimento e 3m de altura, e outra com malha de 10mm, 65m de comprimento e 2m de altura. Foram capturados 8890 peixes, de 24 famílias e 53
espécies. As espécies Harengula jaguana e
Atherinella brasiliensis foram as mais abundantes, representando 62,4% da captura total. Foi observada uma tendência sazonal na abundância numérica dos peixes, com as menores capturas ocorrendo durante o inverno e parte da primavera. A riqueza em espécies apresentou padrão padrão sazonal, com decréscimo gradual ao longo do inverno e aumento marcante no verão. Os índices de estrutura da comunidade indicaram mudanças estacionais. As similariedades faunísticas permitiram a separação dos meses de coleta em 4 grupos principais. O padrão sazonal foi vizível nas espécies numericamente dominantes e a Análise de Cluster revelou 5 grupos principais.
REFERENCES
Abilhôa, V. (1998), Composição e estrutura da ictiofauna em um banco areno-lodoso na Ilha do Mel, Paraná, Brasil. Master Thesis, Federal University of Paraná, Curitiba, Brazil
Burchmore, J. (1993), Management of the estuarine habitat. In: Hancock, D. A. (ed.). Sustainable Fisheries though Sustaining Fish Habitat.
Proceedings of the Australian Society of Fish Biology Workshop, August 1992, Camberra, Australia. pp. 184-187.
Cunha, F. (1999), Estrutura das assembléias de peixes na gamboa do Sucuriú, Ilha Rasa da Cotinga, Baía de Paranaguá: agosto/98 a janeiro/99. BSc Monography, Federal University of Parana, Curitiba, Brazil. Felley, J. D. (1987), Nekton assemblages of three
tributaries to the Calcasieu estuary, Lousiana.
Estuaries, 10, 321-329.
Gauch Jr., H. G. (1982). Multivariate analysis in community ecology. Cambridge University Press, Cambridge.
Godefroid, R. S. (1997), Estrutura da comunidade de peixes da zona de arrebentação da praia de Pontal do Sul, Paraná, Brasil. Master Thesis, Federal University of Parana, Curitiba, Brazil.
Kennish, M. J. (1990), Ecology of estuaries. Boston : C. R. C. Press.
Knudsen, E. E. and Herke, W. H. (1978), Grow rate of marked juvenile Atlantic croakers, Micropogon undulatus, and length of stay in a coastal marsh nursery in southwest Lousiana. Trans. Am. Fish. Soc.,107, 12-20.
Nardi, M. (1999), Assembléia de peixes em um ambiente de gamboa. BSc Monography, Federal University of Paraná, Curitiba, Brazil.
Onuf, C. P. and Quammen, M. I. (1983), Fishes in a California coastal lagoon. Effects of major storms on distribuition and abundance. Mar. Ecol. Prog. Ser.,
12, 1-14.
Pielou, E. C. (1969), The measurement of diversity in different types of biological colections. J. Theor. Biol., 13, 131-144.
Pinheiro, P. C. (1999), Dinâmica das comunidades de peixes em três áreas amostrais da Ilha do Mel, Baía de Paranaguá, Paraná, Brasil. Master Thesis, Federal University of Paraná, Curitiba, Brazil.
Reise, K. (1985), Tidal flat ecology. Spring-Verlag, Berlin.
Sokal, R. R. and Rohlf, F. J. (1981), Biometry. State University of New York at Stony Brook, New York. Vendel, A. L. (1997), Dinâmica e estrutura da
assembléia de peixes na Gamboa do Baguaçu, Baía de Paranaguá, Paraná. BSc Monography, Federal University of Paraná, Curitiba, Brazil.
Wensten, M. P. and Heck, K. (1979), Icthyofauna of seagrass meadows along the Caribeancoast of Panama and in the Gulf of Mexico: Composition, sctruture and community ecology. Mar. Biol., 50, 97-108.