Mapping of resistance genes to races 1, 3 and 5 of
Podosphaera
xanthii
in melon PI 414723
Ana Carolina Fazza1, Leandro José Dallagnol1, Ana Cristina Fazza1, Carolina C. Monteiro1, Bruno Marco de Lima1, Debora Targino Wassano1 and Luis Eduardo Aranha Camargo1*
Received 08 February 2012
Accepted 16 October 2013
Abstract – The fungus Podosphaera xanthii affects melon crops and presents several races controlled by race-specific resistance genes.
The accession PI 414723 is resistant to races 1, 3 and 5 and it is a suitable source of resistance genes. The inheritance of resistance to these races was analyzed on 87 F2 plants from the cross of PI 414723 × Védrantais, and resistance to all three races could be ex-plained by the segregation of a single dominant gene, although a digenic model could also be accepted. A genetic map was assembled with 206 markers, and co-segregation analysis of resistance phenotypes indicated the existence of two linked loci in linkage group II, one conferring resistance to races 1 and 5 (denominated Pm-x1,5), and the second to race 3 (denominated Pm-x3), located 5.1 cM apart. This study reports for the first time the existence of Pm-x3 and the genetic locations of these resistance genes from PI 414723.
Key words: Disease resistance, molecular marker, genetic mapping, powdery mildew.
Crop Breeding and Applied Biotechnology 13: 349-355 2013 Brazilian Society of Plant Breeding. Printed in Brazil
ARTICLE
1 Universidade de São Paulo, Escola Superior de Agricultura “Luiz de Queiroz”, Departamento de Fitopatologia e Nematologia, Av. Pádua Dias, 11, 13.418-900, Piraci-caba, SP, Brasil. *Email: [email protected]
INTRODUCTION
Melon (Cucumis melo L., 2n=2x=24) is an economi-cally important export crop in Brazil. Between 2001 and 2008, melon production in the Northeast region accounted for 95% of the national total production, and in 2009, it resulted in the export of 184 thousand tons of fresh fruits, generating an income of U$ 122 million (Agra FNP 2011). Powdery mildew is a foliar disease caused by the fungus
Podosphaera xanthii (Castagne) U. Braun & N. Shishkoff
(Shishkoff 2000), which limits the production of melon crops worldwide. According to McCreight (2006), 28 probable races of P. xanthii can be identified based on the reactions of 31 melon genotypes. In Brazil, the presence of races 1 and 2-French has been reported (Reifschneider et al. 1985, Kobori et al. 2004, Reis and Buso 2004).
Resistance to P. xanthii is predominantly controlled by major genes with dominant effects (Kenigsbuch and Cohen 1992, Epinat et al. 1993), although there are reports of recessive genes and modifiers (McCreight et al. 1987, Yuste-Lisbona et al. 2010). To date, 12 major genes have been described (Pitrat 2006, Liu et al. 2010), but only four have been mapped (Pitrat 1991, Périn et al. 2002, Teixeira et al. 2008).
The accession PI 414723 (Cucumis melo subsp. agrestis) is resistant to insects and fungal diseases, including powdery mildew. Besides resistance to race 2-French, conferred by
Pm-x, PI 414723 also carries Pm-7 for resistance to race 1 (Anagnostou et al. 2000, Pitrat 2006) and is resistant to races 3 and 5 (Pitrat et al. 1998). However, the genetic location of Pm-7 and the mode of inheritance of resistance to races 3 and 5 are not known. Thus, the aim of this study was to define the mode of inheritance of resistance to races 3 and 5 of P. xanthii in the cross PI 414723 × Védrantais, and to locate the resistance genes to these races, and to race 1 in a linkage map using referenced microsatellite, as well as AFLP and TRAP markers.
MATERIAL AND METHODS
Plant material
A population of 87 F2 plants was generated from a cross
between PI 414723 and Védrantais. The former was used as male parent, belonging to the Group Momordica (Cucumis melo subsp. agrestis), and it is resistant to races 1, 3, and 5 of P. xanthii, while the latter is a French commercial line belong-ing to Cantaloupensis Charentais Group (Cucumis melo subsp.
Isolates and scoring of resistance to P. xanthii Isolates Px04 (race 1), Px08 (race 3) and Px02 (race 5) of P. xanthii were maintained by regular inoculations on cotyledons of Safira cucumber cultivar, under controlled conditions, using an eyelash brush (Nicot et al. 2002). After inoculation, cotyledons were incubated in a growth chamber with a photoperiod of 12 h light/12 h dark, at 21±2ºC, for about 15 days. Isolates were classified into races based on the reaction of seven differential melon genotypes (Védrantais, PMR 45, WMR 29, Edisto 47, PMR 5, PI 414723 and PI 124112), according to Pitrat et al. (1998), with the addition of Hale’s Best Jumbo as susceptible line (Thomas 1978). F2 plants plus three plants from each of the parental lines, and F1 hybrid were inoculated with races 1, 3 and 5 of P.
xanthii, using an eyelash brush in the third, fourth and fifth
fully expanded leaves, by placing the inoculum of each race at two equidistant spots (in relation to the midrib), on each leaf (totaling six inoculation spots per race), according to Yuste-Lisbona et al. (2010). Leaves were monitored from eight to sixteen days after inoculation (42 to 50 days after sowing) when they were visually scored to the naked eye, for the presence of fungal structures. Plants with no visible sporulation or low level of sporulation were considered to be resistant, whereas those with moderate level of sporulation, or profuse sporulation were considered to be susceptible (Yuste-Lisbona et al. 2010).
DNA extraction
DNA was extracted from leaves, according to Teixeira and Camargo (2006), except that the DNA solution was ex-tracted with phenol: chloroform: isoamyl alcohol (25:24:1), and, after precipitation, DNA pellet was re-suspended with 1 M NaCl, and re-precipitated with ethanol (Barker 2005).
DNA was suspended in 100 µl of TE, and its concentration was determined by spectrometry.
Molecular markers
Forty seven microsatellite markers polymorphic between PI 414723 and Védrantais were selected from the linkage maps described by Fukino et al. (2008) and Gonzalo et al. (2005), in order to represent all linkage groups and provide a map framework. The PCR reactions consisted of 20 ng of DNA, 0.6 µM of each primer, 1X PCR Master Mix (Pro-mega - M7505) and ultrapure sterile water to complete 12 µl. The amplification conditions were according to Gonzalo et al. (2005), with the exception that 25 amplification cycles were used and the annealing temperature was optimized for each marker.
The amplification of AFLP fragments was based on an adaptation of the protocol of Vos et al. (1995) using the PCR Master Mix (Promega - M7505). Six and 23 combinations of primers were used, respectively, in the pre and selective amplifications. Genomic DNA was digested with EcoRI/MseI
or HindIII/MseI (Teixeira and Camargo 2006). AFLP
mark-ers were identified according to the Keygene AFLP primer nomenclature system followed by their size in base pairs (http://wheat.pw.usda.gov/ggpages/keygeneAFLPs.html).
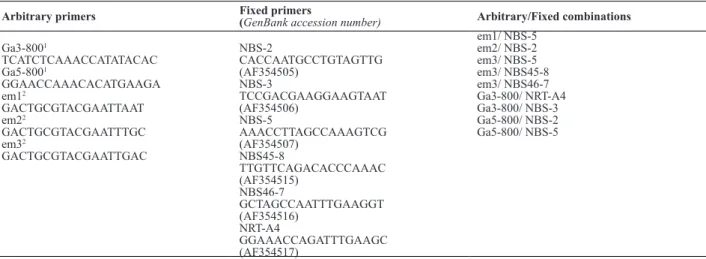
Target region amplification polymorphism (TRAP) markers were generated according to Hu and Vick (2003). Fixed primers were designed based on nucleotide binding site-leucine-rich-repeat (NBS-LRR) sequences of melon reported by Brotman et al. (2002), and deposited in GenBank under accession numbers AF354505-07 and AF354515-17 (Table 1). Arbitrary primers were those reported by Li and Quiros (2001) and Hu and Vick (2003). Nine combinations
Table 1. Sequences of arbitrary and fixed primers and combinations of primers used to amplify TRAP markers
Arbitrary primers Fixed primers (GenBank accession number) Arbitrary/Fixed combinations
Ga3-8001
TCATCTCAAACCATATACAC Ga5-8001
GGAACCAAACACATGAAGA em12
GACTGCGTACGAATTAAT em22
GACTGCGTACGAATTTGC em32
GACTGCGTACGAATTGAC
NBS-2
CACCAATGCCTGTAGTTG (AF354505)
NBS-3
TCCGACGAAGGAAGTAAT (AF354506)
NBS-5
AAACCTTAGCCAAAGTCG
(AF354507)
NBS45-8
TTGTTCAGACACCCAAAC (AF354515)
NBS46-7
GCTAGCCAATTTGAAGGT (AF354516)
NRT-A4
GGAAACCAGATTTGAAGC
(AF354517)
em1/ NBS-5 em2/ NBS-2 em3/ NBS-5 em3/ NBS45-8
em3/ NBS46-7
Ga3-800/ NRT-A4 Ga3-800/ NBS-3 Ga5-800/ NBS-2 Ga5-800/ NBS-5
of fixed/arbitrary primers were used (Table 1), and amplifi -cation conditions followed Hu and Vick (2003), except that 12 cycles were used in the first amplification round. PCR reaction consisted of 100 ng of DNA, 1X of PCR Master Mix (Promega - M7505), 0.5 µM of arbitrary primer, 0.8 µM of fixed primer and ultrapure sterile water to complete 12 µl. Markers were identified by the primer combination, followed by the fragment size (bp).
Microsatellite markers were subjected to electrophoresis on 7.5% polyacrylamide gel, and AFLP and TRAP markers on 6.0% gel, according to Teixeira and Camargo (2006). Gels were stained with silver nitrate according to Creste et al. (2001).
Segregation and linkage analyses
χ2 test was used to analyze the segregation ratio of
resistant:susceptible F2 plants for each race and to test the hypothesis of independent segregation of the resistance genes (p=0.01). The test was also used to identify any marker with segregation distortion by testing the conformity of the observed frequencies of marker-genotype classes for each marker locus to the expected ratios of 3:1 (dominant, in the case of AFLP and TRAP markers) or 1:2:1 (co-dominant, in the case of microsatellite markers), using the Bonferroni correction (α-value = 0,00020). Segregation distortion was inferred when p-value <α. A linkage map was constructed with MAPMAKER version 3.0 (Lander et al. 1987). Markers were associated with the group and ordered with the order
commands with LOD ≥ 3.5. Microsatellite markers were used for defining the linkage groups which were named according to Périn et al. (2002). Distances were calculated with the Kosambi´s mapping function. MapChart program version 2.2 was used to draw the linkage groups (Voorrips 2002). Resistance genes were mapped by coding the reac-tions of F2 plants as a dominant marker.
RESULTS AND DISCUSSION
Scoring of resistance to P. xanthii and segregation analysis
Structures of powdery mildew became visible at the inoculation points approximately 8 days after inoculation, and leaves were scored 16 days after inoculation. For all
three races, plants of Védrantais displayed lesions typical of a susceptible reaction with abundant conidia and conid-iophores, whereas those of PI 414723 and of F1 plants were
resistant, with none or very sparse production of these fungal structures. Most of F2 plants showed the same reaction to all three races, except for four plants that were resistant to races 1 and 5, but susceptible to race 3, indicating that they were recombinants. Therefore, the lesions of these plants were again analyzed to the naked eye and the possibility that they represented inoculation escapes was ruled out. The number of resistant and susceptible F2 plants to races 1 and 5 were 75 and 12, respectively. For race 3, 71 plants were resistant, and 16 were susceptible. In both cases, segregation ratios conformed both to 3:1 and 13:3 at different probability levels (Table 2). However, the hypothesis of independent segregation of the genes for resistance to races 1 and 5, and to race 3 was rejected regardless of the segregation ratio considered (data not shown).
The most parsimonious interpretation of the segrega-tion ratios of resistant and susceptible plants indicated that resistance to races 1, 3 and 5 of PI 414723 can be explained by the segregation of a single dominant resistance gene (3:1 segregation ratio). However, data also fit a digenic epistatic model (13:3 segregation ratio) due to the high frequency of resistant plants. It is possible that some of these plants represent inoculation escapes. However, the frequency of such cases is expected to be low since each plant was inoculated six times with the same isolate. Therefore, under the digenic epistatic model, resistance to a given race would be controlled by one dominant and one recessive gene (designated as A and b, respectively). The genotypes of resistant plants would be either A___ or __bb, and the susceptible’s would be aaB_. Epistasis would occur in the case of the double recessive genotype
aabb, where bb combination would be epistatic over aa,
and would condition resistance. Most likely, population size and qualitative nature of the present phenotypic data did not allow a clear distinction between monogenic and digenic models. Notwithstanding, co-segregation analysis of disease reaction phenotypes indicated that the dominant gene that confers resistance to races 1 and 5 is distinct from the one that confers resistance to race 3, although they are closely linked. These genes are hereby designated Pm-x1,5
Table 2. Segregation of resistance to Podosphaera xanthii races 1, 5 and 3 in progeny of the cross between PI 414723 and Védrantais
Races 1 and 5 Race 3
Progeny observedR:S χ(3:1)2 p-value χ(13:3)2 valuep- observedR:S χ(3:1)2 p-value χ(13:3)2 p-value
PI 414723 3:0 3:0
Védrantais 0:3 0:3
F1 3:0 3:0
and Pm-x3. The first two letters follow the conventional
abbreviation used for resistance genes to P. xanthii in melon (Pitrat 2006) and the third follows the previous
Pm-x gene identified in PI414723, which confers resistance
to race 2-French (Pitrat 1991). The relation of Pm-x1,5
to the previously described Pm-7, also from PI414723,
and which confers resistance to race 1 (Anagnostou et al. 2000), remains to be determined once the map position of
Pm-7 was not defined. Monogenic control of resistance to
P. xanthii has been extensively described in melon (Pitrat 2006, Liu et al. 2010), whereas a digenic control following the same dominant/recessive epistatic model mentioned above was recently proposed by Yuste-Lisbona et al. (2010) for resistance to races 1, 2, and 5 in TGR-1551 melon genotype. More interestingly, these data initially indicated that resistance to all three races was conferred by the same genes; however, in a following study using quantitative rather than qualitative phenotypic data (Yuste-Lisbona et
al. 2011a), it was concluded, like in the present study, that the dominant locus consisted of two tightly linked genes located on LG V, one controlling resistance to races 1 and 2 (Pm-R1-2), and the other to race 5 (Pm-R5).
Linkage map and gene mapping
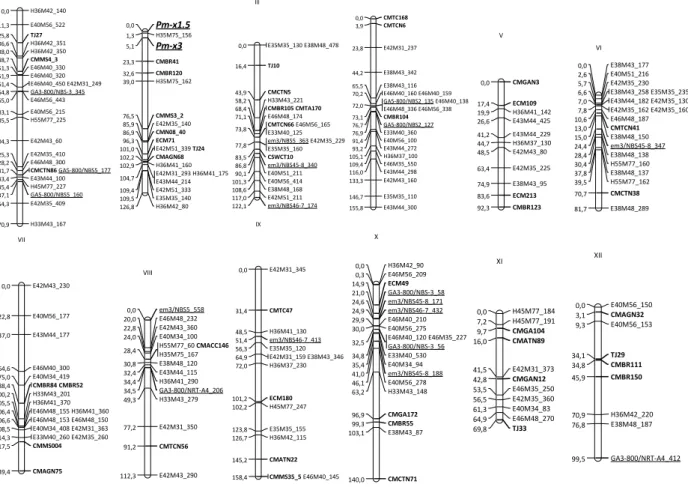
The primer combinations used to amplify AFLP and TRAP fragments resulted in the amplification of 1.173 AFLP and 213 TRAP loci, of which 139 (12%) and 18 (8%), respectively, were polymorphic and mapped. In addition, 47 microsatellite markers and the genes for resistance to races 1 and 5, and to race 3 were also mapped, resulting in the assembly of a linkage map with 206 markers distributed in 12 linkage groups (LG), and spanning 1,469 cM (Fig-ure 1). Among the mapped loci, only one (AFLP) marker presented segregation distortion. 12 LG were named in accordance to Périn et al. (2002), based on SSR markers mapped by Gonzalo et al. (2005) and Fukino et al. (2008).
E42M31_345 0,0 CMTC47 31,4 H36M41_130 48,5 em3/NBS46-7_413 51,4 E35M35_120 56,3 E42M31_159 E38M43_346 64,9 H36M37_230 72,0 ECM180 101,2 H45M77_247 102,2 E35M35_155 123,8 H36M42_115 126,7 CMATN22 145,2 CMMS35_5E46M40_145 158,4 IX E40M56_150 0,0 CMAGN32 3,1 E40M56_153 9,3 TJ29 34,1 CMBR111 34,8 CMBR150 45,9 H36M42_220 70,9 E38M48_187 76,8 GA3-800/NRT-A4_412 99,5 XII H45M77_184 0,0 H45M77_191 7,2 CMGA104 9,7 CMATN89 16,0 E42M31_373 41,5 CMGAN12 42,8 E46M35_250 53,5 E42M35_360 56,5 E40M34_83 61,3 E46M48_270 64,9 TJ33 69,8 XI H36M42_90 0,0 E46M56_209 0,3 ECM49 14,9 GA3-800/NBS-3_58 21,0 em3/NBS45-8_171 24,6 em3/NBS46-7_432 24,9 E46M40_210 29,9 E40M56_275 30,0 E46M40_120 E46M35_227 GA3-800/NBS-3_56 32,5 E33M40_530 34,8 E40M34_94 35,4 em3/NBS45-8_188 41,0 E40M56_278 46,1 H33M43_148 63,2 CMGA172 96,9 CMBR55 99,3 E38M43_87 103,1 CMCTN71 140,0 X em3/NBS5_558 0,0 E46M48_232 20,0 E42M43_360 22,8 E40M34_100 24,0 H55M77_60CMACC146 H35M75_167 28,4 E38M48_120 30,8 E43M44_115 32,4 H36M41_290 34,4 GA3-800/NRT-A4_206 34,5 H33M43_279 49,3 E42M31_350 77,2 CMTCN56 91,2 E42M43_290 112,3 VIII E42M43_230 0,0 E40M56_177 22,8 E43M44_177 37,0 E46M40_300 64,6 E40M34_419 75,0 CMBR84 CMBR52 88,4 H33M43_201 100,2 H36M41_370 105,5 E46M48_155 H36M41_360 106,4 E46M48_153 E46M48_150 106,6 E40M34_408 E42M31_363 108,5 E33M40_260 E42M35_260 114,3 CMMS004 117,5 CMAGN75 139,4 VII E38M43_177 0,0 E40M51_216 2,6 E42M35_230 5,7 E38M43_258 E35M35_235 6,6 E43M44_182 E42M35_130 7,0 E42M35_162 E42M35_160 7,8 E46M48_187 10,6 CMTCN41 13,0 E38M48_150 15,0 em3/NBS45-8_347 24,4 E38M48_138 28,4 H55M77_160 30,4 E38M48_137 37,8 H55M77_162 39,5 CMCTN38 70,7 E38M48_289 81,7 VI 38 CMGAN3 0,0 ECM109 17,4 H36M41_142 19,9 E43M44_425 26,6 E43M44_229 41,2 H36M37_130 44,7 E42M43_80 48,5 E42M35_225 63,4 E38M43_95 74,9 ECM213 83,6 CMBR123 92,3 V CMTC168 0,0 CMTCN6 3,9 E42M31_237 23,8 E38M43_342 44,2 E38M43_116 65,5 E46M40_160 E46M40_159 70,2 GA5-800/NBS2_135 E46M40_138 E46M48_336 E46M56_338 72,0 CMBR104 73,1 GA5-800/NBS2_127 76,7 E33M40_360 76,9 E40M56_100 91,4 E43M44_272 93,2 H36M37_100 105,1 E46M35_550 109,4 E43M44_298 116,0 E42M43_160 133,3 E35M35_110 146,7 E43M44_300 155,8 Pm-x1.5 Pm-x3 E35M35_130 E38M48_478 0,0 TJ10 16,4 CMCTN5 43,9 H33M43_221 58,2 CMBR105 CMTA170 68,4 E46M48_174 71,1 CMTCN66E46M56_165 E33M40_125 73,8 em3/NBS5_363 E42M35_229 E35M35_160 77,8 CSWCT10 83,5 em3/NBS45-8_340 86,8 E40M51_211 90,1 E40M56_414 101,3 E38M48_168 108,6 E42M51_211 117,0 em3/NBS46-7_174 122,1 III Pm-x1.5 0,0 H35M75_156 1,3 Pm-x3 5,1 CMBR41 23,3 CMBR120 32,6 H35M75_162 39,0 CMMS3_2 76,5 E42M35_140 85,9 CMN08_40 86,9 ECM71 96,3 E42M51_339TJ24 101,0 CMAGN68 102,2 H36M41_160 102,9 E42M31_293 H36M41_175 E43M44_214 104,7 E42M51_333 109,4 E35M35_140 109,5 H36M42_80 126,8 II H36M42_140 0,0 E40M56_522 11,3 TJ27 25,8 H36M42_351 36,6 H36M42_350 38,0 CMMS4_3 48,7 E46M40_330 51,3 E46M40_320 51,9 E46M40_450 E42M31_249 61,4 GA3-800/NBS-3_345 64,8 E46M56_443 65,0 E40M56_215 83,1 H55M77_225 85,5 E42M43_60 104,3 E42M35_410 125,3 E46M48_300 128,2 CMCTN86GA5-800/NBS5_177 131,7 E43M44_100 133,4 H45M77_227 135,4 GA5-800/NBS5_160 137,1 E42M35_409 154,3 H33M43_167 170,9 Pm-x1.5 Pm-x3
The number of markers per group ranged from nine (group XII) to 24 (group I). The mean LG length was 122.4 cM, ranging from 69.8 cM (group IX) to 170.9 cM (group I). The average distance between markers per LG ranged from 4.3 cM (group VI) to 11.0 cM (group XII), and the largest interval between markers was 37.5 cM (group II). AFLP markers were mapped in all LG, whereas TRAP loci were mapped in eight LG.
The reaction of F2 plants to P. xanthii, when scored as a phenotypic marker, co-segregated with molecular mark-ers from LG II, indicating the likely position of resistance genes to races 1, 3, and 5. This LG comprises 11 AFLP, seven microsatellites and no TRAP markers. Genes were located at the extremity of LG, with the one conferring resistance to races 1 and 5, being the most distal, and 5.1 cM apart from the one, conferring resistance to race 3. Dominant AFLP marker H35M75_156, which amplified a fragment from the susceptible parent Védrantais in all four recombinant plants, was located between the resistance genes (Figure 1).
Regardless of the mode of inheritance of resistance to the three races in PI 414723, co-segregation analysis of the qualitative disease phenotypes of F2 plants with molecular markers mapped both Pm-x1,5 and Pm-x3 in LG II. The number of LGs of the map corresponds to the basic chromosome number of melon (x = 12), and the average distance between markers (7.4 cM) is within the values reported in other maps, which ranged from 2.5 cM (Périn et al. 2002) to 17.7 cM (Baudracco-Arnas and Pitrat 1996). If the digenic model is assumed, then these mapped genes correspond to the dominant loci since during link-age analysis with markers most of F2 plants classified as resistant (12/13) would present the marker genotype A_, whereas the susceptible would present the marker genotype
aa. The exception would be the double recessive plants for the resistance genes (aabb) which would present aa
susceptible marker genotype despite being resistant, due to the epistatic interaction with bb alleles. The misclassification
of these individuals, of which expected frequency is low (1/13), would be interpreted as a recombination between markers and genes, thus resulting in an overestimation of genetic distances.
Besides Pm-x1,5 and Pm-x3, other disease resistance genes from PI414723 have been located directly or in-directly in LGII. These include Zym (also Zym-1) for resistance to pathotype 0 of Zucchini yellow mosaic virus, Pm-x for resistance to race 2-French of P. xanthii (Périn et al. 2002), and Wmr for resistance to Watermelon mosaic
virus-2 (Gilbert et al. 1994). While Zym was directly
mapped in the terminal portion of LGII by segregation
analysis of a recombinant inbred population derived from the same cross used in this study, the location of Pm-x was presumed based on an earlier report of its linkage (7 cM) to Zym (Pitrat 1991). By the same reasoning, since Wmr
was reported to be linked (7.5 cM) to Zym (Anagnostou et al. 2000) it must also be located in this linkage group. Taken together, these data suggest a cluster of resistance genes involving Zym, Pm-x and Wmr. However, due to a lack of common markers between the maps of Périn et al. (2002), and the one reported in this study, it is difficult to ascertain at this point whether Pm-x1,5 and Pm-x3 are part of this gene cluster or not. For this, a saturation of this linkage group with additional markers would be necessary. It is interesting to note that a resistance QTL to races 1 and N1 of P. xanthii from a different resistance source (AR-5) was found closely linked to the microsatellite loci CMBR8 and CMBR120 from LGII (Fukino et al. 2008). The first marker was not mapped in the present study since it was monomorphic between the parents, but the second was located 32.6 cM from Pm-x1.5, and 27.5 cM from Pm-x3, initially suggesting that QTL is located in a distinct portion of LG and, therefore, do not correspond to neither of these two genes. However, this conclusion needs further testing, given that the accurate location of QTLs depends largely on the density of markers and that LGII assembled by Fukino et al. (2008) is comprised of only eight markers distributed in two unlinked sub-groups. P. xanthii resistance genes from other melon genotypes were located in linkage groups distinct from the one where the resistance genes from PI 414723 have been located in this study. These include Pm-1 from PI 78374 (race 1) in linkage
group IX (Teixeira et al. 2008), Pm-w from WMR-29 (race 2-French) in LG V, and Pm-y from VA-435 (race 2-French)
in LG XII (Pitrat 1991, Périn et al. 2002). Besides, resistance QTL were also mapped in LGs II (races 1, 3, and N1), V (1, 2, and 5), and XII (races 1, 5, and N1) (Perchepied et al. 2005, Fukino et al. 2008, Yuste-Lisbona et al. 2011b). Thus, the diversity of resistance genes to different races of P. xanthii opens the possibility of combining them in single melon genotypes in order to achieve resistance to multiple races. For this, precise knowledge of their genetic loca-tion combined with linked molecular markers comprises indispensable information in the breeding of these so called gene pyramids.
ACKNOWLEDGMENTS
Mapeamento de genes de resistência às raças 1, 3 e 5 de
Podosphaera xanthii
em
melão PI 414723
Resumo – O fungo Podosphaera xanthii afeta a cultura do meloeiro, apresenta diversas raças e é controlado por genes de resistência raça-específica. O acesso PI414723 é resistente às raças 1, 3 e 5 e é uma fonte adequada de genes de resistência. A herança da resistên -cia a essas raças foi analisada em 87 plantas F2 do cruzamento PI414723 × Védrantais. A resistência às três raças pode ser explicada pela segregação de um gene dominante, embora um modelo digênico também possa ser aceito. Um mapa genético foi obtido com 206 marcadores e análise de co-segregação de fenótipos resistentes indicou a existência de dois locos ligados, posicionados no grupo de ligação II, um conferindo resistência às raças 1 e 5 (denominado Pm-x1,5) e o segundo à raça 3 (denominado Pm-x3), localizado a 5,1cM. Este estudo relata pela primeira vez a existência de Pm-x3 e as localizações genéticas desses genes de resistência de PI414723.
Palavras-chave: Resistência à doença, marcador molecular, mapeamento genético, oídio.
REFERENCES
Agra FNP (2011) Melon. In Agriculture in Brazil yearbook 2011: Brazil agrianual. Informa Economics FNP, São Paulo, p. 355-358. Anagnostou K, Jahn M and Perl-Treves R (2000) Inheritance and linkage
analysis of resistance to Zucchini yellow mosaic virus, Watermelon mosaic virus, Papaya ringspot virus and powdery mildew in melon.
Euphytica116: 265-270.
Barker K (2005) At the bench: a laboratory navigator. Cold Spring Harbor Laboratory Press, New York, 465p.
Baudracco-Arnas S and Pitrat M (1996) A genetic map of melon (Cucumis melo L.) with RFLP, RAPD, isozyme, disease resistance and morphological markers. Theoretical and Applied Genetics 93: 57-64.
Brotman Y, Silberstein L, Kovalski I, Périn C, Dogimont C, Pitrat M, Klingler J, Thompson GA and Perl-Treves R (2002) Resistance gene homologues in melon are linked to genetic loci conferring disease and pest resistance. Theoretical and Applied Genetics104: 1055-1063. Creste S, Tulmann Neto A and Figueira A (2001) Detection of single
sequence repeat polymorphisms in denaturing polyacrilamide sequencing gels by silver staining. Plant Molecular Biology Reporter19: 299-306.
Epinat C, Pitrat M and Bertrand F (1993) Genetic analysis of resistance
of five melon lines to powdery mildews. Euphytica 65: 135-144.
Fukino N, Ohara T, Monforte A, Sugiyama M, Sakata Y, Kunihisa M
and Matsumoto S. (2008) Identification of QTLs for resistance to
powdery mildew and SSR markers diagnostic for powdery mildew resistance genes in melon (Cucumis melo L.). Theoretical and Applied Genetics118: 165-175.
Gilbert RZ, Kyle MM, Munger HM and Gray SM (1994) Inheritance of resistance to watermelon mosaic virus in Cucumis melo L.
HortScience29: 107-110.
Gonzalo MJ, Oliver M, Garcia-Mas J, Monfort A, Dolcet-Sanjuan R, Katzir N, Arús P and Monforte AJ (2005) Simple-sequence repeat markers used in merging linkage maps of melon (Cucumis melo L.).
Theoretical and Applied Genetics110: 802-811.
Hu J and Vick BA (2003) Target region amplification polymorphism:
a novel marker technique for plant genotyping. Plant Molecular
Biology Reporter21: 289-294.
Jahn M, Munger HM and McCreight JD (2002) Breeding cucurbit crops for powdery mildew resistance. In Bélanger RR, Bushnell WR, Dik AJ and Carver LW (eds.) The Powdery mildews: a comprehensive treatise. The American Phytopathological Society, Saint Paul, p. 239-248.
Kenigsbuch D and Cohen Y (1992) Inheritance and allelism of genes for resistance to races 1 and 2 of Sphaerotheca fuliginea in muskmelon.
Plant Disease76: 626-629.
Kobori RF, Suzuki O, Wierzbicki R, Vecchia PTD and Camargo LEA
(2004) Occurrence of Podosphaera xanthii race 2 on Cucumis melo
in Brazil. Plant Disease88: 1161.
Lander ES, Green P, Abrahamson J, Barlow A, Daley M, Lincoln S and
Newburg L (1987) MAPMAKER: an interactive computer package
for constructing primary genetic linkage maps of experimental and natural population. Genomics1:174-181.
Li G and Quiros CF (2001) Sequence-related amplified polymorphism
(SRAP), a new marker system based on a simple PCR reaction: its application to mapping and gene tagging in Brassica. Theoretical and Applied Genetics103: 455-461.
Liu LZ, Chen YY, Su ZH, Zhang H and Zhu W (2010) A
Sequence-amplified characterized region marker for a single, dominant gene
in melon PI 134198 that confers resistance to a unique race of
Podosphaera xanthii in China. HortScience 45: 1407-1410.
McCreight JD (2006) Melon-powdery mildew interactions reveal variation in melon cultigens and Podosphaera xanthii races 1 and 2. Journal of the American Society for Horticultural Science131: 59-65.
McCreight JD, Pitrat M, Thomas CE, Kishaba AN and Bohn GW (1987)
Powdery mildew resistance genes in muskmelon. Journal of the American Society for Horticultural Science112: 156-160. Nicot PC, Bardin M and Dik AJ (2002) Basic methods for epidemiological
studies of powdery mildew: culture and preservation of isolates, production and delivery of inoculum, and disease assessment. In Bélanger RR, Bushnell WR, Dik AJ and Carver LW (eds.) The Powdery mildews: a comprehensive treatise. The American Phytopathological Society, Saint Paul, p. 83-99.
between loci conferring downy mildew and powdery mildew resistance in melon assessed by quantitative trait loci mapping.
Phytopathology95: 556-565.
Périn C, Hagen LS, De Conto V, Katzir N, Danin-Poleg Y, Portnoy V,
Baudracco-Arnas S, Chadoeuf J, Dogimont C and Pitrat M (2002) A reference map of Cucumis melo based on two recombinant inbred lines populations. Theoretical and Applied Genetics104: 1017-1034.
Pitrat M (1991) Linkage groups in Cucumis melo L. Journal of Heredity 82: 406-411.
Pitrat M (2006) 2006 Gene list for melon. Cucurbit Genetics Cooperative Reporter28-29: 142-163.
Pitrat M, Dogimont C and Bardin M (1998) Resistance to fungal diseases of foliage in melon. In McCreight JD (ed.) Cucurbitaceae ‘98: Evaluation and enhancement of cucurbit germplasm. ASHS Press,
Alexandria, p. 167-173.
Reifschneider FJB, Boiteux LS and Occhiena EM (1985) Powdery mildew of melon (Cucumis melo) caused by Sphaerotheca fuliginea in Brazil.
Plant Disease69: 1069-1070.
Reis A and Buso JA (2004) Levantamento preliminar de raças de
Sphaerotheca fuliginea no Brasil. Horticultura Brasileira22: 462-465.
Shishkoff N (2000) The name of the cucurbit powdery mildew:
Podosphaera (sect. Sphaerotheca) xanthii (Castag.) U. Braun & N. Shish. comb. nov. Phytopathology90: S133.
Teixeira APM and Camargo LEA (2006) A molecular marker linked to
the Prv1 gene that confers resistance to Papaya ringspot virus-type
W in melon. Plant Breeding125: 187-190.
Teixeira APM, Silva-Barreto FA and Camargo LEA (2008) An AFLP marker linked to the Pm-1 gene that confers resistance to Podosphaera xanthii race 1 in Cucumis melo. Genetics and Molecular Biology 31: 547-550.
Thomas CE (1978) A new biological race of powdery mildew of
cantaloupe. Cucurbit Genetics Cooperative Reporter 62: 223.
Voorrips RE (2002) MapChart: software for the graphical presentation of
linkage maps and QTLs. Journal of Heredity93: 77-78.
Vos P, Hogers R, Bleeker M, Reijans M, Van De Lee T, Hornes M, Friters
A, Pot J, Paleman J, Kuiper M and Zabeau M (1995) AFLP: a new
technique for DNA fingerprinting. Nucleic Acids Research23:
4407-4414.
Yuste-Lisbona FJ, López-Sesé AI and Gómez-Guillamón ML (2010) Inheritance of resistance to races 1, 2 and 5 of powdery mildew in the melon TGR-1551. Plant Breeding129: 72-75.
Yuste-Lisbona FJ, Capel C, Gómez-Guillamón ML, Capel J, López-Sesé AI and Lozano R (2011a) Codominant PCR-based markers and candidate genes for powdery mildew resistance in melon (Cucumis melo L.). Theoretical and Applied Genetics122: 747-758.