FUNDAÇÃO GETULIO VARGAS
ESCOLA BRASILEIRA DE ADMINISTRAÇÃO PÚBLICA E DE EMPRESAS
DOUTORADO EM ADMINISTRAÇÃO
ESSAYS ON FINANCIAL DECISION MAKING BY
FIRMS AND INDIVIDUALS
Rodrigo de Oliveira Leite
Rio de Janeiro – 2018
T
ESE APRESENTADA ÀE
SCOLAB
RASILEIRA DEA
DMINISTRAÇÃOP
ÚBLICA E DEEssays on Financial Decision Making by
Firms and Individuals
by
RODRIGO DE OLIVEIRA LEITE
Brazilian School of Public and Business Administration FUNDAÇÃO GETULIOVARGAS
A thesis submitted to the Brazilian School of Public and Busi-ness Administration in accordance with the requirements of the degree of PHDINADMINISTRATION.
A
CKNOWLEDGEMENTSI
would like to thank the Fundação Getulio Vargas and CAPES for their financial support so important for me during my PhD. I would also acknowledge my advisor Prof. Fabio Caldiraro, that guided me during my PhD. Additionally, I am grateful to all committee members that helped the thesis development with their time and insightful comments.I thank my family (father, mother and sister) for their assistance ans support. I also am very grateful for my friends, inclding Juliana Queiroz, Layla Mendes, Ana Jelihovschi, Luiz Sacramento, Jamil Civitarese and Matheus Moura.
I also acknowledge the Department of Accounting Rio de Janeiro State University that was so kind in change my schedule so that I could proceed with the PhD program.
R
ESUMOE
sta tese é dividida em seis capítulos. O primeiro capítulo é uma introdua¸ão em que apre-sentamos os principais conceitos e resultados da presente tese.No segundo capítulo mostramos que os analistas financeiros percebem a informação mais facilmente quando divulgada em gráficos quando comparadas aos textos, no entanto, este não é o caso para a mesma informação divulgada em tabelas. Além disso, os analistas financeiros com excesso de confiança tiveram um desempenho pior na avaliação das informações divulgadas no texto, tabela e gráficos.
No terceiro capítulo, mostramos que a impulsividade de um analista financeiro pode ter um impacto sobre a eficácia das técnicas de impression management.
No próximo capítulo, mostramos que o fato de uma instituição de microfinanças ser com ou sem fins lucrativos muda seus incentivos para usar técnicas de gerenciamento de resultados em seus relatórios financeiros. Assim, as instituições financeiras com fins lucrativos têm mais incentivos para gerenciar seus resultados devido ao fato de que existe uma pressão dos acionistas por desempenho.
No quinto capítulo mostramos por que os bancos oferecem período de carência de empréstimo em um ambiente de seleção adversa. A introdução de períodos de carência para empréstimos torna a seleção de triagem mais eficiente, reduzindo assim os riscos, e os bancos podem oferecer empréstimos em maior volume.
A
BSTRACTT
his thesis is divided into six chapters. The first chapter is an introductory chapter in which we introduce the main concepts and results from this present thesis.In the second chapter we show that financial analysts perceive information more easily when disclosed in graphs when compared to textual disclosure, however, this is not the case for the same information disclosed in tables. Moreover, overconfident financial analysts had a worse performance on assessing the information disclosed on text, table, and graphs.
In the third chapter we show that the impulsiveness of a financial analyst can impact the efficacy of impression management techniques used by firms in their graphical disclosure of financial information.
In the forth chapter we show that the profit status of a microfinance institution changes its incentives to use earnings management techniques on their financial reports. Hence for-profit financial institutions have more incentives to manage its earnings due to shareholder pressure for performance. In the fifth chapter we show why banks offer loan grace period in an adverse selection environment. The introduction of loan grace periods make the screening selection more efficient, thus reducing risks, and banks can lend more money to firms.
T
ABLE OFC
ONTENTSPage
List of Tables xv
List of Figures xvii
1 Introduction 1
2 A Graph is Worth a Thousand Words: how overconfidence and graphical dis-closure of numerical information influence financial analysts’ accuracy on
decision making 5
2.1 Introduction to Chapter 2 . . . 5
2.2 Literature Review and Hypotheses Development . . . 9
2.3 Methodological Approach . . . 11
2.3.1 Data collection and experiment design . . . 11
2.3.2 Randomization test . . . 13
2.4 Results . . . 14
2.5 Discussion and Concluding Remarks . . . 18
3 The Effect of Cognitive Reflection on the Efficacy of Impression Management: an experimental analysis with financial analysts 23 3.1 Introduction to Chapter 3 . . . 23
3.2 Literature review and hypothesis development . . . 25
3.2.1 The effect of colors . . . 26
3.2.3 Cognitive reflection ability . . . 30
3.3 Sample and Procedures . . . 32
3.3.1 Randomization Test . . . 33
3.3.2 Data analysis criteria . . . 33
3.4 The experiments . . . 34
3.4.1 Experiment 1 . . . 35
3.4.2 Experiment 2: measurement distortion . . . 40
3.4.3 Results . . . 41
3.4.4 Experiment 3: selectivity . . . 42
3.4.5 Results . . . 43
3.5 Additional estimations . . . 45
3.5.1 Sample representativeness . . . 45
3.5.2 Alternative specification for impulsiveness . . . 46
3.5.3 Concluding remarks . . . 47
4 Profit Status of Microfinance Institutions and Incentives for Earnings Man-agement 51 4.1 Introduction to Chapter 4 . . . 51 4.2 Literature Review . . . 52 4.2.1 Microfinance Institutions . . . 52 4.2.2 Earnings Management . . . 53 4.3 Theoretical Foundation . . . 55 4.4 Empirical Approach . . . 56 4.5 Results . . . 58 4.5.1 Main Results . . . 58 4.5.2 Matching analysis . . . 59
4.5.3 Addressing an alternative explanation . . . 60
4.6 Robustness: Using exogenous sources of distress . . . 61
TABLE OF CONTENTS
4.6.2 The 2008 Financial Crisis as an Exogenous Shock . . . 62
4.7 Conclusion . . . 65
5 Grace Periods Offers in Loan Contracts under Adverse Selection 69 5.1 Introduction to Chapter 5 . . . 69
5.2 Baseline model . . . 71
5.2.1 Model description . . . 71
5.2.2 First and Second Best Solutions . . . 72
5.3 Optimal contracts under certain behavior . . . 73
5.3.1 Case 1: Slacking firm . . . 74
5.3.2 Case 2: Productive firm . . . 75
5.4 Optimal contracts under uncertain behavior . . . 77
5.4.1 Case 3a: Type-independent uncertainty . . . 77
5.4.2 Case 3b: Type-dependent Uncertainty . . . 79
5.5 Discussion of Solutions . . . 80
5.6 Conclusion . . . 81
6 Conclusion 91
L
IST OFT
ABLESTABLE Page
2.1 Descriptive statistics and correlations . . . 12
2.2 Correct answers as a function of overconfidence, disclosure type and gender (Results from H1A, H1B and H2) . . . 16
2.3 Number of correct answers by overconfidence (Results from H2) . . . 17
2.4 Results from H4 . . . 18
2.5 Summary of evidences . . . 22
3.1 Randomization tests for the three experiments . . . 34
3.2 Descriptive statistics . . . 35
3.3 OLS results for experiments 1, 2 and 3 . . . 39
3.4 Hypotheses summary . . . 44
3.5 Results from one-sample t-test comparing the CRT scores from our sample with the CRT scores from other samples . . . 45
3.6 Effect of each reflectivity subgroup on each experiment . . . 47
4.1 Summary Statistics . . . 58
4.2 Main Results . . . 59
4.3 Results from matching estimations . . . 60
4.4 Results from additional estimations . . . 61
4.5 Results from estimations using DGDP,tas an instrument . . . 62
4.6 Robustness: Main Results . . . 64
L
IST OFF
IGURESFIGURE Page
2.1 Improvement on accuracy of graphs and table versus text . . . 15
3.1 Experiment 1 conditions . . . 36
3.2 Rating results for experiment 1 . . . 38
3.3 Experiment 2 conditions . . . 40
3.4 Rating results from experiment 2 . . . 41
3.5 Experiment 3 conditions . . . 42
3.6 Rating results from experiment 3 . . . 43
4.1 Theoretical Expectation . . . 57
4.2 Ratio of countries in database that were in recession for each year . . . 63
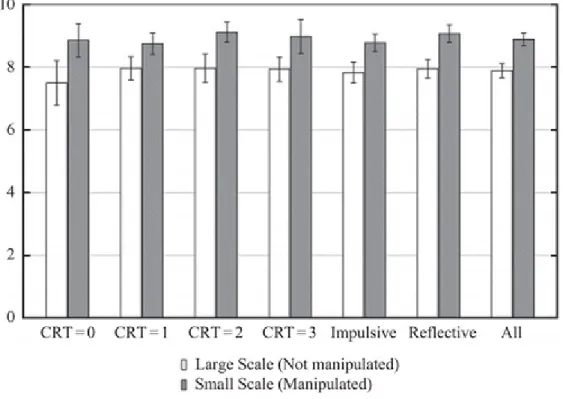
4.3 Impairment provisions (FP vs. NFP MFIs) 2001-2011 . . . 63
C
H A P T E R1
I
NTRODUCTIONT
he focus of the present thesis is the financial decision making of both firms and individ-uals. The following four studies will deal with research questions regarding how some intrinsic characteristics of individuals may or may not influence their decision making in financial situations, how the structure of a financial institution, specifically microfinance ones, can change the incentives to disclose and account for losses, and also why do banks offer loan grace periods to companies, even when there is no prior information about the borrower.There is a clear distinction in the present work: the first two chapters deal with individuals, while the last two chapters deal with institutions. The chapters reflect my work in the Doctoral program, and that a few of these chapters were transformed in individual articles.
Moreover, there is evidence showing that, although when an individual is making a decision s/he is affected by several irrational biases, group decision making is often (more) rational (Bornstein and Yaniv, 1998). Hence, in this present thesis, while we deal with the individual decision maker in a more irrational setting of assumptions, we study the decision making by firms we adopt a more rational scenario, since this is what is expected in practice.
In the second chapter of the thesis we conducted a 4×2 mixed-design experiment to examine the effects of numerical information disclosure on financial analysts’ accuracy, and investigated the role of overconfidence in decision making. Results show that compared to text, column
graph enhanced accuracy on decision making, followed by line graphs. No difference was found between table and textual disclosure. Overconfidence harmed accuracy, and both genders behaved overconfidently. Additionally, the type of disclosure (text, table, line graph and column graph) did not affect the overconfidence of individuals, providing evidence that overconfidence is a personal trait. This study makes three contributions. First, it provides evidence from a larger sample size (295) of financial analysts instead of a smaller sample size of students that graphs are relevant decision aids to tasks related to the interpretation of numerical information. Second, it uses the text as a baseline comparison to test how different ways of information disclosure (line and column graphs, and tables) can enhance understandability of information. Third, it brings an internal factor to this process: overconfidence, a personal trait that harms the decision-making process of individuals. At the end of this paper several research paths are highlighted to further study the effect of internal factors (personal traits) on financial analysts’ accuracy on decision making regarding numerical information presented in a graphical form. In addition, we offer suggestions concerning some practical implications for professional accountants, auditors, financial analysts and standard setters.
The purpose of this third chapter is to investigate whether analysts’ personal cognitive traits mitigate the efficacy of graphical impression management. Research on impression management is mostly “task-oriented;” few “people-oriented” studies focus on decision making by those using financial reports. Users’ cognitive reflection ability is shown to undermine the efficacy of some impression management techniques. Three experiments are conducted wherein 525 professional accountants working as financial analysts rate a hypothetical company’s performance graph depicting its net income trend. The manipulation is the presence (absence) of impression man-agement techniques. Hypotheses test whether different techniques are effective and whether analysts’ cognitive reflection ability mitigates manipulation efficacy. Presentation enhancement is effective only with impulsive analysts, showing the weakness of this technique through the use of colors. Measurement distortion and selectivity techniques are effective for reflective and impulsive analysts; however, reflective analysts are more critical about graphs prepared via selectivity that emphasize profit recovery following crises.
in-centives to manage its earnings when compared to for-profit ones. This serves a gap in the microfinance literature which has not yet provided evidence of the incentives for earnings man-agement in those institutions. Using a simple theoretical model, we theorize that for-profit microfinance institutions (MFIs) tend to have higher incentives to use earnings management techniques when compared to their not-for-profit counterparts. We show empirically that, when facing a distress period, for-profit MFIs recognize more impairment losses provisions then not-for-profit ones in about 0.8% of its assets. This is consistent with the idea that those institutions are using “big bath" accounting practices. We also address a possible alternative explanation, since we present evidence that distress levels do not differently affect the ability of loan repayment depending on the profit status of the MFI. Lastly, using both recession shocks to the MFIs and the 2008 crisis as an exogenous shock, we replicate our results.
Finally, the fifth chapter goal is to answer why do banks offer loan grace periods to companies, even when there is no prior information about the borrower. Such periods are interest free and one may see as a pure cost to lenders. However, we show that, by offering a loan grace period, a lender can increase its profits and also the optimal amount lent to firms. We show that the offer of a loan grace period, although counterintuitive ex-post, makes the bank increase its profits by changing the contract ex-ante. This result can be understood as a risk reduction of the loans due to a more efficient screening process, what in turn makes the increased loan amounts possible. Hence, we show that the offer of loan grace periods can be optimal even outside of “relationship banking” strategies, in what may explain why in microfinance, where there is a large information asymmetry between lenders and borrowers, the use of loan grace periods are pervasive.
In the last chapter vwe present our conclsuions.
All relevant results are presented in each chapter, as well the appendices to each chapter. All references are presented at the end of the thesis.
C
H A P T E R2
A G
RAPH ISW
ORTH AT
HOUSANDW
ORDS:
HOW OVERCONFIDENCEAND GRAPHICAL DISCLOSURE OF NUMERICAL INFORMATION
INFLUENCE FINANCIAL ANALYSTS
’
ACCURACY ON DECISIONMAKING
2.1
Introduction to Chapter 2
T
he study of interpretation of graphical information by accountants is not something new. Literature suggests that graphs can aid in the communication of accounting infor-mation (Beattie and Jones, 1992). Indeed graphs are shown to improve understanding of information and accuracy of forecast judgments (DeSanctis and Jarvenpaa, 1989). Multidimen-sional graphs are also shown to improve judgment and decision-making processes (Moriarity, 1979).However, not every way of presenting information has the same effect on users of accounting information. Kloptchenko et al. (2004) notices that it is difficult to extract meaning from textual disclosure. Vessey (1991) argued that spatial information is better represented with graphs, while symbolic information is better represented with tables. (Peterson, 1983) investigated the relationship of readers’ retention, reaction and reading time with four different presentation
ANALYSTS’ ACCURACY ON DECISION MAKING
methods (narrative only, narrative with the aid of tables, narrative with the aid of graphs, and narrative with the aid of tables and graphs). Based on a sample of 625 students, Peterson identified that narrative with the aid of tables helps readers’ retention most, followed by narrative with the aid of graphs, then narrative with the aid of tables and graphs. Male students preferred narrative with the aid of graphs, and female students preferred narrative with the aid of tables. Concerning reading time, students took the least amount of time to read the report if they were reading narrative with the aid of tables; the method that took the longest to read was narrative only. Ten years after Peterson’s research, (Kelly, 1993) investigated the effects of display format (text, tables and column graphs) and data density on time spent reading statistics. Using a sample of 18 journalism undergraduate students, Kelly identified that data format did not affect accuracy. However, display format caused significant effect on time spent; i.e., both tables and graphs were less time-consuming than text. A recent study (Tang et al., 2013) showed that interactivity, visualization and difficulty affects the decision-making process of accountants and financial analysts. However, there is a gap in the literature: no study has analyzed both intrinsic characteristics of the individual and how it affects interpretation of graphic information.
In this study, we examine whether four different types of information disclosure (text, table, line graph and column graph) can help or harm financial analysts’ accuracy on the interpretation of numerical information, and we investigate the role of overconfidence in such decision-making processes.
Our study attempts to provide more relevant evidence for accounting and finance settings than previous studies, once we used a sample comprised by financial analysts instead of students. Secondly, no previous study used textual disclosure (narrative only) as basement measure to provide a comparison between the different types of graphical information disclosure (graph only). Third, we also investigate whether intrinsic characteristics of the individual alter the interpretation of different ways of disclosing information. Previous research (Barcellos et al., 2015) has provided evidence that intrinsic characteristics of an accountant can alter her/his decision-making process. This study will focus on overconfidence, a trait that can be divided into three subtypes: overestimation, overplacement and overprecision (Mannes and Moore, 2013a,b). In this study we use overplacement, which can be described as “the overplacement of one’s
2.1. INTRODUCTION TO CHAPTER 2
performance relative to others” (Moore and Healy, 2008). The “overconfidence trap” can lead to “errors in judgment and, in turn, bad decisions” (Hammond et al., 1998).
Thus, our study aims to assess whether different disclosure practices of numerical information (text, table, column graph and line graph) affect accuracy of financial analysts. Additionally, we investigate whether personal characteristics (overconfidence and gender) also affect their accuracy.
Based on a 4×2 mixed-design experiment, this study provides empirical evidence from 295 professional accountants who work as financial analysts that different ways of disclosing the same information can increase (or decrease) accuracy of judgment and decision making. Specif-ically, information disclosed on column graphs are significantly more correctly interpreted by financial analysts than textual disclosure, followed by line graphs. There was no difference in accuracy when respondents analyzed tables or text. Regarding overplacement, we identified that overconfident financial analysts presented more wrong answers (and less correct answers) than non-overconfident financial analysts, regardless of the type of information disclosure and of respondent’s gender.
The study of graph interpretation ability by accountants and financial analysts is relevant in the accounting context because most modern annual reports contain graphs. For example, the International Accounting Standards Board (IASB) recently amended the International Financial Reporting Standard 7 (IFRS 7)–Financial Instruments: Disclosures requiring that “if the quantitative data disclosed as at the end of the reporting period are unrepresentative of an entity’s exposure to risk during the period, an entity shall provide further information that is representative” (IFRS 7, par. 35). If this is the case, then implementation guidance exhorts the presentation of graphs: “[. . . ] if an entity typically has a large exposure to a particular currency, but at year-end unwinds the position, the entity might disclose a graph that shows the exposure at various times during the period [. . . ]” (IFRS 7, par. IG20).
In fact, because standard-setters urge entities to present graphs in the notes, the use of graphs in financial reporting might increase significantly. Therefore, knowledge of individuals’ ability to interpret graphs and the impact of their personal characteristics in performing such a task becomes very important for preparers and auditors of financial reports, financial
ana-ANALYSTS’ ACCURACY ON DECISION MAKING
lysts, standard-setters and accounting professors, and it may enhance impression management literature in many venues.
Additionally, impression management literature suggests that graphs are more vulnerable to manipulation because they are non-audited and not prescribed (Beattie and Jones, 1992, 2000a; Jones, 2011). Three main types of impression management through graphs were investigated in previous researches. These are: selectivity (i.e., occurs when a company deliberately chooses graphs so that they will convey a favorable impression of the company); measurement distortion (i.e., the figures on the graphs do not accurately represent the underlying financial data); and presentational enhancement (i.e., graphs are constructed so as to emphasize certain design features) (Beattie and Jones, 1992, 1993, 2000a,b; Jones, 2011; Arunachalam et al., 2002).
For example, Beattie and Jones (Beattie and Jones, 1992) analyzed annual reports from 1989 of 240 U.K. listed companies and identified that 79% of them used graphs, and the majority were column graphs (64%). In addition to the usage of graphs, they identified that the presence (absence) of graph is associated with a positive (negative) trend on corporation’s performance. Regarding distortion, they identified that in 73% of the cases material discrepancies were identified, i.e., graphical trends were exaggerated rather than understated.
Later, Beattie and Jones (2000b) extended such analysis for a sample of 300 domestically-listed only enterprises in France, Germany, Australia, the Netherlands, the U.K., and the U.S., over a 5-years period ending on 1992. They identified that the graphs are often used to enhance the perception of good news.
Knowledge of individuals’ ability to interpret information represented in many different forms (e.g., text, table, line graph, and column graph) may enhance impression management literature in many venues. For example, the selectivity type of impression management could be investigated in depth and far beyond the traditional approach (Jones, 2011; Penrose, 2008). For instance, selectivity could also be investigated as the choice of the graph format (e.g., line, column or pie chart), or presenting a table or only text (narrative) instead of a graph.
The remaining sections of this paper are organized as follows; the next section presents literature review and hypotheses development. Section 2.2 describes the experiment design, data collection process and methods to test hypotheses. Section 2.3 presents and discusses the
2.2. LITERATURE REVIEW AND HYPOTHESES DEVELOPMENT
results for each hypothesis. Finally, section 2.4 presents final remarks and suggestions for further research.
2.2
Literature Review and Hypotheses Development
Different types of accounting information disclosure by companies are shown to change the decision-making process of both financial analysts (Ghosh and Wu, 2012) and investors (Dilla et al., 2012). It also affects the confidence interval of forecasts (Lawrence and O’Connor, 1993). In an experiment with undergraduate students, Beattie and Jones (Beattie and Jones, 2002) showed that students perceived a company whose graphs had received a measurement distortion as better than the same company if such graphs had not been distorted. The same conclusion was achieved by Arunachalam et al. (2002), with a total sample of 126 students across three experiments. In addition, companies that face poor performance use different disclosure techniques in order to manipulate the market’s perception of their performance (Clatworthy and Jones, 2006).
Different ways of presenting financial information are shown to influence the accuracy of decision making on different accounting tasks (Tang et al., 2013; Davis, 1989). Both researches use experimental empirical evidence to reach the same conclusion as Vessey’s (Vessey, 1991): different types of information disclosure have different effects in understanding performance in different situations. Only two papers compare textual with graphical disclosure: Peterson (1983) and Kelly (1993), but under different methodological approaches. Our research differs from Peterson’s in the following perspectives: (i) we compared the effect of four different presentation formats (text/narrative only, table only, column graph only and line graph only) individually. On the other hand, Peterson compared text/narrative only with text/narrative with the aid of tables, or graphs, or tables and graphs. (ii) We analyzed the effects of two different graph formats (column and line), but Peterson did not explicit which format of graph he presented to subjects. (iii) We measured the effect in terms of correct answers (accuracy as dependent variable), Peterson did not measure accuracy, instead she measured three dependent variables: retention (memory), reaction (preference concerning visual appeal) and time spent on performing the task. On the other hand, our research differs from Kelly’s in the following perspectives: (i) we did not
ANALYSTS’ ACCURACY ON DECISION MAKING
investigate time consumption or another measure of efficiency, but only accuracy (a measure of effectiveness) – we did so because we collected data through a web-based questionnaire (not in a laboratory environment), hence we could not presume that respondents were not performing alternative tasks at the same time and that concurrent visual stimuli were minimal. (ii) The only graphical format manipulated by Kelly was column graph, and we manipulated two formats, column graph and line graph.
Based on results provided by previous literature (Peterson, 1983; Kelly, 1993; Beattie and Jones, 2002) we propose that different forms of information disclosure (text, table, column graph and line graph) differently affect informational perception and accuracy on decision making of financial analysts. Hence, numerical information disclosed on tables or graphs might enhance accuracy, as follows:
H1A: Numerical information disclosed on tables enhances accuracy when compared to text
(narrative) only disclosure.
H1B: Numerical information disclosed on graphs enhances accuracy when compared to text
(narrative) only disclosure.
We do not propose any hypothesis on comparisons between tables and graphs, nor between column graphs and line graphs, because of the lack of previous evidence or any reasonable argument about this in previous literature.
There is empirical evidence that overconfident individuals will commit more errors, and that gender has a role in this intrinsic characteristic: males are more overconfident (and commit more errors) than females. Economics undergraduate male students are shown to be more overcon-fident than females (Bengtsson et al., 2005) and male dealers trade with more overconfidence than females (Barber and Odean, 2001). A cross-cultural study in the US, Germany, Italy and Thailand has confirmed that women financial analysts were more risk-averse than male finan-cial analysts (Beckmann and Menkhoff, 2008). In addition, there is experimental evidence for differences in risk aversion and bargaining between males and females, though they are not
2.3. METHODOLOGICAL APPROACH
correlated (García-Gallego et al., 2012). In this study we use the overplacement subdimension of overconfidence, that can be described as “the overplacement of one’s performance relative to others” (Moore and Healy, 2008). As a result, we have postulated the following hypotheses:
H2: Overconfident financial analysts commit more errors than non-overconfident ones.
H3: Male financial analysts are more overconfident than females.
In order to test those hypotheses we applied an online survey experiment using Surveymonkey, as described in the next section. It can be a way to improve both internal validity and external validity (Brandon et al., 2013) since it is a randomized experiment with professional financial analysts who actually use graphs to make decisions on a day-to-day basis.
2.3
Methodological Approach
2.3.1 Data collection and experiment design
Data were collected via an electronic questionnaire applied by the Brazilian Accounting Associa-tion (BAA). In Portuguese, it is called Conselho Federal de Contabilidade (CFC)– www.cfc.org.br. The research proposal of this study was submitted to and approved by the Brazilian Accounting Association Ethics Committee (Comitê de Ética do Conselho Federal de Contabilidade). Hence, the President of the BAA sent an electronic message containing the web link to the questionnaire to professional accountants who were already registered with it in August 2012, inviting them to take part in this research as respondents. All the volunteer respondents agreed to participate in the experiment, and data was collected anonymously. Based on the respondents’ expertise, they were required to answer a specific set of questions. Actually, those who presented themselves as financial analysts were required to answer questions related to graph interpretation. In all, 295 professional accountants whose main duties are related to financial analysis comprise the sample for this research. The sample was randomly classified among four subsamples to which 1 of 4 types of information disclosure was presented conveying the same informational content with
ANALYSTS’ ACCURACY ON DECISION MAKING
regard to the number of people going in and out of a store during a 12 minute time period. In each case, numerical information was preceded by the following description: The following paragraph (text condition) / table (table condition) / graph (line graph and column graph conditions) depicts the number of people going in and out of a store in a 12 minutes time period.
Hence, it is a 4×2 mixed-design experiment (four types of information disclosure between subjects: textual information, table, line graph and column graph; and two questions within subjects: In which minute is there the largest number of people entering the store? and In which minute is there the largest number of people exiting the store?). The subjects were randomly assigned to one of the four types of information presentation with a probability of .40 being assigned to the line graph and a probability of .20 being assigned to one of the other three conditions. We assigned more respondents to the line graph condition because, in previous researches, line graph is less investigated than column graph and table (Beattie and Jones, 1992; Kelly, 1993; Penrose, 2008). Notice that we performed a robustness check with a randomly selected subsample of line graph respondents (i.e., balanced sample) and the results were robust, and significance levels and effects remained similar to the unbalanced sample. Table 2.1 presents data descriptive statistics.
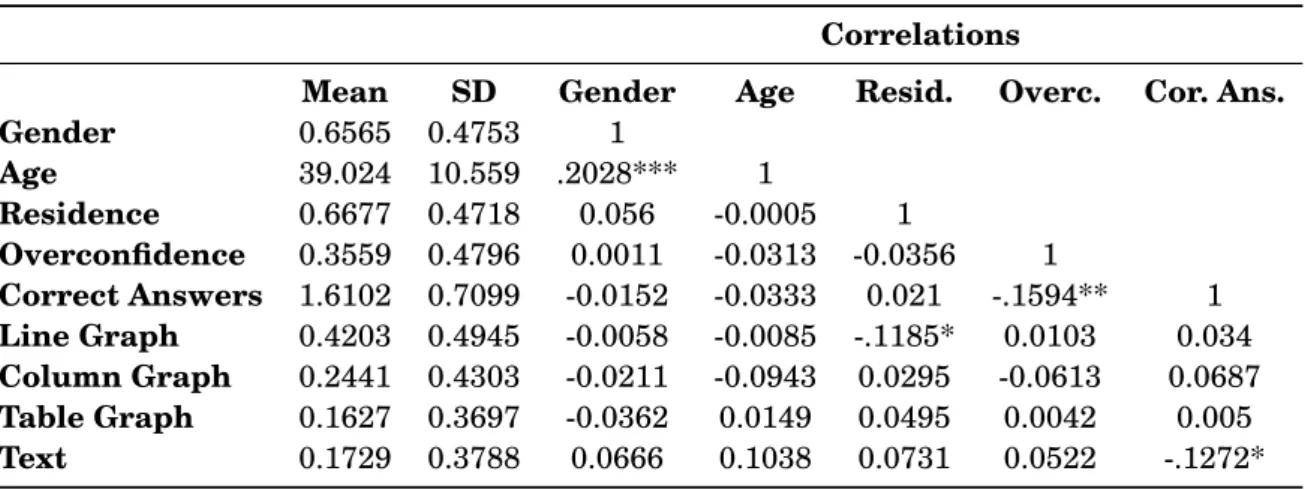
Table 2.1: Descriptive statistics and correlations
Correlations
Mean SD Gender Age Resid. Overc. Cor. Ans.
Gender 0.6565 0.4753 1 Age 39.024 10.559 .2028*** 1 Residence 0.6677 0.4718 0.056 -0.0005 1 Overconfidence 0.3559 0.4796 0.0011 -0.0313 -0.0356 1 Correct Answers 1.6102 0.7099 -0.0152 -0.0333 0.021 -.1594** 1 Line Graph 0.4203 0.4945 -0.0058 -0.0085 -.1185* 0.0103 0.034 Column Graph 0.2441 0.4303 -0.0211 -0.0943 0.0295 -0.0613 0.0687 Table Graph 0.1627 0.3697 -0.0362 0.0149 0.0495 0.0042 0.005 Text 0.1729 0.3788 0.0666 0.1038 0.0731 0.0522 -.1272* *p<.05, **p<.01, ***p<.001.
We excluded the correlations between the four randomized conditions.
We used a “neutral” problem in our experiment to avoid “expert bias” (Hout et al., 2015), which can lead experts to use System 1 (impulsivity) to understand and solve situations which they are
2.3. METHODOLOGICAL APPROACH
familiarized with, while non-experts would need to use System 2 (reflectivity) because they are not familiarized with and do not face the same situations on a daily basis (Kahneman, 2011). The “neutral” task performed in our experiment was interpreting the flow of people entering in and exiting from a store during a short period of time (12 minutes), in four different formats (text, table, line graph and column graph), and explained in the next section.
2.3.2 Randomization test
To test if the randomization of the four types of information presentation worked properly, three chi-squared tests were performed. In the first test, we tested distribution of types of information disclosure regarding the age of participants. In the second test it was regarding their gender. The third test was in reference to the participants’ city of residence (state capital or other). Since age is a continuous variable, it needed to be converted to a discreet variable for the test to be performed. Therefore, age was converted into a categorical variable: Junior (below 31 years), Experienced (between 31 and 47 years) and Senior (above 47 years). We control for age because there could be a bias for more senior analysts. We also control for city of residence because financial analysts living in capitals where large companies are located have more and easier access to training and other opportunities to develop their professional skills than those living in smaller cities. Gender control is important in our study because it is the independent variable analyzed in H3.
After the age variable transformation, a total of three chi-squared tests were performed and the p-values were non-significant (χ2a ge(6) = 5.97, p = .427; χ2gend er(3) = 1.39, p = .707; χ2
resid ence(3) = 4.18, p = .243.), showing that there was no bias of gender, age or place of
resi-dence in the subject’s assignment in each one of the four presentation formats (between subject conditions). This suggests that the randomization worked well and provides evidence that our assignment was not biased.
Due to the fact that the analyzed conditions (i.e., types of information disclosure) were ran-domized in the sample, it eliminates the problem of endogeneity and self-selection, reducing systematic bias significantly. However, there may be a possible confounder in this study regarding overconfidence. Maybe some ways of disclosing numerical information can influence the partic-ipant’s overconfidence causing bias. Aiming to assess whether this was an issue in this study,
ANALYSTS’ ACCURACY ON DECISION MAKING
another chi-squared test was performed and the result was non-significant (χ2(3) = 1.52, p = .678), suggesting that manipulation did not affect the participants’ overconfidence. In addition, this provides more evidence that the randomization process worked well, since there was no meaning-ful difference in the participants’ overconfidence. However, as depicted in Table 2.1, our sample female accountants tended to be older than male accountants (correlation 0.2028, p < .001).
2.4
Results
First, the two questions asked to respondents were grouped in one variable that could assume the value of 0 (no correct answer), 1 (one correct answer) or 2 (both questions answered correctly) for the results to be estimated in one statistical test. Aiming to compare the four experimental conditions and test H1A, H1B and H2, we estimated the following ordered logit model:
Correct =β0+β1Overcon f +β2Line +β3Column +β4T abl e +²,
where Correct denotes the number of correct answers (0, 1 or 2), Overconf is a dummy for overconfidence (1 = overconfident). Line is a dummy that assumed 1 if the respondent received a line graph, Column is a dummy that assumed 1 if the respondent received a column graph, and Table is a dummy that assumed 1 if the respondent received a table. Therefore, the baseline category is the text disclosure. We used the ordered logit model, since Correct is a discreet hierarchical variable. The coefficients from the ordered logit model are easier to interpret than the ordered probit, since they are the natural logarithm of the odds ratio.
Notwithstanding, we used ordered probit model and OLS in addition to ordered logit model to investigate whether table, column graph or line graph enhance accuracy at most in comparison with text (narrative only). In order to facilitate the interpretation of results, we parsimoniously added independent variables as follows. For each statistical technique (OL, OP, OLS), we first tested a univariate model (Correct =β0+β1Overcon f +²); i.e., models 1, 4 and 7 depicted in
Table 2.2. Then, we added the dummy variables for disclosure type, and tested the main model (H1A, H1B and H2) (models 2, 5 and 8 depicted in Table 2.2). Finally, we added a dummy variable for gender to test the expanded model (Correct =β0+β1Overcon f +β2Line +β3Column +
2.4. RESULTS
β4T abl e +β5G end er +²), depicted in Table 2.2 under the label model 3, model 6 and model 9;
where Gender is a dummy that assumed 1 if the respondent is male. This variable is included in the model to test if males and females had different performances in the task, since our H3 hypothesizes that males are more overconfident than females and H2 hypothesizes that overconfidence harms decision making.
Figure 2.1: Improvement on accuracy of graphs and table versus text
Table 2.3 presents the percentages of correct answers per cluster of respondents (overconfident and non-overconfident financial analysts), and the respective chi-squared test. It shows that overconfident financial analysts committed more errors than non-overconfident ones in this experiment setup. The table shows that 79% of non-overconfident respondents answered correctly both questions, while only 66% of the overconfident ones achieved such performance. Moreover, 20% of the overconfident analysts answered both questions incorrectly, while only 9% of the non-overconfident ones missed both questions.
Figure 2.1 presents the comparative effect of different types of information disclosure (us-ing textual–narrative only–disclosure as baseline) on financial analysts’ accuracy. Figure 2.1 reinforces results depicted in Table 2.2 that the type of information disclosure that provided the highest coefficient when compared to text was the column graph, followed by the line graph. The table coefficient did not significantly improve accuracy on decision making of financial analysts when compared to textual disclosure.
ANALYSTS’ ACCURACY ON DECISION MAKING T able 2.2: Correct answers as a function of overconfidence , disc losure type and gender (Results from H1A, H1B and H2) Ordered Logit Ordered P robit OLS Model 1 Model 2 Model 3 Model 4 Model 5 Model 6 Model 7 Model 8 Model 9 Overconfidence -.705*** -.679** -.681** -.420*** -.402** -. 402** -.237*** -.226*** -.226 *** -0.269 -0.271 -0.271 -0.157 -0.158 -0.158 -0.085 -0.085 -0.085 Line Graph .694** .692** .387* .386* .214* .214* -0.345 -0.345 -0.207 -0.207 -0.117 -0.117 Column Graph 1.046** 1.043** .533** .532** .259** .258** -0.421 -0.421 -0.24 -0.241 -0.128 -0.129 T able 0.545 0.541 0.325 0.323 0.2 0.199 -0.423 -0.414 -0.253 -0.253 -0.14 -0.141 Gender (1 = male) -0.061 -0.02 -0. 009 -0.285 -0.164 -0.086 N 295 295 295 295 295 295 295 295 295 Chi² / F † 6.84*** 13.67*** 13.71** 7.17*** 12.60** 12.62** 7.75*** 3.09** 2.47** Pseudo-R² / AdjR² ‡ 0.016 0.031 0.031 0.016 0.029 0.029 0.026 0.028 0.024 Standard Errors in parenthesis . * p<.1, ** p<.05, *** p<.01 All interactions in all models are nonsignificant. † Chi²-test for the Ordered Logit and Ordered Probit models and F-test for the O LS models . ‡ Pseudo-R² for the Ordered Logit and Ordered Probit models and AdjR² for the OLS mode ls .
2.4. RESULTS
Table 2.3: Number of correct answers by overconfidence (Results from H2)
Number of Correct Answers
Overconfidence 0 1 2 Total No 18 22 150 190 9.47% 11.58% 78.95% 100.00% Yes 21 15 69 105 20.00% 14.29% 65.71% 100% Total 39 37 219 295 13.22% 12.54% 74.24% 100.00% Pearsonχ2(2) = 7.66, p = .022
As results have shown, column graph was the best way of providing numerical flow informa-tion to individuals, followed by line graph, supporting H1B for both column graph and line graph. On the other hand, table representation did not enhance accuracy on decision making when compared to text disclosure (not supporting H1A). The result for H1A is not aligned with results presented by Peterson (1983); however, Peterson compared accuracy on interpretation of informa-tion disclosed on text (narrative only), with informainforma-tion disclosed on narrative with the aid of tables, narrative with the aid of graphs, and narrative with the aid of tables and graphs. Such methodological idiosyncrasy may lead to different results because the text plus table approach adopted by Peterson could be perceived by surveyed journalism undergraduate students as a decision-aid, while the table only approach we adopted was not perceived by surveyed financial analysts as a decision-aid.
An interesting difference between the results presented by Kelly (1993) and our research is the fact that Kelly found no effect of display format on accuracy, while we found that graph (both column and line) enhanced accuracy in comparison with textual disclosure. Such inconsistencies might be explained either by differences in the complexity of tasks or by sampling issues. Kelly does not present the tasks performed by respondents (only describes it briefly), hence, we cannot compare task complexity (our tasks are depicted in the appendix). Kelly’s sample was comprised of only 18 undergraduate journalism students, and he does not describe if respondents received any financial incentive (our sample is comprised by 295 financial analysts, and we did not offer them any financial incentive).
ANALYSTS’ ACCURACY ON DECISION MAKING
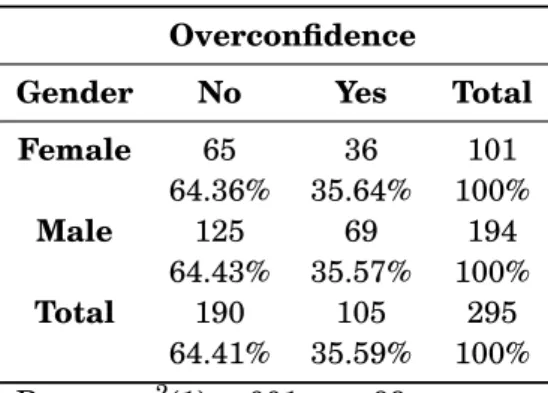
overconfidence subsample. The results presented in Table 2.4 show that there is no difference in overconfidence between genders (χ2(1) < .001, p = .99).
Table 2.4: Results from H4
Overconfidence
Gender No Yes Total
Female 65 36 101 64.36% 35.64% 100% Male 125 69 194 64.43% 35.57% 100% Total 190 105 295 64.41% 35.59% 100% Pearsonχ2(1) < .001, p = .99.
In order to test if the randomization procedure (biased coin) influenced the results of this experiment, we randomly selected a subsample of subjects who received the line graph condition with each “line graph” observation having a probability of .50 of being selected to this subsample, thus balancing the experiment. The results were robust, and significance levels and effects remained similar. In addition, the results for H3 remained similar (χ2(1) = .286, p = .593). Thus, the unbalanced randomization did not significantly affect our results.
Table 2.5 summarizes the evidence collected in this study from all tested hypotheses.
2.5
Discussion and Concluding Remarks
This study sheds some light on two points in the investigation of decision making of financial analysts: external and internal factors and how they interact with each other.
This research provides evidence that different ways of disclosing numerical information about flow could help or harm accuracy on decision making of accountants, financial analysts and investors (Vessey, 1991; Tang et al., 2013; Ghosh and Wu, 2012; Davis, 1989). Accuracy provided by table disclosure was not different from that provided by textual disclosure, and it can be explained by the fact that both display symbolic information (numbers). Although Peterson (1983) identified that tables enhance accuracy, she compared text only with text plus table; while we compared table only with text only. Column graph (p < .05) and line graph (p < .05) had
2.5. DISCUSSION AND CONCLUDING REMARKS
significant positive impact on accuracy of financial analysts, enhancing their ability to correctly answer the questions. This may be attributed to the spatial information disclosure provided by those graphs. Due to the fact that time is a continuous variable, it is no surprise that the column and line graphs presented the best results compared to textual disclosure, because it may be easier to visualize the change in a continuous variable in a spatial disclosure rather than with a symbolic disclosure. The reason for this is that spatial disclosure provides people with clear baselines, and it is easier for them to find the maximum and the minimum. However, in tables the respondents must convert symbolic information to a spatial format in order to find both maximum and minimum (Pinker, 1990). Therefore, this study shows that for continuous variables to change, graphs that enhance users’ ability of perception and accuracy are the ones that communicate more spatial information (such as column and line graphs), which is consistent with Vessey’s theory of graphical disclosure (Vessey, 1991).
The internal factor considered in this study is overconfidence, more specifically overplacement. Overconfidence was shown to harm accuracy on the interpretation of numerical information (across all types of information disclosure). This is consistent with previous research (Tang et al., 2013; Mannes and Moore, 2013a; Bengtsson et al., 2005) showing that overconfidence harms the decision-making process.
Contrary to previous research (Bengtsson et al., 2005; Barber and Odean, 2001; Beckmann and Menkhoff, 2008), gender did not influence the overconfidence of individuals in our sample, suggesting that male and female financial analysts are equally overconfident when analyzing graphical representation of information. This may be an effect of self-selection. Maybe only overconfident females choose to be financial analysts, or perhaps this profession changes their overconfidence, making both genders homogeneous in this trait, as suggested by Barcellos et al. (2015) and Hastie and Dawes (2010).
Also, the type of information disclosure did not influence overconfidence, showing evidence that different types of disclosure with similar difficulty do not impact the overconfidence of financial analysts.
Most experimental research has internal validity but lacks external validity (Brandon et al., 2013). We aimed to achieve a higher degree of external validity surveying professional participants
ANALYSTS’ ACCURACY ON DECISION MAKING
instead of students. Indeed, we intentionally selected a hypothetical non-accounting-oriented task (flow of people going in and out of a store during a 12 minute time period) in order to avoid experience bias, as previous institutionalized practices by the respondent could drive their response (Hout et al., 2015; Kahneman, 2011).
There are multiple further implications of these results for practitioners and researchers. Due to the fact that overconfidence and graphical disclosure of numerical information influence financial analysts’ accuracy on decision making, training preparers of financial reports to identify which type of numerical disclosure best presents what they purport to represent and training auditors to audit graphs could enhance the quality (faithful representation) of financial reports. Furthermore, training financial analysts on graphical impression management and to assess their personal traits (such as overconfidence, self-consistency and confirming-evidence seekers), could enhance the quality of graphical interpretation and decision making.
Another angle of this research is how other external factors influence perception and decision making involving numerical information. One personal trait that was analyzed is overconfidence, but other “traps” may also exist, such as self-consistency (persisting on a wrong decision only because one cannot admit that his/her decision was wrong) and confirming-evidence seekers (one only seeks evidence that confirms his/her perception and beliefs) (Hammond et al., 1998; Kahneman, 2011). Both “traps” can harm perception and decision making of financial analysts regarding graphical information.
There is evidence that people change their behavior when choosing for others versus when choosing for themselves (Mengarelli et al., 2014). Such evidence could also be moderated by the analysts’ level of overconfidence.
A fourth line of research is whether avoiding risks changes the perception of financial analysts regarding graphical information. One graph that shows a lot of ups and downs (big variance) could be regarded as worse than a graph showing consistent results (small variance), even if the expected return of the first is bigger than the second. Additionally, companies are increasing the use of videos and webcasts to present their reports. Hence, the impact of disclosure medium (e.g., printed versus video) on graphical perception and interpretation has not been investigated so far. In summary, the field of study on how internal factors (personal traits) affect individuals’
2.5. DISCUSSION AND CONCLUDING REMARKS
perception on graphical information is growing in the area of behavioral accounting, and there are several research paths to be studied and questions to be answered in this area.
ANALYSTS’ ACCURACY ON DECISION MAKING T able 2.5: Summary of evidences Hypotheses Supported? p-value H1A: Numerical information disc losed on tables enhances accuracy . No 0.2 H1B: Numerical information disc losed on graphs enhances accuracy . Y es .013 (column), .045 (line) H2: Overconfident financial analysts commit more errors . Y es <.01 H3: Male financial analysts are more overconfident than females . No 0.99
C
H A P T E R3
T
HEE
FFECT OFC
OGNITIVER
EFLECTION ON THEE
FFICACY OFI
MPRESSIONM
ANAGEMENT:
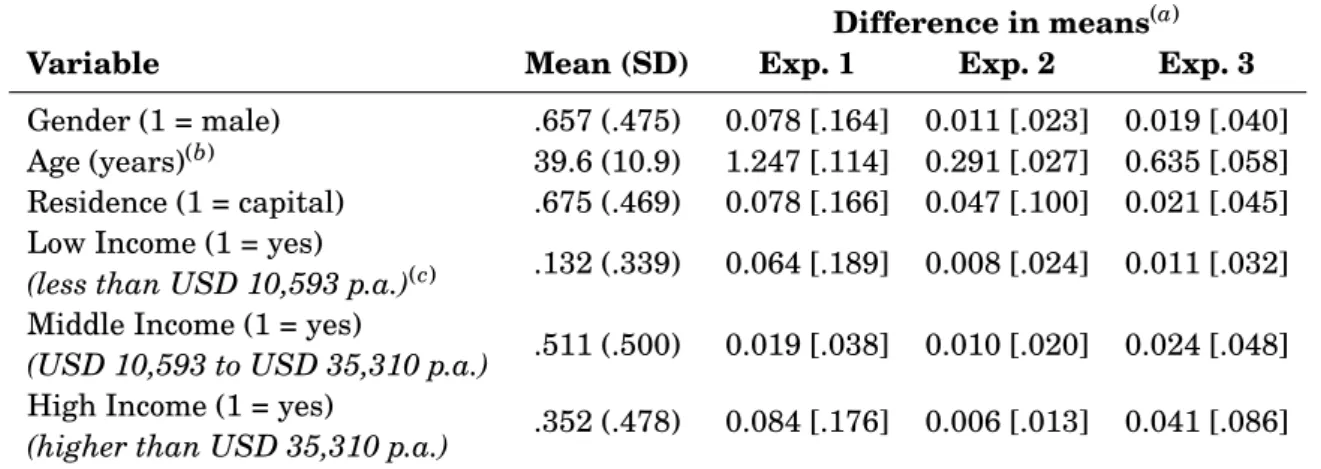
AN EXPERIMENTAL ANALYSIS WITHFINANCIAL ANALYSTS
3.1
Introduction to Chapter 3
I
magine that you have an interview for a job that you really want. You start to think about how you should dress for this interview. What goes through your mind? You probably will not consider wearing your favorite clothes or the clothes that you wear every day, but rather something that will impress the interviewer because you want to be hired (Wilhelmy et al., 2016).Companies are no different. They want to project a good image to the market, and they use different types of “clothes” in order to achieve this goal. One of the strategies for this is the use of graphs, which are widely presented in nonaudited financial information (such as the management commentary and chief executive’s review) (Merkl-Davies et al., 2011). In fact, the use of graphs in the note to financial statements has increased in the last few years. In 2009, the International Accounting Standards Board amended its International Financial Reporting Standard on financial instruments disclosure (IFRS 7) to state that “if the quantitative data
ANALYSTS
disclosed as at the end of the reporting period are unrepresentative of an entity’s exposure to risk during the period, an entity shall provide further information that is representative” (IFRS 7.35). If this is the case, the implementation guidance calls for the presentation of graphs: “[...] if an entity typically has a large exposure to a particular currency, but at year-end unwinds the position, the entity might disclose a graph that shows the exposure at various times during the period [...]” (IFRS 7.IG20).
Although literature on impression management has developed significantly in the last two decades, no study has yet investigated the influence of individual characteristics on the effects of impression management via financial graphs. This paper fills that gap. Thus, this research challenges current impression management literature by investigating whether an analyst’s personal cognitive trait (cognitive reflection ability) mitigates the efficacy of graphical impression management exercised under three different techniques: presentation enhancement, measure-ment distortion, and selectivity. Hence, our main research question is: Can analysts’ cognitive
reflection ability curb the effect of impression management through the use of graph-ics, ceteris paribus?Data were collected at three complementary stages. First, respondents performed three similar experiments in which they viewed a column graph depicting the net income trend of a hypothetical company, and were required to assign a rating (ranging from 0–10) to the company’s performance. The manipulation was the presence (absence) of impression man-agement, where each experiment consisted of an impression management technique: presentation enhancement (use of different colors), measurement distortion (distorting the scale of a graph) and selectivity (selecting only information with positive implications to be disclosed in the graph). After completing the three experiments, to measure participants’ cognitive reflection ability, the cognitive reflection test (CRT) developed by Frederick (2005) was applied. Finally, respondents completed a demographic questionnaire from which control variables were measured.
Hogarth (1993) argued that “to understand decision making, understanding the task is more important than understanding the people.” However, the current study investigates whether intrinsic characteristics of analysts (such as cognitive reflection ability) exercise significant influence on the efficacy of impression management techniques.
3.2. LITERATURE REVIEW AND HYPOTHESIS DEVELOPMENT
is that the efficacy of certain impression management techniques varies among individuals. It ar-gues and shows that some impression management techniques can be mitigated by reflectiveness, which highlights the importance of building capacity and skepticism on graph interpretation.
3.2
Literature review and hypothesis development
Impression management can be described as “the process by which people control the impressions others form of them” (Leary and Kowalski, 1990). Companies also use impression management because they want to enhance their “respectability and impressiveness” in the eyes of the public (Highhouse et al., 2009). Impression management consists of signals that are chosen by manage-ment to manipulate the impression that third parties have of the company. The literature has provided many explorations of whether certain signals, such as press announcements (Standish and Ung, 1982) and dividend policies (Akhigbe et al., 1993), influence how a company is perceived by the market. In fact, biases in judgment can create systemic influence in the market (Ganguly et al., 1994).
The use of impression management techniques in graphs is widespread. Beattie and Jones (1992) noted that in 1989, the average number of graphs presented in annual reports by large UK companies was 5.9 per report, and that 64 percent of these were column graphs. In addition, they found that, on average, 30 percent of graphs were distorted, with data being exaggerated by about 10.7 percent in favor of the company (i.e. graphical trends were exaggerated rather than understated). Godfrey et al. (2003) found similar results in Australia concerning impression management techniques used shortly after a CEO change; i.e. new CEOs often use impression management via graphs during the year following their appointment. Falschlunger et al. (2015) showed that the largest European companies also use impression management techniques to downplay unfavorable information and exaggerate favorable information. Furthermore, Cardoso et al. (2016) showed that different graphical presentations do in fact change the financial analyst’s understanding of the information being presented.
Hence, archival research (Beattie and Jones, 1992, 1993, 2002; Godfrey et al., 2003; Falschlunger et al., 2015) has shown that companies systematically use impression management techniques.
ANALYSTS
In addition, experimental research in accounting has shown that graphs do change an accoun-tant’s perception of company performance (Moriarity, 1979; Stock and Watson, 1984; Smith and Taffler, 1996; Tang et al., 2013; Cardoso et al., 2016). Townsend and Shu (2010) showed that the aesthetics of annual reports do influence experienced investors, even those with formal training in finance. Hence, small changes in graphical presentation have the power to impact assessments of company performance and investment decisions by professional investors.
Jones (2011) classified impression management using graphs into three subdomains: pre-sentation enhancement, measurement distortion and selectivity. Each of these inspired the development of the three experiments carried out in the current study, which was conducted with professional accountants who work as financial analysts. Presentation enhancements, such as use of color or 3D (as opposed to 2D), manipulate how a graph is portrayed. Measurement distortion defines the change of a graph’s scale to give a better impression to the market. Finally, selectivity consists of selecting only data that conveys favorable information to be disclosed. These three means of impression management are often used in company financial reports (Falschlunger et al., 2015). However, there is a gap in the relevant body of literature in that it has not considered the role played by intrinsic individual characteristics on the efficacy of impression management techniques. Nevertheless, studies on behavioral accounting and behavioral finance have acknowl-edged the impact of individual characteristics on decision making (Oechssler et al., 2009). In order to fill the gap in impression management studies about intrinsic individual characteristics, the current research measures participants’ cognitive reflection ability and classifies them as impulsive or reflective based on their CRT score, which varies from 0 (fully impulsive) to 3 (fully reflective) in accordance with the total amount of correct answers given to the three CRT questions (Frederick, 2005). In this way, the hypothesis of whether this personal trait mitigates the effect of impression management is tested.
3.2.1 The effect of colors
Colors play an important role in “psychological functioning in humans” (Elliot and Maier, 2014). Mehta and Zhu (2009) identified that the color red (vs blue) motivates avoidance and enhances negative information. In fact, Genschow et al. (2012) proved that the color red creates a sense
3.2. LITERATURE REVIEW AND HYPOTHESIS DEVELOPMENT
of avoidance in real decision making; in their study, red diminished snack food and soft drink consumption by participants. The “red vs blue effect” is ostensibly used in marketing to try to manipulate decision making of consumers (Labrecque and Milne, 2012). When compared to blue or green, red has been found to harm the activation of knowledge among men, but not among women (Gnambs et al., 2010). Even among animals, red is associated with negative signals such as aggressiveness and intimidation (Pryke, 2009).
In the “corporate world,” red also has negative connotations. In the English language, the term “red ink” is often related to negative performance, while the term “blue ink” (or “black ink”) is often related to positive performance.
Although in other contexts or cultural environments red ink may have a positive connotation – for instance, red hearts on Valentine’s Day (Elliot et al., 2007), and as a symbol of good luck in China (He, 2009) – this is not the case in the financial context or in the Brazilian cultural environment. Hence, considering that in the financial context red has an unfavorable connotation and blue (or black) has a favorable one, it is intuitive to present favorable performance using blue and unfavorable performance using red. This logic is aligned with the arguments used by Prelec and Loewenstein (1998); for instance, they stated:
"Acts of consumption and financial transactions call mental accounts to mind, which generates pleasure or pain depending on whether the accounts are in the red or in the black. For example, paying off the car in our story provides relief because it puts the “car account” in the black, thus ensuring that subsequent driving experiences are freed
from thoughts about payment."
In the accounting field there is some evidence on the effect of colors on decision making (Davison, 2015). There is evidence that color graphs improve low-task complexity decision making (So and Smith, 2002). Courtis (2004) showed that companies use different colors in annual reports, and these colors “influence perception formation and investment judgments”. Colors are even applied in corporate logos used in financial statements to convey the image that the company wants the market to capture (Davison, 2009). Additionally, web-based presentation enhancement techniques increase trust related to corporate social responsibility (Cho et al., 2009).
ANALYSTS
Therefore, presenting an unfavorable result in a blue-colored graph is counterintuitive and may be understood as an attempt to conceal unfavorable information with a “positive” color. Consequently, the following hypothesis is suggested:
H1: Presentation enhancement (color manipulation: blue vs red) will affect a financial analyst’s
perception of a company’s performance, such that blue will increase the rating assigned by the financial analyst and red will decrease it.
3.2.2 Distorting information
With the aim of portraying a better image to the market, companies often use measurement distortion to enhance favorable information and downplay unfavorable information (Beattie and Jones, 1993). O’Reilly III (1978) stated that in the organizational field the sender distorts information presented to the receiver in order to portray a better image of the related company. The desire to prove consistency is also a reason to distort information (Russo et al., 2008). Hence, measurement manipulation impacts different areas, such as contract formulations (Allen and Gale, 1992) and rating assignments (Beattie and Jones, 2002).
Measurement distortion may be operationalized using various approaches. One is the lie factor (LF) (Tufte, 1983) – i.e., the size effect shown in a graph divided by the size effect shown in data. In accordance with Tufte (Tufte, 1983), LF “greater than 1.05 or less than 0.95 indicate substantial distortion, far beyond minor inaccuracies in plotting”. Another approach is the graph discrepancy index (GDI) (Steinbart, 1989) – i.e. 100×((a/b)−1) , where a is the percentage change depicted in the graph and b is the percentage change in the data. Finally, the relative graph discrepancy (RGD) (Mather et al., 2003) is (g2− g3)/g3, where g2 is the height of the last column
depicted in graph, and g3is the correct height of the last column if plotted accurately; hence,
g3= (g1/d1) × d2, where g1 is the height of the first column depicted in the graph, d1is the value
of the first data point corresponding to the first column, and d2is the value of the last data point corresponding to the last column.
Experimental research in the accounting field has usually collected data from students. Beattie and Jones (2002) and Lawrence and O’Connor (1993) identified that subjects perceived companies whose graphs were distorted as performing better than other companies. However,
3.2. LITERATURE REVIEW AND HYPOTHESIS DEVELOPMENT
there is no experimental evidence about how professional financial analysts with an accounting background perceive distorted graphical information. Therefore, the following hypothesis is formulated:
H2: Information distortion will affect a financial analyst’s perception of a company’s
perfor-mance, such that the distorted graph will enhance the rating assigned by the financial analyst in comparison with that assigned based on an undistorted graph.
3.2.2.1 Information disclosure
The selection process of information disclosure is an important factor in the development of finan-cial reports (Healy and Palepu, 2001). According to Beattie and Jones (1996) and Falschlunger et al. (2015), companies often use graphs to present favorable information, but rarely for un-favorable information. Companies use impression management techniques “such that positive information is exaggerated, while negative information is either ignored or underplayed” (Bren-nan et al., 2009).
If a firm uses this type of impression management (selectivity of information disclosure in graphs) it faces only a small probability of being caught, since it is not changing the numbers, the scale, or the color of the graph, but only how much information goes on the graph itself. Hence, the approach can be very powerful, and yet very subtle, as will be highlighted below.
If a graph only presents favorable information, it may change the counterfactual thought process that an analyst has. If, for example, a company discloses that in the last five years its performance increased, analysts would conclude that the company’s performance prior to that period was not as good. However, if a graph presents information conveying that the company’s performance was better six years ago than it is today, then the counterfactual process, and consequently the analysts’ conclusion, will change. People often neglect the temporal information horizon effect (Liersch and McKenzie, 2009). This effect is amplified because managers from unprofitable companies “focus more on the future, rather than on past performance” in their management commentary (Clatworthy and Jones, 2006). Medvec et al. (1995) clearly showed the importance of counterfactual comparison of Olympic medalists: those who were awarded a silver medal were perceived as less happy than those who were awarded bronze. This occurs
ANALYSTS
because silver medalists compare themselves to gold medalists, while bronze medalists compare themselves to those who received no medals. This effect is analogous to the prior example: by not disclosing unfavorable information, companies change the counterfactual thought process of analysts. Therefore, it also changes the perception financial analysts form of a company’s performance or financial position, since the comparison baseline has changed. Empirical evidence has pointed to the fact that the “profit vs loss heuristic” is widely used by companies (Pinnuck and Shekhar, 2013). Thus, the following hypothesis is formulated:
H3: Selectivity (through the disclosure of favorable information only) will affect a financial
analyst’s perception of a company’s performance, such that the selected graph (favorable informa-tion only) will enhance the rating assigned by the financial analyst in comparison with a graph that depicts both favorable and unfavorable information.
3.2.3 Cognitive reflection ability
Kahneman (2011) developed “Systems 1 and 2 Theory,” in which he proposed that each and every person possesses two “systems of thinking:” one that is very impulsive (System 1) and the other that is more reflective (System 2). While System 1 is always “turned on” and is “cognitively cheap” (requiring a low amount of effort), System 2 needs to be activated and is “cognitively expensive.” For example, what is 2 × 2? And what is 137x363 ? Although these problems involve the same operation (multiplication), the first requires little cognitive effort, while the second requires a substantial amount. This happens because we can answer the first question using System 1, while we need to activate System 2 to answer the second question.
Frederick (2005) argued that some people are more reflective, or more impulsive, by nature. He developed the CRT in order to quantify how impulsive or reflective a person is. The CRT score ranges from 0 to 3 – 3 being fully reflective and 0 being fully impulsive.
The original CRT as proposed by Frederick consists of three questions:
“A bat and a ball cost $1.10. The bat costs $1.00 more than the ball. How much does the ball cost?”1
1In order to make the task more realistic for Brazilian respondents, in this study the costs were adjusted to the