Article
Commercial Aquaponics Approaching the European
Market: To Consumers’ Perceptions of Aquaponics
Products in Europe
Vesna Miliˇci´c1,*, Ragnheidur Thorarinsdottir2, Maria Dos Santos3and Maja Turnšek Hanˇciˇc4 1 Biotechnical Faculty, University of Ljubljana, Jamnikarjeva 101, SI-1000 Ljubljana, Slovenia
2 University of Iceland, Hjardarhaga 2-6, IS-107 Reykjavik, Iceland; rith@hi.is
3 DINAMIA’CET—ISCTE–IUL, ESCS—IPL, Av. das Forcas Armadas, Edificio, ISCTE, Sala 2W4-d, 1649-026 Lisboa, Portugal; mjpls1963@iscte.pt
4 Faculty of Tourism, University of Maribor, Cesta prvih borcev 36, SI-8250 Brežice, Slovenia; maja.turnsek@um.si
* Correspondence: vesna.milicic@bf.uni-lj.si
Academic Editor: M. Haïssam Jijakli
Received: 1 October 2016; Accepted: 16 January 2017; Published: 31 January 2017
Abstract:The first commercial aquaponics companies are starting up in Europe. The main focus has been on solving technology issues and optimizing production. However, increasing attention is now being paid to certification and regulations linked to aquaponics, as well as the marketing of products and services. The paper presents the results of a study whose main aim was to estimate consumers’ knowledge about aquaponics and their acceptance of aquaponics products in different European regions. An on-line questionnaire was administered to the general public through the aquaponics network of Food and Agriculture COST (European Cooperation in Science and Technology) Action FA1305 “The EU Aquaponics Hub—Realising Sustainable Integrated Fish and Vegetable Production for the EU” in 16 European countries. The methodology includes univariate and multivariate statistical techniques. The results show that, on average, attitudes towards aquaponics were positive, showing no significant differences between those who already knew about aquaponics and those who only heard about it through the survey. More than 50% of respondents had never heard of aquaponics, whilst more than 70% had already heard of hydroponics. No more than 17% of respondents were willing to pay more for aquaponically produced products and no more than 40% more when compared to the price of products from conventional farming. The results confirm three different clusters of potential consumers of aquaponics products. They also suggest an urgent need for implementing integrated and holistic approaches involving all stakeholders in aquaponics, in order to define a marketing plan and efficient communication strategies. This COST action, other projects and public decision makers must invest in educating consumers about aquaponics through the organization of guided tours, thematic workshops and tastings of aquaponics products in order to raise their awareness about this new technology. It is absolutely urgent that public decision makers, in cooperation with aquaponics stakeholders, address the main institutional constraints, namely the introduction of aquaponics as an economic activity and the organic certification of aquaponics products.
Keywords: questionnaire; aquaponics products; consumers’ acceptance; willingness-to-pay; consumers’ preferences; organic certification; on line survey; market analysis; education; multivariate statistics; Europe
1. Introduction
The Food and Agriculture Organization of the United Nations has emphasized aquaponics as a future sustainable food production practice and has recently released guidelines on small scale aquaponics production systems [1]. In Europe, many start-up companies are taking the first steps towards commercial aquaponics production [2]. However, European food production standards and an institutional European framework are not yet available for an integrated production system [3,4]. The present paper therefore aims to contribute to the literature in two ways. First, to analyse the current situation of aquaponics and highlight the main restrictions of the present activity in European countries in order to alert public decision makers of the need to analyse and solve the main problems of this sector better. Secondly, to analyse consumers’ knowledge about aquaponics and their acceptance of aquaponics products in different European regions in order better to define a marketing strategy and a plan of development to overcome the actual difficulties that directly affect producers, commercialization and the sector in general.
1.1. The State of the Art of Aquaponics
According to European food production standards, aquaponics products still cannot be certified organic, since according to European Commission Regulation (EC) No. 889/2008 paragraph 4 [5], organic plant production is based on nourishing plants primarily through a soil ecosystem and so hydroponic cultivation, in which plants grow with their roots in an inert medium feed with soluble minerals and nutrients is not allowed. Recirculating aquaculture systems (RAS) are also clearly prohibited as organic aquaculture according to European Commission Regulation (EC) No. 710/2009 paragraph 11 [6], although exceptions are made for hatcheries and nurseries.
The current institutional European framework, the gaps in legislation and the lack of legislative uniformity among EU Member States (EU MS) have strong negative impacts and hinder commercialization of aquaponics at the European level. According to Joly et al. [4], the main difficulties include constraints at three different levels: (1) administrative and organizational; (2) technical; and (3) environmental.
Major administrative and organizational constraints in the EU MS include that the European standard classification of productive economic activities [7] does not have a general or specific code for aquaponics but only separate codes for animal or plant production. That means, in practice, the impossibility of efficient development and progress of aquaponics business in European countries on a commercial scale. Currently, the process of registration of aquaponics production activities is confusing, time consuming, involves a lot of effort and is therefore inefficient. This because companies cannot register and perform this activity in a distinct way but only as two separate production activities, i.e., animal and plant production. On the other hand, and in correlation with the first constraint, that means that aquaponics production cannot be subsidized by the Common Agricultural Programs (CAP) as a distinct activity. In EU MS, agricultural activities are highly subsidized and their competitiveness, in great part, is a result of financial support from CAP subsidies [8]. That is not possible in the case of aquaponics and represents a huge constraint to the development of the aquaponics sector.
Environmental constraints occur due to EU MS environmental legislation, which considers separation of the effluents of aquaponics for plants and for animal production. Solid fish excrements are currently considered fish waste and not plant nutrient. This is another restriction that aquaponics farmers in Europe face and it contributes to a loss of efficiency in the activity. “However, when solid fish wastes are adequately processed, then the water nourishing the vegetables roots, is no longer fish waste but treated water” [4], which can be used in the hydroponic part in which plants grow.
Technical restrictions occur because commercialization and food safety norms are not explicit for aquaponics products. It is therefore difficult to run a business and commercialize the final production because each production type in the cycle belongs to different quality control services at different ministries, depending on the EU MS. Joly et al. [4] note that no specific rules apply for produce grown
in aquaponics production. One could therefore assume that separate regulations apply for, on the one hand, vegetable and, on the other, fish produce.
Despite these restrictions, aquaponics companies, aquaponics suppliers and many start-up businesses are taking the first steps towards commercial aquaponics production and there are also a few country governmental initiatives around the world.
In the United States of America, the history of aquaponics goes further back and a few medium scale commercial systems operate. Backyard aquaponics farming has also been quite popular in many regions [9]. Since 2008, aquaponics products produced in the USA can be certified organic according to the rules laid out in federal law by the National Organic Program of the United States Department of Agriculture [10], which provides a good starting point for pricing aquaponics products higher and offers a better competitive advantage on the market.
Nowadays, consumer awareness of the health benefits of locally and organically produced products is on the rise [11,12] and consumers make more conscious decisions when buying food [13], especially in developed and industrial countries. Consumer acceptance and certification criteria are of special interest for the development of commercial-scale aquaponics systems. All available studies about aquaponics have focused mainly on surveying aquaponics producers [14] or analysing specific case studies of aquaponics production, mostly in the USA [15], or specific Canadian provinces such as Alberta [16], or states such as Puerto Rico [17] and Hawaii [13,18,19]. To the author’s knowledge, a limited number of studies are available on consumers’ acceptance of aquaponics products, with only three published so far—on consumers’ acceptance of aquaponics products in Malaysia [20] and on the perception of aquaponics products in Romania [21] and Berlin [22].
Aquaponics, due to its recycling character, is one of the most promising types of sustainable urban farming [23]. Analysis of commercial urban roof-top farms showed that there are two types: soil-based open farms and soil-less hydroponic or aquaponic farms [24]. However, a recent study among urban residents in Berlin showed that only 28% of the sample approved aquaponics production of fish and vegetables in urban areas and only 27% of this sample expressed willingness to buy aquaponics products [22]. Consumers in Malaysia [20], on the other hand, expressed high levels of positive attitude towards aquaponics products and high intentions to buy aquaponics products. Consumers in Romania also held a positive overall image of aquaponics and aquaculture products due to their health benefits and freshness [21]. What these studies did not take into account, however, is the fact that aquaponics is a very young food production method and that, in general, consumers are not likely to be acquainted with the method. People often express attitudes about issues with which they are not familiar or about which they have never thought before, but they express their attitudes nevertheless. This is because they do not want to “lose face” and would rather express an attitude than have to admit that they are not familiar with the concept in question.
The great challenge nowadays is and will be in the coming decades meeting the increasing need for food production and distribution in big cities in a sustainable way [25,26]. “Organoponics” means aquaponics, and other low-input systems, as defined by Eigenbrod and Gruda [26], will continue to play an important role in sustainable and secure food production in the future.
Aquaponics is also especially promoted by government officials in Cuba, which is why both the yield and the area of this cultivation method have increased. These systems are used in the country for self-consumption as well as for schools and hospitals. This particular system is extremely sustainable, since it operates without fertilizers and is clearly linked to ecologically friendly practices [26,27].
The current work of Feucht and Zander [28] about aquaculture in Germany reveals that aquaculture methods are criticized by the public for potentially causing ecological problems and health risks for consumers. Unfavourable public perceptions may lead to a decline in consumption. Feucht and Zander [28] confirmed that production might be negatively affected, since legislation and therefore approval procedures are influenced by public perceptions. The aquaculture industry must consider public reactions to aquaculture production practices in order to prosper further.
Feucht and Zander [28] also focused on the presentation of recirculating systems and organic aquaculture. The results of media analysis indicate, in this case, that the analysed media primarily reported on aquaculture in a positive to neutral tone. The economic benefits of aquaculture dominated the coverage, whereas potential negative aspects of aquaculture received less attention. Organic fish farming and closed recirculating systems were both presented as eco-friendly practices.
Results from Mauracher et al. [29] about consumer preferences regarding the introduction of new organic products suggest that, while organic aquaculture might be a new and important strategy for diversification, if suitable communication, either from a public policy or commercial perspective, and labelling/certification are not taken into consideration, the added value of the production method might not be perceived by the final consumers. The authors refer to the inefficiency of small production units also leading to scale inefficiencies, due to the cost of machinery and buildings. These recommendations can also be followed by aquaponics practitioners.
Consumers’ willingness to pay (WTP) for organic leafy vegetables was studied with a contingent valuation approach in Rasht City, Iran by Kalashami et al. [30]. The main conclusions were that technological developments and changes in lifestyle and food regime have increased the frequency of diseases such as cancer. Modern agricultural systems have been criticized and a consensus reached for the introduction of organic agriculture to increase efficiency and reduce damage to the environment and public health.
1.2. The Methodological Approach
There is a huge consensus among various authors about the importance of multivariate analysis of consumers’ attitudes and values and consumer typologies through multivariate methods. These techniques were initially used in order to avoid aggregation errors in mathematical programming models and/or to integrate the psychological aspects of stakeholders in the decision-making process, especially when using multi-criteria decision models [31].
The main authors consider that segmentation of a panel of consumers is very useful in preference studies [32]. Two main multivariate techniques have traditionally been used to perform typification of consumers: Principal Component Analysis (PCA) and Cluster Analysis (CA).
PCA consists of identifying, based on a set of variables, a few factors that can synthesize most of the total information contained in the original variables. These factors are the common elements that form the basis of the variables intercollinearity [33,34]. This technique has largely been used for reducing the complexity of explaining farmers’ and consumers’ typologies [35,36].
PCA is classified among descriptive methods analysing interdependencies between variables. There are therefore no dependent variables and independent variables; the simultaneous combination of analysed variables (interdependences) is important [33,37].
Based on different factors, CA is a good instrument to use for studying the consumption, for example, of food products [38]. CA is a multivariate analysis technique used to form homogeneous groups, i.e., those that represent major homogeneity characteristics within a group and great heterogeneity between groups [31]. According to Nikiforova et al. [39], CA is widely used in economics and other related sciences. It involves grouping blocks of data in clusters using several indicators.
Gámbaro and Ellis [40] used CA in order to identify possible groups of consumers with different perceptions about the healthiness of different types of chocolate. Hierarchical CA was carried out on the scores. Trocchia and Janda [41] used a CA approach for consumer segmentation using a vegetarian/carnivorous distinction. Rohm and Swaminathan [42] used CA to define the typology of online shoppers based on shopping motivations. These authors reviewed all the shopping typology literature and their determinants and motivations. Vigneau et al. [32] performed segmentation of a panel of consumers using the clustering of variables around latent directions of preferences.
To obtain more knowledge about consumers’ behaviour and awareness of aquaponics products in different European regions, a mixed closed and open-ended questionnaire was constructed and distributed on the web. The questionnaire was applied to a European sample based on “convenience”
through the aquaponics network of Food and Agriculture COST (European Cooperation in Science and Technology) Action FA1305 “The EU Aquaponics Hub—Realising Sustainable Integrated Fish and Vegetable Production for the EU” (COST action FA1305 “Aquaponics Hub”) and respective countries, which might represent a weakness of the present paper. Nevertheless, this paper presents the main results showing consumers’ knowledge of aquaponics and their attitudes towards aquaponics food products in comparison to local, organic and conventional food products at the European level.
2. Materials and Methods
2.1. Survey Questions and Distribution
A web survey with 10 main questions was distributed on the Internet from 20 February to 31 August 2016. Some of the question sections included a set of sub questions, so the total number of questions was 24. The questionnaire included numerical answers, closed questions, semi-closed and open questions and Likert scale ranging from 1 (strongly disagree) to 5 (strongly agree). Five of the 24 questions were typical demographic questions about age, country of residence, gender, employment status and monthly income. Two additional questions were added to this part, namely about involvement in aquaponics and who in the household is in charge of weekly food purchases. The online questionnaire was published using the open source application “One click survey” (1 KA) for online surveys developed at the Centre for Social Informatics at the Faculty of Social Sciences of the University of Ljubljana [43]. It was translated into five European languages (English, Dutch, Greek, Spanish and Portuguese) and it was distributed via e-mail to the general public through the aquaponics network within the COST action FA1305 “Aquaponics Hub”. The questionnaire in English is presented in AppendixA.
2.2. Statistical Analysis
Statistical analysis included univariate and multivariate analysis. Both of the analyses were based on questionnaire results. This included qualitative (e.g., Likert scale) and quantitative information, as well as open and closed questions. A consumers’ behaviour index was constructed based on the ACSI (American Customer Satisfaction Index) model [44] and combining the latest developments from Johnson et al. [45]. The consumers’ attitudes index was based on a Likert scale with five choices. This was used for the assessment of consumer’s attitudes according to Gliem and Gliem [46]. The mean was calculated based on four indicators and the index of consumers’ attitudes towards aquaponics products.
Univariate statistical analysis was performed using Microsoft Office Excel 2013 for descriptive analysis and R version 3.3.1 (University of Auckland, Auckland, New Zealand) for the comparison between different variables. SPSS version 21 (SPSS Inc, Chicago; IL, USA) was used for multivariate analysis.
3. Results
Until the end of August 2016, 2338 answers were received, of which 635 were valid for further statistical analysis in terms of being fully completed. The reason for the drop-out was the relative length of the survey, which caused respondents to quit the survey before the end. The invalid responses could also be explained by the large amount of qualitative information collected.
The answers received were mainly from Belgium (41.3%), Greece (9.4%), Iceland (9.1%), Slovenia (3.8%) and the Netherlands (3.5%). Other countries each with less than 2% answers were: Portugal (1.9%), Italy (1.6%), Norway (0.9%), Germany (0.6%), Sweden (0.6%), Cyprus (0.5%), Spain (0.3%), Switzerland (0.3%), UK (0.3%), Denmark (0.2%) and Poland (0.2%) and Canada (0.3%), as the only non-European country. The main results of univariate analysis are presented in Sections3.1–3.4. In Sections3.5and3.6, the results of multivariate analysis are presented.
3.1. Demographic Data
There were no significant differences among the respondent age classes. The sample represented all age groups older than 20 years. The proportion of those aged between 20 and 30 years represented about a fifth of the sample (21.2%), although all other age groups were well represented. The respondents aged between 31 to 40 years represented 22.2%, those aged between 41 and 50 years represented 28.6%, those aged between 51 to 60 years old represented 21.7% and those older than 61 years represented 6.4% of the whole sample.
The gender balance was 50.8% females and 49.2% males. The respondents were mostly employed (64.5%), self-employed (15.3%) or students (8.5%). The majority of the respondents earned between 1000 and 3000 Euros a month (57.5%); 15.8% of respondents earned less than 1000 Euros a month. The survey managed to include the decision makers about weekly food purchases in the household, since most respondents claimed that they were in charge of food purchases, either by themselves (44.5%) or in cooperation with their partner (36.7%). More than 90% of respondents were not involved in aquaponics and they had never designed, built or run an aquaponics system by themselves. The majority of respondents involved in aquaponics were men (70%).
3.2. Consumers’ Behaviour When Buying Organic or Locally Produced Products
Consumers’ behaviour patterns when buying food, specifically their general purchasing attitude to local or organically produced food, was analysed. The results showed that more than 45% of respondents actively looked for ways to buy food from local farmers either at open markets or directly from farmers on their farms. Only 25.1% of respondents claimed that they considered price to be the most important decision factor when buying food, although 57% of respondents decided for non-organic produce if the price of organic was twice the price of non-organic and 55.6% of respondents when buying in the supermarkets took locally produced food, even if it was more expensive. When buying vegetables, 45% of respondents looked for pesticide and herbicide free produce. When buying fish, 36% of respondents would rather pay more for organically produced fish (Table1).
Factor analysis (see AppendixB) showed that all five indicators measuring consumers’ behaviour measure the same factor. The mean was calculated from these five indicators and the consumers’ behaviour index.
Table 1.The results of consumers’ behaviour when buying organic local products.
Valid Per Cent (n = 635)
Statement Strongly Disagree Disagree Neutral Agree Strongly Agree
S1: I actively look for ways to buy from local farmers
(e.g., buy at open air markets or directly from farmers). 7.2 20.8 24.4 31.3 16.2 S2: When I buy food I have to consider price as the most
important factor for the decision. 9.2 40.3 25.3 21.0 4.1
S3: If the price of organic produce is twice the price of
non-organic produce, I decide for non-organic produce. 9.0 17.1 16.9 35.6 21.4 S4: I am careful when buying fish and rather pay more
for organically produced fish. 11.6 24.7 27.7 23.1 12.8
S5: When buying in a supermarket I take the locally
produced food, even if it is more expensive. 3.9 17.5 22.9 40.1 15.5
3.3. Consumers’ Knowledge about Aquaponics and Attitudes towards Aquaponics Products
First, the knowledge of respondents of aquaponics in comparison to hydroponics was analysed. More than 50% of respondents stated that they had never heard of aquaponics, whilst only 30% stated they had never heard of hydroponics. Respondents who stated that they had heard of aquaponics or hydroponics were asked to explain what these two words mean. Less than 1% of answers were wrong; if respondents provided wrong answers they usually confused aquaponics and hydroponics.
Since aquaponics is a fairly recent food growing production technique, it was anticipated that a number of respondents would not be acquainted with the technique. Therefore a semi-experimental method was performed. For those who had never heard of aquaponics, a description of aquaponics that provides the main value propositions that can be read in commercial materials about aquaponics was created: “Aquaponics is a combination of aquaculture (fish farming) and hydroponics (growing plants using water rather than soil). In aquaponics, the waste produced by farmed fish supplies the nutrients for plants grown hydroponically, which in turn purifies water for the fish. This secures a closed-loop sustainable food production system. Very few pesticides and herbicides are non-toxic for fish so this ensures that aquaponics production uses organic pest and weed control.”
After reading a positive description of aquaponics, the respondents answered a set of questions about their attitudes towards aquaponics food production and aquaponics products. The first question was an open-ended question asking about their associations with aquaponics, their first response in terms of thoughts and argumentation. The answers can be grouped into two categories. Positive associations ranged from mere one-word descriptions such as “cool”, “clever”, “great”, “sustainable” and “environmentally friendly” to explanations such as “Interesting new method of cultivating food that may prove to be very important”. In general, positive associations were about the innovativeness and sustainability of aquaponics.
Negative associations were fewer than positive but need to be taken into account very seriously, since these were respondents that provided an opposite opinion to that which was described in the survey. As such, these respondents were non-conformist, for which you need stronger opinions. This is reflected in the fact that negative associations also ranged from two-word descriptions such as “not impressed”, but in general respondents felt the need to elaborate more on their negative associations, so they provided lengthier explanations such as “Vegetables mixed with fish—unpleasant feeling thinking about that combination” and “I think fish should live in their natural environment or a big enough artificial pond without overcrowding” or “I am a vegan. Fish farming? Are you serious?” or “I fear that, even if they are pesticide and herbicide-free, the farming wastes may still not be”. The negative associations could be grouped into three types of responses to aquaponics: (a) negative emotions, bordering on disgust with fish excrements in connection with vegetables; (b) negative perceptions of animal welfare in aquaponics; and (c) general distrust of positive claims about aquaponics.
After answering the open-ended association questions, respondents were given several Likert-scale type questions about their attitudes to aquaponics. More than 45% agreed or strongly agreed that aquaponics is the answer to more sustainable food production in the future. On average, attitudes to aquaponics were positive, showing no significant difference between those who already knew about aquaponics and those who only heard about it through the survey (Table2). This supported our expectation that those who had heard about aquaponics before, must have heard mostly positive descriptions about aquaponics, either through commercial material or through mass media or other communication channels. It should be noted here that although the amount of information about aquaponics in European media is quite small and positive, Europe has not faced any of the potential media scares about aquaponics. Aquaponics is, for example, very risk vulnerable to media scares in relation to food safety issues precisely because of the potentially negative associations about fish excrements in connection with vegetables.
Factor analysis (see AppendixC) showed that only four out of five indicators measure the same factor—consumers’ attitudes towards aquaponics products. The mean was calculated from these four indicators and the index of attitudes towards aquaponics products.
In order to test correlations between the index of attitudes towards aquaponics products and other analysed variables, regression analysis was performed (see AppendixD). Attitudes to aquaponics products proved to be correlated with consumers’ behaviour when buying organic or local food, but not with gender, age, monthly income or whether a person is in charge of weekly food purchases. Attitudes about aquaponics are highly correlated with consumers’ behaviour in terms of buying organic and
local food (see AppendixD). This means that the most likely consumers of aquaponics products are consumers who already value organic and local produce, and are not specifically characterized by gender, age or monthly income.
Table 2.The results of consumers’ attitudes to aquaponics products.
Valid Per Cent (n = 635)
Statement Strongly Disagree Disagree Neutral Agree Strongly Agree
S1: Next time I will buy vegetables I will look for
aquaponically grown vegetables. * 19.2 25.6 37.9 13.7 3.6
S2: When deciding between conventionally farmed fish and aquaponically farmed fish I would choose aquaponic fish. *
7.5 13.5 40.7 32.3 6.0
S3: Most of the scare about pesticides and herbicides
is exaggerated. * 22.9 27.3 18.1 18.9 12.7
S4: I like the idea, but I doubt I would actually eat
fish or vegetables grown in this way. 19.5 36.8 27.6 12.1 4.0
S5: I would choose aquaponics fish even if they
would cost more. * 8.7 26.6 41.6 20.9 2.2
S6: The only true vegetable production is in soil. * 19.1 34.0 19.7 17.7 9.5 S7: Aquaponics is the answer to more sustainable
food production. * 3.4 11.2 39.2 36.1 10.2
* Factor analysis showed that these indicators belong to the same factor and thus measure attitudes about aquaponics. 3.4. Consumers’ Willingness to Pay for Aquaponics Products
When purchasing vegetables, 17% of respondents would look for aquaponically grown vegetables, 38% would choose aquaponic fish in comparison to conventionally farmed fish, and 23% would choose aquaponic fish even if it cost more.
Furthermore, the willingness to pay for aquaponics products in comparison to the other two main premium features of food products, i.e., produced pesticide/herbicide and antibiotic free and produced locally, was analysed. Figure1presents these results. The results show that, on average, 54% of respondents would be willing to pay more for pesticide/herbicide and antibiotic free products (58% for trout, 52% for tomato and 52% for lettuce), 41% of respondents would be willing to pay more for locally produced products (44% for tomato, 42% for lettuce and 38% for trout) and only 17% of respondents would be willing to pay more for aquaponics products (22% for trout, 15% for tomato and 14% for lettuce).
Water 2017, 9, 80 8 of 22 Table 2. The results of consumers’ attitudes to aquaponics products.
Valid Per Cent (n = 635)
Statement Strongly Disagree Disagree Neutral Agree Strongly Agree
S1: Next time I will buy vegetables I will
look for aquaponically grown vegetables. * 19.2 25.6 37.9 13.7 3.6 S2: When deciding between conventionally
farmed fish and aquaponically farmed fish I would choose aquaponic fish. *
7.5 13.5 40.7 32.3 6.0
S3: Most of the scare about pesticides and
herbicides is exaggerated. * 22.9 27.3 18.1 18.9 12.7
S4: I like the idea, but I doubt I would actually eat fish or vegetables grown in this way.
19.5 36.8 27.6 12.1 4.0
S5: I would choose aquaponics fish even if
they would cost more. * 8.7 26.6 41.6 20.9 2.2
S6: The only true vegetable production is
in soil. * 19.1 34.0 19.7 17.7 9.5
S7: Aquaponics is the answer to more
sustainable food production. * 3.4 11.2 39.2 36.1 10.2
* Factor analysis showed that these indicators belong to the same factor and thus measure attitudes about aquaponics.
3.4. Consumers’ Willingness to Pay for Aquaponics Products
When purchasing vegetables, 17% of respondents would look for aquaponically grown vegetables, 38% would choose aquaponic fish in comparison to conventionally farmed fish, and 23% would choose aquaponic fish even if it cost more.
Furthermore, the willingness to pay for aquaponics products in comparison to the other two main premium features of food products, i.e., produced pesticide/herbicide and antibiotic free and produced locally, was analysed. Figure 1 presents these results. The results show that, on average, 54% of respondents would be willing to pay more for pesticide/herbicide and antibiotic free products (58% for trout, 52% for tomato and 52% for lettuce), 41% of respondents would be willing to pay more for locally produced products (44% for tomato, 42% for lettuce and 38% for trout) and only 17% of respondents would be willing to pay more for aquaponics products (22% for trout, 15% for tomato and 14% for lettuce).
Figure 1. Consumers’ willingness to pay for tomato, trout and lettuce produced aquaponically. Additionally, respondents were asked how much more in percentage they would be willing to pay for all three types of products, local, pesticide/herbicide and antibiotic free and aquaponics, in comparison to non-local and those produced in conventional/intensive farming. On average, respondents would be willing to pay 39.8% more for pesticide/herbicide and antibiotic free products
5% 43% 52% 3% 39% 58% 4% 44% 52% 0% 40% 80% tom ato_ less tom ato_ the same tom ato_ m ore trout_l ess trout_t h e same trout_m o re le tt uce _l ess le tt uce _t h e same le tt uce _more
Consumers´willingness to pay for aquaponics products
Figure 1.Consumers’ willingness to pay for tomato, trout and lettuce produced aquaponically.
Additionally, respondents were asked how much more in percentage they would be willing to pay for all three types of products, local, pesticide/herbicide and antibiotic free and aquaponics,
in comparison to non-local and those produced in conventional/intensive farming. On average, respondents would be willing to pay 39.8% more for pesticide/herbicide and antibiotic free products in comparison to products that are produced in conventional/intensive farming, 39.5% more for locally produced products in comparison to products that are not produced locally and 37.6% more for aquaponics products in comparison to those produced in conventional/intensive farming (Figure2). For aquaponically produced products, 75% of respondents would pay the same as for products produced in a conventional way if they were produced locally. On the other hand, it is not self-evident that such food should be more expensive. Some respondents were of the opinion that it should cost less and not more.
1
2
3
Figure 2.Box plots of consumers’ willingness to pay more for locally, pesticide/herbicide and antibiotic free and aquaponically produced tomato, trout and lettuce.
On average, 11.2% respondents would pay less for locally produced products (12.3% for lettuce, 11.8% for tomato and 9.6% for trout), 8% of respondents would pay less for aquaponics products (8.8% for trout, 7.7% for lettuce and 7.4% for tomato) and only 4% of respondents would pay less for pesticide/herbicide and antibiotic free products (4.8% for tomato, 4.1% for lettuce and 3.1% for trout). These respondents would on average pay 33.9% less for local products, 40.6% for pesticide/herbicide and antibiotic free products and 41.1% less for aquaponics products (Figure3). This leads to the conclusion that aquaponics in itself, not produced locally and not emphasized as pesticide/herbicide and antibiotic free, is regarded as less attractive than the other two attributes.
1
2
3
Figure 3.Box plots of consumers’ willingness to pay less for locally, pesticide/herbicide and antibiotic free and aquaponically produced tomato, trout and lettuce.
3.5. Main Factors that Explain Consumers’ Attitudes towards Aquaponics
The results of univariate analysis are very important, since they allow us to analyse respondents’ knowledge of aquaponics and their attitudes and values acceptance of aquaponics products. It is also important to confirm whether respondents are a homogeneous group in relation to their attitudes towards aquaponics, or whether they have particular characteristics that may enable us to identify different types of consumers and what are their main characteristics.
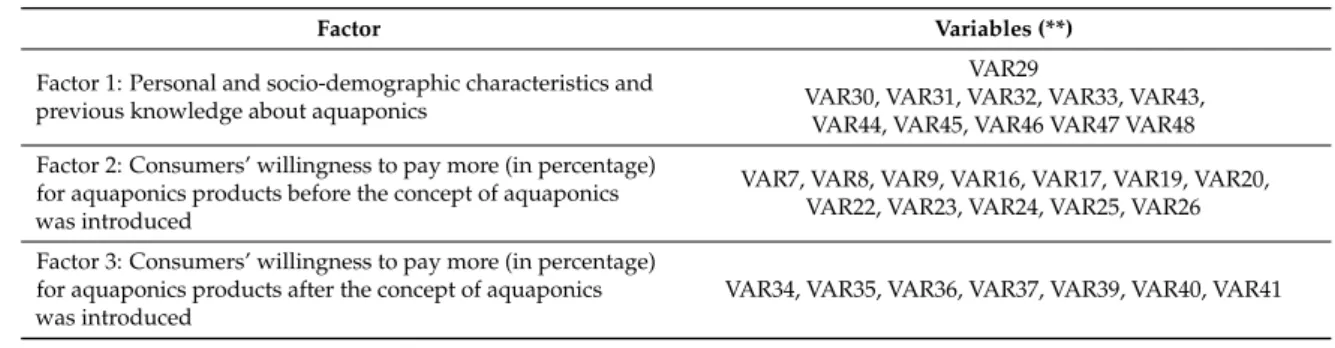
The results of PCA confirmed the existence of three factors that mainly explain the attitudes and values of respondents about aquaponics. In other words, there are three main groups of characteristics
that enable grouping the attitudes and values of respondents and distinguishing potential consumers of aquaponics products. These factors include: (1) the personal and socio-demographic characteristics of the respondents and previous knowledge of aquaponics; (2) the respondents’ willingness to pay in percentage for locally produced or pesticide/herbicide and antibiotic free products before the concept aquaponics was introduced; and (3) the respondents’ willingness to pay in percentage for aquaponics products after the concept of aquaponics was introduced and the respondents’ main values concerning aquaponics (Table3). These results confirmed that it is necessary and urgent to educate consumers about aquaponics through various educational programs and training, such as guided tours, thematic workshops and live tastings of aquaponics products on the aquaponics farm, in order to raise their awareness about this new developing technology in the food production industry.
Table 3.Factors that explain consumers’ attitudes to aquaponics products.
Factor Variables (**)
Factor 1: Personal and socio-demographic characteristics and previous knowledge about aquaponics
VAR29
VAR30, VAR31, VAR32, VAR33, VAR43, VAR44, VAR45, VAR46 VAR47 VAR48 Factor 2: Consumers’ willingness to pay more (in percentage)
for aquaponics products before the concept of aquaponics was introduced
VAR7, VAR8, VAR9, VAR16, VAR17, VAR19, VAR20, VAR22, VAR23, VAR24, VAR25, VAR26 Factor 3: Consumers’ willingness to pay more (in percentage)
for aquaponics products after the concept of aquaponics was introduced
VAR34, VAR35, VAR36, VAR37, VAR39, VAR40, VAR41 Source: Results of PCA from the authors. ** All the variables are listed in AppendixA.
3.6. Main Typologies of Potential Consumers of Aquaponics
Cluster analysis used Euclidean distance and Ward’s aggregation method according to Dos-Santos [8,31] and Silva et al. [47]. Due to the nature of the data (numerical scale, Likert scale, etc.) and the distributions among different data from different countries, it was clearly difficult to separate and form consumer groups. To confirm the analysis, multiple regression analysis with quantitative data was performed. The combined results of this analysis showed that there are only three groups of potential consumers of aquaponics products. The first group of consumers, “Innovative”, defined as innovative by several authors in various literature [48–50], consisted of a small group of consumers (less than 17%) with a mean age of 35 years and average income between 2001 and 3000 Euros who are employed. This group was willing to pay more than 19% for aquaponics products and was relatively familiar with this type of food production. The second group of consumers, “Potential aquaponics consumers” was made up of about 23% of the sample and was aged between 46 and 50 years with an income of about 4001 to 5000 Euros per month. Within this group, only 15% of consumers knew what aquaponics is. After presenting the concept of aquaponics, this group of consumers was willing to pay 15% more on average for products produced in aquaponics. The third group, “Status-quo of aquaponics consumers”, was composed of the majority of the sample (60%). This cluster had an average age between 55 and 60 years; an income between 3001 and 4000 Euros per month, had never heard about aquaponics on the media and was not willing to pay more for products produced in aquaponics. It should be noted that the present sample was based on “convenience” and does not fully represent all of the countries under study. That could cause some difficulties in the analysis. The application of non- random sampling in the present study was justified by its novelty and originality, because it is the first in this field. Random sampling may have provided a more accurate representation of the sample and universality of study but, due to the new concepts on consumers’ perception in the aquaponics field, the analysis of results could be unviable due to the unfamiliarity of the theme. For further, more detailed, analysis, therefore, a more comprehensive sample that represents all the countries in the analysis is recommended.
4. Discussion
Aquaponics—the combination of a recirculating aquaculture system and hydroponics—is taking its first steps towards the introduction of commercial production systems in Europe. Interest has been increasing both within research communities and also in related industries. In recent years, aquaponics facilities have been designed and constructed in most European countries. However, development is in a very early stage, with still only a few and tiny aquaponics production facilities, most often related to urban farming. Currently, the largest production system is the Ner Breen aquaponics system in the Basque country, with a new 6000 m2facility [51]. The second is situated in The Hague in The Netherlands and was built by Urban Farmers in 2016. It is a 1500 m2greenhouse with aquaponics facilities, on the roof of a former Phillips factory [52]. A few other European companies have started small scale commercial production, e.g., Ponnod in Slovenia [53], Tilamur in Spain [54], Svinna in Iceland [55], IGFF in Denmark [56], ECF in Germany [57] and BioAquaFarm in the UK [58]. The focus so far has mainly been on technology issues relating to the design and operation of combined systems to optimize production capacity in both parts of the system and minimizing risks. As the first commercial aquaponics companies are starting up in Europe, regulations and certification criteria for aquaponics become necessary. Moreover, consumers’ perceptions of aquaponics products need to be clarified.
Thus far, no regulations or EU standards exist for the integrated production method and for aquaponics as an economic activity. According to the present EU standards, neither fish nor vegetables/fruits from aquaponics can be certified as organic, since RAS is not certified organic and, according to European organic standards, plants need to be grown in soil. In the USA, the development of aquaponics has a longer history, standards have been developed and, since 2008, aquaponics products can have organic certification. A special working group within the COST action FA1305 “EU Aquaponics Hub” have taken on the task of clarifying the standardization and certification criteria for aquaponics in collaboration with the front-running European aquaponics companies.
Aquaponics enthusiasts are often driven by the idea of aquaponics being sustainable food production, minimizing waste and making the most of water, energy and nutrient resources. Limited information, however, exists about general consumers’ acceptance of aquaponics products.
The survey was directed towards the general consumer. The gender balance was close to 50/50 and from all age groups. More than 50% of respondents had never heard about aquaponics and only 5.5% of respondents were in some way involved in aquaponics themselves. In comparison, more than 70% had heard about hydroponics, which is mainly because hydroponics is a well-established food production practice and more commercially recognizable, especially in industrialized countries. Respondents were in general positive towards aquaponics. The results indicate, however, that willingness to pay when buying food is mainly based on price and whether the products are free of antibiotics, pesticides and herbicides. There is also a positiveness towards local products. Aquaponics producers should therefore focus their marketing on local stores and restaurants, emphasizing sustainable and clean food production, free of any antibiotics, pesticides or herbicides.
At the same time, it should be noted that important results were also provided with open-ended questions about associations on aquaponics from respondents who had never heard about aquaponics and expressed their opinions on it after reading about it. Here, the results showed that we should be more wary about general conclusions about positive attitudes towards aquaponics. Although more associations were positive than negative, this was in line with the positive description of aquaponics that was provided in the survey. Positive associations were about the innovativeness and sustainability of aquaponics. At the same time, respondents with positive associations did not provide many in-depth elaborations about their positive attitudes, but stayed mostly at the level of one-word descriptions such as “cool”, “clever” or “great”. Much more revealing were the answers of those who had read the positive description of aquaponics but had a negative association. These answers were more elaborated and belonged to three types of negative responses to aquaponics: (a) negative emotions, bordering on disgust with fish excrements in connection with vegetables; (b) negative perceptions of animal welfare in aquaponics; and (c) general distrust of positive claims about aquaponics.
Furthermore, the results of multivariate analysis showed that, on average, despite attitudes to aquaponics being positive, more than half of the sample had never heard of aquaponics. These results highlight the importance of global strategies of communication and marketing on this process. According to Bekker et al. [59], the explicit attitude towards cultured meat can be influenced by information about the sustainability of cultured meat and information about a positively perceived sustainable product. This alerts us to the importance of education of consumers and young people about aquaponics.
Mauracher et al. [29] noted that the introduction of new products on the market poses several challenges. In particular, whether the characteristics of the proposed product will be judged positively by potential consumers. This is particularly relevant in the case of aquaponics products, which represent a “novelty” on the market, not well known to consumers. The results of the study by Mauracher et al. [29] suggest that, while organic aquaculture might be a new and important strategy for diversification, if suitable communication, either from a public policy or commercial perspective, and labelling/certification are not taken into consideration, the added value of the production method might not be perceived by the final consumers.
The respondents of the present survey revealed different attitudes before and after the definition of aquaponics was introduced in the questionnaire. Those results are consistent with those of previous authors that have studied attitudes about organic food [30,59–61]. Due the extensive list of works from the last decades devoted to implicit attitudes towards a large range of food items [60], only the most recent ones on organic food were studied more in depth. These reveal the importance of communication and marketing strategies to be followed, as noted by Feucht and Zander [28], Mauracher et al. [29] and Sondhi [61].
The main results confirm the importance of variables such as income, education level and previous knowledge about aquaponics in the attitudinal statement. These results are in accordance with those of Kalashami et al. [30], who analysed consumers’ willingness to pay (WTP) for organic leafy vegetables in Iran with a contingent valuation approach. The results of the present work were also in line with the results of Sondhi [61], who analysed the consumption of organic food products. Among the studied variables, income, education level and family history of cancer positively and significantly affected consumers’ WTP for organic leafy vegetables [30].
This means that more knowledge about aquaponics products needs to reach consumers through interactive learning practices and examples of existing good practices. The results of Hilverda et al. [62] on impacts of social media interaction with peers, experts and anonymous about the effects on risk perception and sense-making of organic food, also show that initial attitude has a strong effect on that subject and the more positive consumers were about eating organic food, the lower their risk perception and the higher their need for information. These communication actions are being performed in the COST Action FA1305 “Aquaponics Hub”. At the moment, various training courses and summer schools have been carried out, including media games, flyers, social media, etc., but promotion of and education about aquaponics systems needs to continue further in the future. This will be the way to promote this healthy and sustainable system of food production.
The questionnaire has been recently translated into five additional European languages (Italian, Hungarian, German, French and Czech) in order to extend the population sample to other European regions to get a more representative sample for further multivariate analysis.
5. Conclusions
Aquaponics is believed to have future potential as a sustainable integrated food production method. However, development is still in its early stage and although many new aquaponics companies are starting up in Europe, only a few of them are currently reaching an economically viable minimum production size. Thus far, aquaponics studies have mostly been related to technology and environmental parameters, but social parameters are now receiving attention since the marketing of the new products has started. This study focuses on consumers’ perceptions of aquaponics. The results
show that consumers’ acceptance is in general positive towards aquaponics but willingness to pay is mainly related to products free of antibiotics, pesticides and herbicides and connected with local well-known producers. This provides a valuable marketing opportunity for emerging commercial aquaponics companies with a correct focus on their marketing potential emphasizing clean and green local food production.
Acknowledgments:Translation of the questionnaire was provided by Maria José Dos-Santos (DINÃMIA’CET-ISCTE-IUL and ESCS, Portugal), Elena Mante and Dora Koutsogaki (University of Thessaly, Greece) and Saskia Buysesns (PCG, Belgium). This work was supported by COST Action FA1305 and the survey was distributed with great help of COST Action FA1305 members in sixteen European Countries.
Author Contributions: Vesna Miliˇci´c, Ragnheidur Thorarinsdottir and Maja Turnšek Hanˇciˇc conceived and designed and performed the questionnaire; Vesna Miliˇci´c, Ragnheidur Thorarinsdottir, Maja Turnšek Hanˇciˇc and Maria dos Santos translated the questionnaire and together with all members of COST Action applied the questionnaire. Vesna Miliˇci´c, Maja Turnšek Hanˇciˇc and Maria Dos Santos analysed the data; Ragnheidur Thorarinsdottir and Maja Turnšek Hanˇciˇc contributed analysis tools and references. Vesna Miliˇci´c, Ragnheidur Thorarinsdottir, Maria Dos Santos and Maja Turnšek Hanˇciˇc wrote the paper.
Conflicts of Interest:The authors declare no conflict of interest.
Appendix A
Appendix A contains a copy of the questionnaire used in the survey. The questionnaire was translated into five European languages (English, Dutch, Greek, Spanish and Portuguese). The questionnaire in AppendixAis in the English version. The questionnaire was accompanied by a cover letter from the main authors to present the importance and the main goals of the study. Variables used in the statistical analysis are indicated beside each question in the questionnaire.
Q1. People have different habits and opinions when buying food. We will give you six statements about food buying habits. Please respond at a scale between 1 and 5, where 1 means “strongly disagree” and 5 means “strongly agree”.
Statement 1 Strongly Disagree 2 Disagree 3 Neutral 4 Agree 5 Strongly Agree
VAR1 S1: I actively look for ways to buy from local farmers (e.g., buy at open air markets or directly from farmers). VAR2 S2: When I buy food I have to consider price as the most important factor for the decision.
VAR3 S3: When I buy vegetables I look for pesticides and herbicides free produce.
VAR4 S4: If the price of organic produce is twice the price of non-organic produce, I decide for non-organic produce. VAR5 S5: I am careful when buying fish and rather pay more for organically produced fish.
VAR6 S6: When buying in a supermarket I take the locally produced food, even if it is more expensive.
Q2. How much would you be willing to pay for bellow written products if produced locally in comparison to products that are not produced locally?
VAR7 Less than for Non-Local Products
VAR8 The same as for Non-Local Products
VAR9 More than for Non-Local Products VAR10 1 kg of tomato
VAR11 1kg of trout VAR12 1 head of lettuce
VAR13 Q2a: If less: How much less do you think you should pay in percentage? We are only interested in your opinion, there is no right or wrong answer.
I think I should pay % less for locally produced tomato/trout/lettuce.
VAR14 Q2b: If more: How much more would you be willing to pay in percentage? We are only interested in your opinion, there is no right or wrong answer.
I would be willing to pay % more for locally produced tomato/trout/lettuce.
VAR15 Q3: How much would you be willing to pay for bellow written products if produced pesticide/herbicide and antibiotic free in comparison to products that are produced using pesticides/herbicides and antibiotics (e.g., conventional/intensive farming)?
VAR16 Less than for Conventionally Produced Products
VAR17 The same as for Conventionally Produced Products
VAR18 More than for Conventionally Produced Products VAR19 1 kg of tomato
VAR20 1 kg of trout VAR21 1 head of lettuce
VAR22 Q3a: If less: How much less do you think you should pay in percentage? We are only interested in your opinion, there is no right or wrong answer.
I think I should pay % less for pesticides/herbicides free tomato/lettuce and antibiotics free trout.
VAR23 Q3b: If more: How much more would you be willing to pay in percentage? We are only interested in your opinion, there is no right or wrong answer.
I would be willing to pay % more for pesticides/herbicides free tomato/lettuce and antibiotics free trout.
VAR24 Q4: Have you ever heard about hydroponics?
A. Yes
B. No
VAR25 Q4a: If yes, please describe what it means. There is no right or wrong answer, we just want to hear your opinion.
VAR26 Q5: Have you ever heard about aquaponics?
A. Yes
VAR27 Q5a: If yes, please describe what it means. There is no right or wrong answer, we just want to hear your opinion.
Q6.We are specifically interested in your opinion about aquaponics.
S1:Aquaponics is a combination of aquaculture (fish farming) and hydroponics (growing plants using water rather than soil).
S2: In aquaponics the waste produced by farmed fish supplies the nutrients for plants grown hydroponically, which in turn purifies water for the fish. This secures a closed-loop sustainable food production system. S3: Very few pesticides and herbicides are non-toxic for fish so this ensures that aquaponics production uses organic pest and weed control.
People respond differently to aquaponics. After reading this description, please tell us what your first respond is to aquaponics?
VAR28 I think aquaponics is (please provide the first thought or an association that you can think of, there is no right or wrong answer):
Q7.There are diverse opinions about aquaponics. We have collected some of these thoughts and would like to know to what extent you agree with the statements written bellow. Please respond at a scale between 1 and 5, where 1 means “strongly disagree” and 5 means “strongly agree”.
Statement 1 Strongly Disagree 2 Disagree 3 Neutral 4 Agree 5 Strongly Agree
VAR29 S1: Next time I will buy vegetables I will look for aquaponically grown vegetables. VAR30 S2: When deciding between
conventionally farmed fish and aquaponically farmed fish I would choose aquaponic fish. VAR31 S3: Most of the scare about pesticides and herbicides is exaggerated.
VAR32 S4: I like the idea, but I doubt I would actually eat fish or vegetables grown in this way. VAR33 S5: I would choose aquaponics fish even if they would cost more.
VAR34 S6: The only true vegetable production is in soil.
VAR35 S7: Aquaponics is the answer to more sustainable food production.
Q8. How much would you be willing to pay for bellow written products if produced aquaponically in comparison to products that are produced using pesticides/herbicides and antibiotics (e.g., conventional/intensive farming)?
VAR36 Less than for Conventionally Produced Products
VAR37 The Same as for
Conventionally Produced Products
VAR38 More than for Conventionally Produced Products 1 kg of tomato
1 kg of trout 1 head of lettuce
VAR39 Q8a: If less: How much less do you think you should pay in percentage? We are only interested in your opinion, there is no right or wrong answer.
I think I should pay % less for aquaponically produced tomato/trout/lettuce.
VAR40 Q8b: If more: How much more would you be willing to pay in percentage? We are only interested in your opinion, there is no right or wrong answer.
I would be willing to pay % more for aquaponically produced tomato/trout/lettuce.
VAR41 Q9: Would you like to add anything? If you would like, you can write down your opinion about the questionnaire or about the presented topic in general.
Q10.Finally, just a few short questions.
VAR42 Q10a: How old are you?
A. 20–25 B. 26–30 C. 31–35 D. 36–40 E. 41–45 F. 46–50 G. 51–55 H. 56–60 I. 61–65 J. More than 65
VAR43 Q10b: In which country do you live?
VAR44 Q10c: Are you somehow involved in aquaponics? Have you designed and built an aquaponics system and do you run an aquaponics system by yourself?
A. YES
B. NO
VAR45 Q10d: Gender
A. Female
B. Male
VAR46 Q10e: What is your status?
A. Student
B. Employed
C. Self-employed
D. Retired
E. Unemployed
VAR47 Q10f: What is your monthly income?
A. Less than 1000 EUR
B. Between 1000 and 2000 EUR
C. Between 2001 and 3000 EUR
D. Between 3001 and 4000 EUR
E. Between 4001 and 5000 EUR
VAR48 Q10g: Who is in charge of weekly purchase of food in your household?
A. Myself
B. My partner
C. My parents
D. My grandparents
E. Myself and my partner
F. Partner’s parents
G. Other (please specify):
You have finished the survey. Thank you very much!
Appendix B
Factor analysis: Consumer behaviour when buying local and organic produce
Communalities
Statement Initial Extraction
S1 I actively look for ways to buy from local farmers (e.g., buy at open air markets or directly
from farmers). 1.000 0.440
S3. When I buy vegetables I look for pesticides and herbicides free produce. 1.000 0.629 S5. I am careful when buying fish and rather pay more for organically produced fish. 1.000 0.553 S6. When buying in a supermarket I take the locally produced food, even if it is
more expensive. 1.000 0.441
S2. When I buy food I have to consider price as the most important factor for the decision. * 1.000 0.217 S4. If the price of organic produce is twice the price of non-organic produce, I decide for
non-organic produce. * 1.000 0.471
Extraction Method: Principal Component Analysis (PCA).
* The direction of the statements is negative (if people agree on these statements then they are expressing a negative attitude or behaviour towards organic food). Therefore we recoded the statements (1 = 5, 2 = 4, 3 = 3, 4 = 2, 5 = 1) in order to measure the same direction of the variable. This explanation is valid for every statement with *.
Total Variance Explained
Component Initial Eigenvalues Extraction Sums of Squared Loadings Total % of Variance Cumulative % Total % of Variance Cumulative %
1 2.751 45.853 45.853 2.751 45.853 45.853 2 0.998 16.636 62.490 3 0.766 12.770 75.260 4 0.579 9.644 84.904 5 0.550 9.161 94.065 6 0.356 5.935 100.000
Extraction Method: Principal Component Analysis (PCA).
Component Matrixa Statement
Component 1
S1. I actively look for ways to buy from local farmers (e.g., buy at open air markets or directly from farmers). 0.664 S3. When I buy vegetables I look for pesticides and herbicides free produce. 0.793 S5. I am careful when buying fish and rather pay more for organically produced fish. 0.743 S6. When buying in a supermarket I take the locally produced food, even if it is more expensive. 0.664 S2. When I buy food I have to consider price as the most important factor for the decision—recoded 0.466 S4. If the price of organic produce is twice the price of non-organic produce, I decide for non-organic produce. * 0.686
Extraction Method: Principal Component Analysis (PCA). aComponents extracted.
Appendix C
Factor analysis: Attitudes about aquaponics produce
Communalities
Statement Initial Extraction
S1. Next time I will buy vegetables I will look for aquaponically grown vegetables. 1.000 0.602 S2. When deciding between conventionally farmed fish and aquaponically farmed fish I would
choose aquaponic fish. 1.000 0.736
S5. I would choose aquaponics fish even if they would cost more. 1.000 0.648 S7. Aquaponics is the answer to a more sustainable food production. 1.000 0.532 S3. Most of the scare about pesticides and herbicides is exaggerated. * 1.000 0.494 S4. I like the idea, but I doubt I would actually eat the fish or vegetables grown in this way. * 1.000 0.494
S6. The only true vegetable production is in soil. * 1.000 0.761
Extraction Method: Principal Component Analysis (PCA).
Total Variance Explained
Component Initial Eigenvalues Extraction Sums of Squared Loadings Total % of Variance Cumulative % Total % of Variance Cumulative %
1 2.793 39.897 39.897 2.793 39.897 39.897 2 1.473 21.041 60.938 1.473 21.041 60.938 3 0.810 11.566 72.504 4 0.670 9.573 82.077 5 0.556 7.936 90.013 6 0.376 5.368 95.381 7 0.323 4.619 100.000
Extraction Method: Principal Component Analysis (PCA).
Component Matrixa Statement
Component
1 2
S1. Next time I will buy vegetables I will look for aquaponically grown vegetables. 0.774 −0.055 S2. When deciding between conventionally farmed fish and aquaponically farmed fish I would
choose aquaponic fish. 0.821 −0.248
S5. I would choose aquaponics fish even if they would cost more. 0.770 −0.235 S7. Aquaponics is the answer to a more sustainable food production. 0.678 0.269 S3. Most of the scare about pesticides and herbicides is exaggerated. * 0.368 −0.599 S4. I like the idea, but I doubt I would actually eat the fish or vegetables grown in this way. * 0.514 0.480 S6. The only true vegetable production is in soil. * 0.263 0.832
Extraction Method: Principal Component Analysis (PCA). a2 components extracted.
Communalities
Statement Initial Extraction
S1. Next time I will buy vegetables I will look for aquaponically grown vegetables. 1.000 0.641 S2. When deciding between conventionally farmed fish and aquaponically farmed fish I
would choose aquaponic fish. 1.000 0.721
S5. I would choose aquaponics fish even if they would cost more. 1.000 0.651 S7. Aquaponics is the answer to a more sustainable food production. 1.000 0.467
Total Variance Explained
Component Initial Eigenvalues Extraction Sums of Squared Loadings Total % of Variance Cumulative % Total % of Variance Cumulative %
1 2.480 62.011 62.011 2.480 62.011 62.011
2 0.687 17.175 79.186
3 0.485 12.123 91.309
4 0.348 8.691 100.000
Extraction Method: Principal Component Analysis (PCA).
Component Matrixa
Statement
Component 1 S1. Next time I will buy vegetables I will look for aquaponically grown vegetables. 0.801 S2. When deciding between conventionally farmed fish and aquaponically farmed fish I would
choose aquaponic fish. 0.849
S5. I would choose aquaponics fish even if they would cost more. 0.807 S7. Aquaponics is the answer to a more sustainable food production. 0.683
Extraction Method: Principal Component Analysis (PCA). a1 component extracted.
Appendix D
Regression analysis: Attitudes about aquaponics produce
Model Summary
Model R R Square Adjusted R Square Std. Error of the Estimate
1 0.327a 0.107 0.097 0.71506
aPredictors: (Constant), Q10: Finally, just a few short questions. Q10a: How old are you? Index_behaviour, Are you in charge of your weekly purchase? Are you female? Q10f: What is your monthly income?
ANOVAa
Model Sum of Squares Degrees of Freedom Mean Square F Sig.
1
Regression 27.795 5 5.559 10.872 0.000b
Residual 232.649 455 0.511
Total 260.444 460
aDependent Variable: Index_aquaponic;bPredictors: (Constant), Q10: Finally, just a few short questions. Q10a: How old are you? Index_behaviour, Are you in charge of your weekly purchase? , Are you female? Q10f: What is your monthly income? Coefficientsa Model Unstandardized Coefficients Standardized Coefficients t Sig. B Std. Error β 1 (Constant) 2.088 0.150 13.946 0.000 Index_behaviour 0.290 0.043 0.305 6.678 0.000
Are you in charge of your weekly purchase? −0.007 0.073 −0.004 −0.092 0.926
Are you female? 0.093 0.073 0.062 1.271 0.205
Q10f: What is your monthly income? 0.024 0.024 0.056 1.002 0.317 Q10: Finally, just a few short questions.
Q10a: How old are you? −0.033 0.015 −0.124 −2.225 0.027 aDependent Variable: Index_aquaponic.
References
1. Somerville, C.; Cohen, M.; Pantanella, E.; Stankus, A.; Lovatelli, A. Small-Scale Aquaponic Food Production Integrated Fish and Plant Farming. FAO Fisheries and Aquaculture Technical Paper No. 589. 2014. Available online: http://www.fao.org/3/e46b3cd1-2bd1-4b90-9bea-af856a75bb03/i4021e.pdf (accessed on 12 October 2016).
2. Thorarinsdottir, I.R. Aquaponics Guidelines, University of Iceland: Iceland. 2015. Available online: http://skemman.is/en/stream/get/1946/23343/52997/1/Guidelines_Aquaponics_20151112.pdf (accessed on 10 September 2016).
3. Goddek, S.; Delaide, B.; Mankasingh, U.; Ragnarsdottir, K.V.; Jijakli, H.; Thorarinsdottir, R.I. Challenges of sustainable and commercial aquaponics. Sustainability 2015, 7, 4199–4224. [CrossRef]
4. Joly, A.; Junge, R.; Bardocz, T. Aquaponics business in Europe: Some legal obstacles and solutions. Ecocyles 2015, 1, 3–5. [CrossRef]
5. European Commission Regulation (EC) No. 889/2008. 2008. Available online: http://eur-lex.europa.eu/ LexUriServ/LexUriServ.do?uri=OJ:L:2008:250:0001:0084:en:PDF (accessed on 13 March 2016).
6. European Commission Regulation (EC) No. 710/2009. 2009. Available online: http://eur-lex.europa.eu/ LexUriServ/LexUriServ.do?uri=OJ:L:2009:204:0015:0034:EN:PDF (accessed on 13 March 2016).
7. European Commission. NACE Rev. 2—Statistical classification of economic activities in the European Community, Luxembourg: Office for Official Publications of the European Communities. 2008. Available online: http://ec.europa.eu/eurostat/documents/3859598/5902521/KS-RA-07-015-EN.PDF (accessed on 12 January 2016).
8. Dos Santos, M.J.P.L. Segmenting farms in the European Union. Agric. Econ. 2013, 59, 49–57.
9. Rakocy, J.E.; Masser, M.P.; Losordo, T.M. Recirculating Aquaculture Tank Production Systems: Aquaponics—Integrating Fish and Plant Culture, SRAC Publication No. 454. 2006. Available online: http://www2.ca.uky.edu/wkrec/454fs.PDF (accessed on 13 March 2016).
10. United States Department of Agriculture, Rules and regulations, Organic. Available online: https://www. ams.usda.gov/rules-regulations (accessed on 24 April 2016).
11. Falguera, V.; Aliguer, N.; Falguera, M. An integrated approach to current trends in food consumption: Moving toward functional and organic products? Food Control 2012, 26, 274–281. [CrossRef]
12. Basha, B.M.; Mason, C.; Shamsudin, F.M.; Hussain, I.H.; Salem, A.M. Consumers’ attitude towards organic food. Procedia Econ. Financ. 2015, 31, 444–452. [CrossRef]
13. Tokunaga, K.; Tamaru, C.; Ako, H.; Leung, P. Economics of small-scale commercial aquaponics in Hawai’i. J. World Aquac. Soc. 2015, 46, 20–32. [CrossRef]
14. Love, D.C.; Fry, J.P.; Li, X.; Hill, E.S.; Genello, L.; Semmens, K.; Thompson, R.E. Commercial aquaponics production and profitability: Findings from an international survey. Aquaculture 2015, 435, 67–74. [CrossRef] 15. Engle, C.R. Economics of Aquaponics; SRAC Publication no. 5006; Southern Regional Aquaculture Center: Stoneville, MS, USA, 2015; Available online: https://www.cabdirect.org/cabdirect/abstract/20153364734 (accessed on 23 January 2017).
16. Savidov, N. Evaluation and development of aquaponics production and product market capabilities in Alberta. Ids Initiatives Fund Final Report Project #679056201. Crop Diversification Centre South. 2004. Available online: http://cichlidfish.net/Ebooks/CA-04-01-001.pdf (accessed on 12 April 2016).
17. Bunyaviroch, C. Aquaponic Systems in Puerto Rico: Assessing Their Economic Viability. Ph.D. Thesis, Worcester Polytechnic Institute, Worcester, MA, USA, 2013. Available online: https://web.wpi.edu/Pubs/E-project/Available/E-project-050413-220418/unrestricted/Aquaponic_ Systems_in_Puerto_Rico_Assessing_Their_Economic_Viability.pdf (accessed on 15 September 2016). 18. Hu, Z.; Lee, W.J.; Chandran, K.; Kim, S.; Brotto, C.A.; Khanal, S.K. Effects of plant species on nitrogen
recovery in aquaponics. Bioresour. Technol. 2015, 188, 92–98. [CrossRef] [PubMed]
19. Tokunaga, K.; Tamaru, C.; Ako, H.; Leung, P. Economics of Commercial Aquaponics in Hawaii; University of Hawaii: Manoa, HI, USA, 2013. Available online: http://www.ctsa.org/files/publications/ HawaiiAquaponicsEconomics_Nov13.pdf (accessed on 20 May 2016).
20. Tamin, M.; Harun, A.; Estim, A.; Saufie, S.; Obong, S. Consumer Acceptance towards Aquaponic Products. OSR J. Bus. Manag. 2015, 17, 49–64.