BJRS
BRAZILIAN JOURNAL
OF
RADIATION SCIENCES
07-02B (2019) 01-13 ISSN: 2319-0612 Accepted: 2019-07-09Neutronic analysis of a fuel element with variations in
fuel enrichment and burnable poison
R. B. de Faria; F. Martins, C. E. Velasquez, F. Cardoso, A. Fortini and C. Pereira
Departamento de Engenharia Nuclear – Escola de Engenharia Universidade Federal de Minas Gerais (UFMG)
Avenida Antonio Carlos, 6627, Campus Pampulha, PCA1, CEP. 31270-901, Belo Horizo nte, MG, Brazil.
[email protected], [email protected]
ABSTRACT
In this work, the goal was to evaluate the neutronic behavior during the fuel burnup changing the amount of burnable poison and fuel enrichment. The analyses used a 17 x 17 PWR fuel element, simulated using the 238 groups library cross-section collapsed from ENDF/BVII.0 and TRITON module of SCALE 6.0 code system. The results confirmed the effective action of the burnable poison in the criticality control, especially at Beginning Of Cycle (BOC) and in the burnup kinetics, because at the end of the fuel cycle there was a minimal residual amount of neutron absorbers (155Gd and 157Gd), as expected, showing the burnup of the Gd in the simulation methodology adopted. Furthermore, the results show that increasing the Gd insertion percentage does not change its final residual amount. At the end of the cycle, the fuel element was still critical for all the simulated situations, which indicates the possibility of extending the fuel burnup.
The burnable poison (or simply poison) is a substance, which has a high neutron absorption cross-section, which reduces the reactivity of a reactor core [1]. These neutron absorbers are chosen because they transmute by neutron capture into isotopes with low capture cross sections, somewhat faster than fuel burnup, thus leaving a residual minimum amount of burnable poison at the end of the fuel cycle [2]. Such characteristics of burnable poison improve fuel utilization, contributing to a more homogeneous power distribution into the reactor core and are able to control nuclear reactivity.
Burnable poisons are rare on earth and they are particularly useful for the control of nuclear reactivity, among which are the elements Samarium (Sm), Europium (Eu), Dysprosium (Dy), Erbium (Er) and Gadolinium (Gd).
The presence of burnable poison in adequate amounts reduces the use of control rods [3]. This practice reduces the amount of actinides and fission products, and does not change the thermal conductivity [4]. The burnable poisons remove neutrons by absorption and thus effectively reduce the excess of reactivity in the nuclear core. This effect is generally desirable at BOC, due to the excess of reactivity at load the core with fresh fuel, being necessary a high concentration of burnable poisons. The best way to improve the fuel utilization is based on the burnup extension and poison kinetics at BOC, since the lowest remaining residual concentration of the burnable poison is expected at the end of the cycle in order to stop neutrons absorption and to reduce any core excess reactivity.
Cochran and Tsoufanidis (1999) [5] reported that gadolinium (Gd) seems to be more attractive because it can be mixed directly with UO2. It has several isotopes and the natural abundance of 155Gd and 157Gd are 14.7% and 15.7%, respectively. Their absorption cross sections for thermal
neutrons are 5.8x10⁴ and 2.4x10⁵ barns, respectively.
A relevant way to improve nuclear fuel efficiency is using Gd by enriching the percentage of natural isotopes 155Gd and 157Gd [6]. This enrichment can eliminate the presence of parasite absorber at EOC [7]. Although Schlick (2001) [8] reported that the contribution of Gd2O3 in values
close to 2% does not affect the thermal conductivity of the fuel, it is known that the amount used in PWR is generally higher than these values.
The aim of this work was to evaluate the neutronic behavior during burnup changing the amount of burnable poison and fuel enrichment. Neutronic parameters such as infinite multiplication factor and composition of burnable poison have been analyzed during burnup and at EOC. The gadolinium pins were simulated in a homogeneous mixture with uranium oxide (UO2) containing
0.2% of 235U and with different proportions of gadolinium in the mixture of UO
2 + Gd2O3, 4, 6 and
8%. Two enrichment, one of 3.25% and other of 4% of 235U.
2. METHODOLOGY
2.1. Description of the modeled system
The simulations were carried out considering a Pressurized Water Reactor (PWR) fuel element arranged on an assembly of 17 x 17, with a central guide tube, totalizing 24 guides tubes [9], without boron dilution. This fuel assembly was simulated for two different cases: one without Burnable Poison Rods (BPR) and the other with 16 BPR. The rods of UO2 have different
enrichments as described in Table 1, according to the literature [9 and 10]. For the benchmark fuel element analysis was used the nuclear code SCALE 6.0 [11], although 238 groups collapsed from ENDF/BVII.0 library of cross section [12].
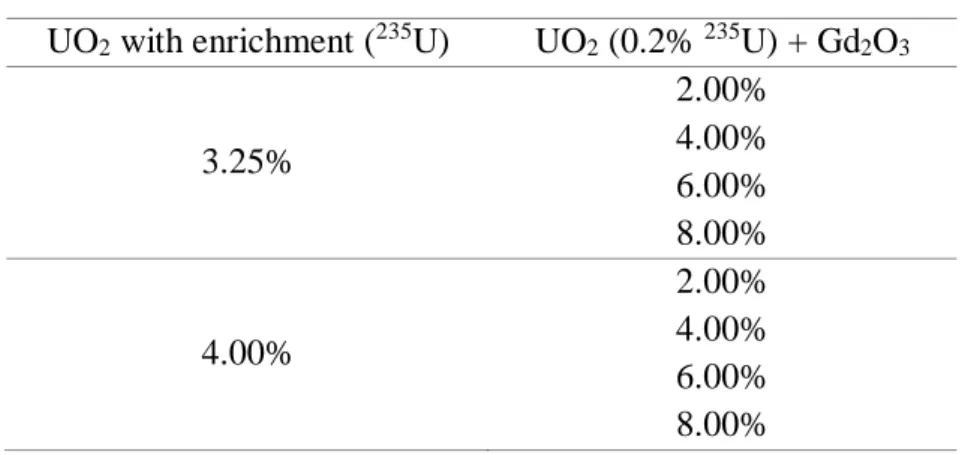
Table 1: Fuel rods and 16 Burnable Poison Rods
UO2 with enrichment (235U) UO2 (0.2% 235U) + Gd2O3 3.25% 2.00% 4.00% 6.00% 8.00% 4.00% 2.00% 4.00% 6.00% 8.00%
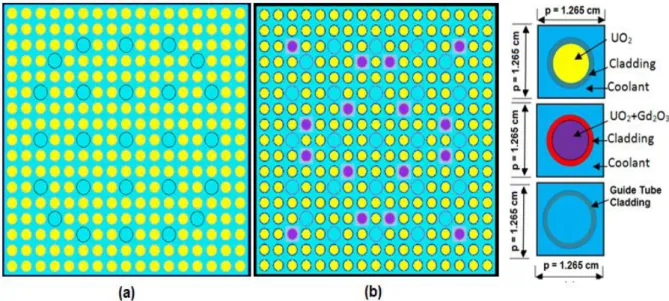
Figure 1 shows fuel rod assembly with guide tubes, with 16 BPR, and without BPR, and was generated using the SCALE 6.0 code. To calculate the infinite multiplication factor (kinf), the
geometry of the bundle model was reflected from all sides. In this way, neutrons are not allowed to escape from the system. Figure 2 shows pellets fuel, fuel rod, and fuel element.
Figure 1: (a) Fuel rod assembly geometry with the guide tube and without BPR. (b) Fuel rod
assembly geometry with the guide tube and 16 BPR.
Figure 2: Pellets fuel and rod with stacked pellets.
Table 2 presents other parameters used in modeling of the fuel element according to the literature [9], considering the number of BPR inserted.
Table 2: Fuel element parameters
DESCRIPTION VALUE
Active length fuel Rod 365.7 cm
Active length guide tube 365.7 cm
Fuel radius 0.412660 cm
Radius cladding fuel (Zircaloy) 0.474364 cm Radius coolant inside guide tube 0.572940 cm
Radius guide tube 0.613010 cm
Pitch (p) rods 1.265 cm
Pitch fuel elemento 21.505 cm
Fuel temperature (Zircaloy) 873 K
Burnable Poison Rods WBPR and 16*
Cladding temperature (Zircaloy) 673 K
Coolant temperature 573 K
Power concentration 38 W/gU
*changes made relative to reference [9]
Using the same methodology and maintaining the same geometry, 16 rods of UO2 were replaced by
burnable poison. The first case studied the arrangement without BPR and the second one with 16 BRP, with different gadolinium percentages 2.00%, 4.00%, 6.00% and 8.00%, as mentioned in Table 1.
2.1. Simulations: fuel depletion with SCALE 6.0
The SCALE code estimates the infinite multiplication factor (kinf) with the respective standard
deviation of the model (σST). This works aimed to evaluate: (a) the criticality of the system with
different enrichments and different percentages of burnable poison during fuel depletion and (b) the impacts of burnable poison in the kinf.
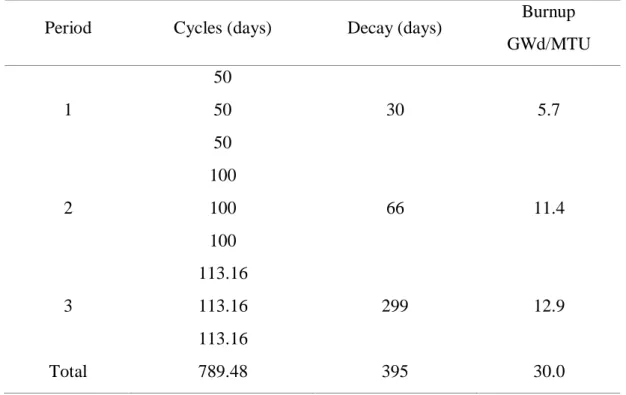
For fuel depletion calculation, TRITON module [14] was used through T6-depl command with 10000 particles and 2200 generations. The library ENDF/BVII.0 was used with 238 collapsed groups (V7-238), because it presents less deviation from the average, besides being able to be used in the calculations during fuel evolution [15]. The specific power density was 38 W/gU during 789.48 days, producing an overall burnup of 30 GWd/tHM [9]. To analyze the burnup and the impact of burnable poison in the reactivity, the time was divided into small intervals, including periods of decay, as shown in Table 3.
Table 3: Division of the period of burnup and decay of fuel
Period Cycles (days) Decay (days) Burnup
GWd/MTU 1 50 50 50 30 5.7 2 100 100 100 66 11.4 3 113.16 113.16 113.16 299 12.9 Total 789.48 395 30.0
Equation 1 was used to calculate the absolute difference (Abs.diff.) of infinite multiplication factor values of simulated fuel element without insertion of burnable poison (kinfWBP) and with the
insertion of burnable poison (kinfBP):
(
)
5 inf infWBP10
k
(pcm)
diff.
.
=
−
k
BP
Abs
equation (1)During fuel evolution, infinite multiplication factor (kinf) was compared as a function of gadolinium,
highest absorption cross section for thermal neutrons equal to 5.8.104 and 2.4.105 barns, respectively [5].
3. RESULTS AND DISCUSSION
Figures 3 and 4 show the variations of kinf values changing fuel enrichment and proportion burnable
poison. The standard deviation estimated by the used code has a magnitude of 10–4. All cases, the main difference between graphics is predominant at the Beginning Of Cycle (BOC), period of effective action of the burnable poison.
It is important to emphasize that the value of kinf is always lower in all simulations, during the
period when there is a higher concentration of burnable poison, as shown in Figures 3 and 4. This allows the reduction of control rods at the Beginning Of Cycle (BOC).
Figures 3 and 4 show another relevant fact, the evolution of kinf values began to have the same
profile of the fuel element Without Burnable Poison (WBP) from 14.0 GWd /MTU, suggesting the possibility of fuel burnup extension, since the fuel element is still critical.
Figures 3 and 4 also show a sharp decrease in kinf value and some peaks at different burnup points,
which can be justified by the analysis of the gadolinium isotopes 155Gd and 157Gd evolution during
burnup, as shown in Figures 5 and 6. The kinf curve variations move from 2.0 GWd/MTU to 14.0
GWd/MTU for the fuel with uranium enrichment at 3.25%, and from 2.0 GWd/MTU to 16.0 GWd/MTU for the fuel with uranium enrichment at 4%. where all simulated cases with Gd2O3
insertion have the same linear profile and parallel to the simulated cases without insertion of burnable poison. This behavior shows that increasing the Gd insertion percentage, there is a displacement of the return point to the behavior of the curve without gadolinium, showing the effectiveness of the burnable poison until approximately by half of the burnup. Nevertheless, the increase of Gd insertion percentage does not change its final residual amount.
Figure 3: Comparison of infinite multiplication factor with 3.25% enrichment of 235U.
Figure 4: Comparison of infinite multiplication factor with 4.00% enrichment of 235U.
Table 4 shows the initial and final composition of 155Gd and 157Gd, during fuel burnup. As observed the final amount is small compared to one at BOC.
Table 4: Compositions in grams of 155Gd and 157Gd in BOC and EOC
1,0000 1,0500 1,1000 1,1500 1,2000 1,2500 1,3000 1,3500 1,4000 1,4500 1,5000 0 2 4 6 8 10 12 14 16 18 20 22 24 26 28 30
k
inf Burnup (GWd/MTU) 235U(3.25%) without Gd2O3 2%Gd2O3 4%Gd2O3 6%Gd2O3 8%Gd2O3 1,0000 1,0500 1,1000 1,1500 1,2000 1,2500 1,3000 1,3500 1,4000 1,4500 1,5000 0 2 4 6 8 10 12 14 16 18 20 22 24 26 28 30k
inf Burnup (GWd/MTU) 235U(4.00%) without Gd2O3 2%Gd2O3 4%Gd2O3 6%Gd2O3 8%Gd2O3UO2 with enrichment (235U) UO2 (0.2% 235U)+Gd 2O3 Compositions (g) 155Gd Compositions (g) 157Gd
BOC EOC BOC EOC
3.25% 2.00% 4.00% 6.00% 8.00% 230.8 459.8 687.2 912.8 0.3885 0.4861 0.5847 0.6840 244.0 486.2 726.6 965.2 0.1499 0.2042 0.2517 0.2941 4.00% 2.00% 4.00% 6.00% 8.00% 237.9 474.0 704.8 941.1 0.3748 0.4830 0.5908 0.7002 251.5 501.2 749.1 995.1 0.1522 0.2150 0.2677 0.3154
Figure 5 and Fig. 6 show the behavior of 155Gd and 157Gd during burnup and can be related to the intervals of kinf values. As expected, the gadolinium amount decreased. 155Gd and 157Gd after the
total burnup are still present, but in much smaller quantities than those present at BOC. The 155Gd level reached a stable amount near of burnup of 15.0 GWd/MTU, while regarding to157Gd, this
occurred near to burnup 10.0 GWd/MTU.
Figure 5: Behavior of 155Gd with 235U enriched to 3.25% and 4.0%, without Gd2O3 and with
variations of Gd2O3 of 2%, 4%, 6% and 8%, during burnup.
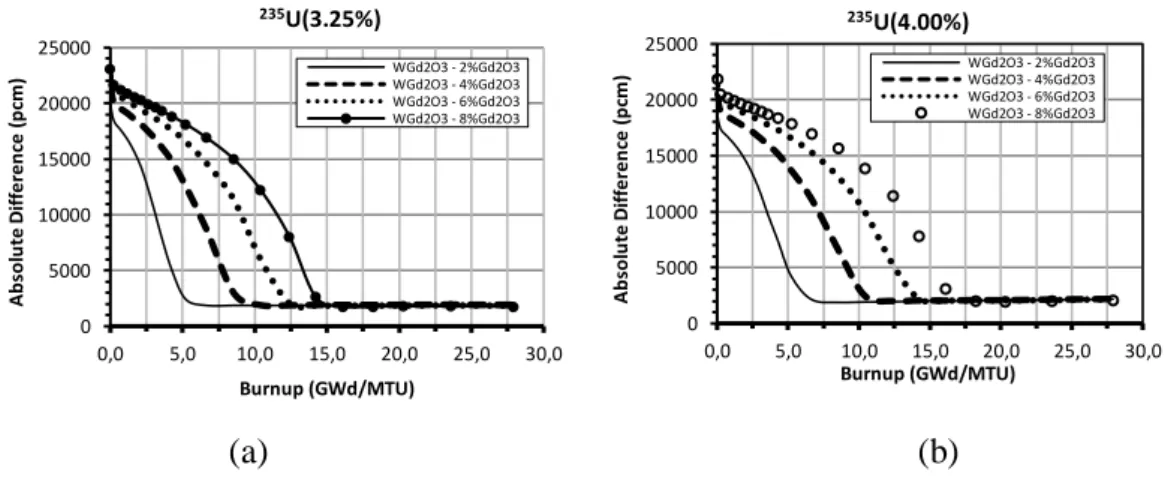
Fig. 7 shows the absolute difference between the kinf values with the enriched fuel for 3.25%,
4.00%, and Gd2O3 variations. The biggest absolute difference throughout burnup occurs in the
range of 0.0 to 15.0 GWd/MTU, where it has a higher amount of burnable poison acting. From this interval the behavior is stable and it is no longer possible to identify any difference. Thus indicating, that there is only a residual quantity of burnable poison in comparison with the amount inserted at the beginning of the cycle.
Figure 7: (a) Absolute difference between kinf values with fuel enriched to 3.25% and with
variations of Gd2O3 and (b) absolute difference between kinf values with fuel enriched to 4.00% and
with variations of Gd2O3 (a) (b) 0 5000 10000 15000 20000 25000 0,0 5,0 10,0 15,0 20,0 25,0 30,0 A b so lu te D if fe re n ce (p cm ) Burnup (GWd/MTU) 235U(3.25%) WGd2O3 - 2%Gd2O3 WGd2O3 - 4%Gd2O3 WGd2O3 - 6%Gd2O3 WGd2O3 - 8%Gd2O3 0 5000 10000 15000 20000 25000 0,0 5,0 10,0 15,0 20,0 25,0 30,0 A b so lu te D if fe re n ce (p cm ) Burnup (GWd/MTU) 235U(4.00%) WGd2O3 - 2%Gd2O3 WGd2O3 - 4%Gd2O3 WGd2O3 - 6%Gd2O3 WGd2O3 - 8%Gd2O3
4. CONCLUSION
This neutronic study confirmed the importance of burnable poison in the control of reactivity without the use of control rods, especially at the beginning of the cycle, when there is the greatest excess of reactivity during all the burnup.
This study showed that the consumption of burnable poison does not occur homogeneously, because, at the end of the cycle, there is a larger amount of 155Gd, not maintaining the observed
proportion at the beginning of the cycle.
This neutronic analysis confirmed that there was good synchrony in the burnup kinetics of the burnable poison, even with the different percentages used, as it presented at the end of the cycle a residual amount comparable to the simulations without the insertion of burnable poison. Nevertheless, the increase of Gd insertion percentage does not change its final residual amount.
The next study is to make comparisons of results with other nuclear codes, such as MCNP-X and Monteburns, to increase fuel enrichment, make burns higher than that of this study, vary the amount of burnable poison rods, simulate the fuel element with the use of burnable poison enriched, in order to verify its efficiency.
The goal will be:
- to compare the values of kinf and actinides generated when the control rods are moved, with
the values using the different percentages and amounts of burnable poison rods;
- to establish the best combination of the use of control rods, the percentage, and quantity of burnable poison rods and actinide generation;
- to simulate the core of a PWR reactor with the best combinations of use of control rods and burnable poison.
5. ACKNOWLEDGMENT
The authors are grateful to the Brazilian research funding agencies, Coordenação de Aperfeiçoamento de Pessoal de Nível Superior - CAPES, Comissão Nacional de Energia Nuclear - CNEN, Conselho Nacional de Desenvolvimento Científico e Tecnológico -CNPq (Brazil), and Fundação de Amparo a Pesquisa do Estado de Minas Gerais -FAPEMIG (MG/Brazil) for the support.
REFERENCES
1. CNEN-NE-1.27, INSTALAÇÕES NUCLEARES, “Garantia de Qualidade na aquisição, projetos e fabricação de elementos combustíveis”, Rio de Janeiro, Resolução 02/95, Publicação D.O.U. 01/09/95, Resolução 15/95, Publicação D.O.U. 21/09/99.
2. DUDERSTADT, JAMES J.; HAMILTON, LOUIS J., Nuclear Reactor Analysis, JohnWiley & Sons, Inc., New York, 1976.
3. WAGNER, J. C.; PARKS, C.V., “Parametric Study of the Effect of Burnable Poison Rods for PWR Burn up Credit”, NUREG/CR-6761, ORNL/TM-2000/373, Oak Ridge National Laboratory, (2002).
4. IWASAKI, KOUTA.; MATSUI.; YANAI, KOICHI.; YUDA, RYOUICHI.; ARITA, YUJI.; NAGASAKI, TAKANORI.; YOKOYAMA, NOBORU.; TOKURA, ICHIRO.; UNE, KATSUME.; HARADA, KENICHI, “Effect of Gd2O3 Dispersion on the Thermal
Conductivity of UO2”, Journal of Nuclear Science and Technology, Vol. 46, number 7, pag.
673-676 (2009).
5. COCHRAN, ROBERT.; TSOUFANIDIS, NICHOLAS., The nuclear fuel cycle: analysis
and management. 2nd ed., American Nuclear Society, 1999, La Grange Park, Illinois, USA.
6. YILMAZ, SERKAN.; IVANOV, KOSTADIN.; LEVINE, SAMUEL.; MAHGEREFTEH, MOUSSA., “Development of enriched Gd-155 and Gd-157 burnable poison designs for a PWR core”, Annals of Nuclear Energy 33 439-445 (2006).
7. BEJMER, KLAES-HåKAN.; SEVEBORN, OLA, “Enriched Gadolinium as Burnable Absorber for PWR”, La Grange Park : American Nuclear Society, Lagrange Park, IL, 25-29 de April de 2004, PHYSOR 2004 – The Physics of Fuel Cycles and Advanced Nuclear Systems: Global Developments Chicago, Illinois.
8. SCHLIECK, M.; BORGER, H. –D.; NEUFERT, A., “Optimized gadolinia concepts for advanced in core fuel management in PWRs”. Nuclear Engineering Designs 205, 191-198, (2001).
9. OECD, Organisation for Economic Co-Operation and Development. “Burn-up Credit Criticality Benchmark - Phase II-D - PWR-UO2 Assembly Study of Control Rod Effects on
Spent Fuel Composition”, NEA Nº 6227, ISBN: 92-64-02316-X, France, (2006).
10. DAVID BERNARD and ALAIN SANTAMARINA, “Qualification of gadolinium burnable poison: Interpretation of MELUSINE/GEDEON-II spent fuel analysis”, Annals of Nucler
11. S. M. Bowman, KENO-VI Primer: “A Primer for Criticality Calculations with SCALE/KENO-VI Using GeeWiz”. Oak Ridge, Tennessee, USA: ORNL/TM-2008/069 (2008).
12. BOWMAN, S. M. e DUNN, M. E. SCALE Cross-section Libraries, Oak Ridge, Tennessee, USA: ORNL/TM-2005/39, Version 6, Vol. III, Sect. M4 (2009).
13. http://www.inb.gov.br/ptbr/WebForms/Interna2.aspx?secao_id=58. Last access (2013).
14. M. D. DEHART. TRITON: “A Two-dimensional Transport and Depletion Module for Characterization of Spent Nuclear Fuel”. Oak Ridge, Tennessee, USA : ORNL/TM-2005/39, Version 6, Vol. I, Sect. T1 (2009).
15. FARIA, ROCHKHUDSON BATISTA DE. Carbeto de silício reforçado com fibras de Hi-Nicalon tipo S como revestimento de reatores PWR – avaliação neutrônica/Rochkhudson Batista de Faria – 2017. Tese (doutorado) Universidade Federal de Minas Gerais, Escola de Engenharia.
![Table 2 presents other parameters used in modeling of the fuel element according to the literature [9], considering the number of BPR inserted](https://thumb-eu.123doks.com/thumbv2/123dok_br/18280739.881643/5.892.193.703.262.757/presents-parameters-modeling-element-according-literature-considering-inserted.webp)