BJRS
RADIATION SCIENCES
07-2B (2019) 01-20ISSN: 2319-0612 Accepted: 2019-04-22
A CFD analysis of blockage length on a partially blocked fuel rod
N.L. Scuro
a*; P.E.
Umbehaun
a; E.Angelo
b; G.Angelo
a,c; D.A.Andrade
aaInstituto de Pesquisas Energéticas e Nucleares (IPEN / CNEN - SP)- Centro de Engenharia Nuclear
Av. Professor Lineu Prestes 2242 - 05508-000 São Paulo, SP
b Universidade Presbiteriana Mackenzie - Escola da Engenharia – Grupo de Simulação Numérica
Rua da Consolação, 896 Prédio 6 - 01302-907 São Paulo, SP
cCentro Universitário FEI - Departamento de Engenharia Mecânica
Av. Humberto de Alencar Castelo Branco, 3972-B - 09850-901 São Paulo, SP [email protected]
ABSTRACT
After a loss of coolant accident (LOCA), fuel rods may balloon. The swelling can partially block the flow channel, affecting the coolability during reflood phase. In order to analyze the influence of blockage length, using a radial block-age of 90%, varying just the blockblock-age length, many steady state numerical simulations has been done using Ansys-CFX code to verify thermal-hydraulic properties according to different forced cooled conditions. Temperature peaks are observed on cladding, followed by a temperature drop. A 5x5 fuel assembly, with 9 centered ballooned fuel rod, flow redistribution inside channels can also be captured, indicating an overheating zone. Therefore, this study conclude, for the same boundary conditions, the longer the blockage length originated after LOCA events, the higher are the clad temperatures, indicating the possibility of overheat during transient conditions on reflood.
1. INTRODUCTION
Loss of coolant accidents (LOCA) in PWR nuclear reactors may affect the coolability of fuel as-semblies. During this accident, fuel rods can overheat, accelerating the production of gases and sol-id products. With the high temperatures, the fission products increase the internal pressure of the fuel rod, increasing volumetric expansion of uranium fuel. It is known that during LOCA events, reactor vessel can be quickly depressurized. With both conditions, the fuel rod have a great pressure difference between internal and external boundaries. Thus, fuel rod can balloon, resulting in a radial and length deformation.
Emergency systems are responsible for refill reactor core with subcooled water. This situation per-sists until situation is controlled. The refilling and reflooding phase guarantee that fuel elements wont overheat, which means, considering PWR reactor that uses zirconium cladding, temperature on this surface can’t reach 1200°C to avoid hydrogen production.
Many studies using thermo-hydraulic programs investigate transient reflood phase, among them, [1] presents an experimental 7x7 assembly heated electrically from a pseudo-cossenoinal axial power density that, after reflood, it is possible to reach a safe steady-state after LOCA.
However, during reflood phase fuel rods can balloon, affecting capacity to reach security levels at the same time interval. To analyze such situations, programs as SEFLEX is presented by [2], to show the influence of non-blockage and partially blocked fuel rods using three different gases be-tween fuel and the clad. Due the number of results, it is possible to affirm that 90% partially blocked geometry presented highest clad temperatures when compared from a non-blockage ge-ometry. Thus, these results showed a safety limit from the maximum designed to real applications. Thus, an experimental fluid-dynamic study, divided into three papers was accomplished to evaluate the influence of partially blocked channels for a 7x7 fuel assembly. For the first paper, [3] used a 4x4 blocked region with a quarter of total length as blocked length. Characterizing a large break loss of coolant accident (LBLOCA), the study showed large drops in velocity inside some blocked regions. For other channels, the flow could reach the steady-state form, which lead to an expressive increase of internal velocity, following by an abrupt drop, approximating the velocity to the initial condition.
For the second paper, [4] verified the influence of a 62% coplanar radial blockage, with a blockage length smaller than used in [3]. The results showed an average increasing of 25% in velocity when compared to the average velocity in non-blocked channels. An important result is the non-constant mass flow through blocked channels, reaching values 50% less than other normal channels, which means that non blockage fuel rods has an increment on mass flow.
For the last paper, [5] tested for a 62% non-coplanar blockage at the same conditions tested in [4] and have not found any different result, or, expressive change in fluid-dynamic behavior. All exper-iments were compared with the results of the thermo-hydraulic program COBRA [6], showing a good agreement with experimental data.
To contribute with partially blocked investigation, [7] present a great compilation of many thermo-hydraulic programs. Among them, FEBA [8], SEFLEX [2], THETIS [9], ACHILLES [10], CEGB [11] and FLECHT-SEASET [12]. The main objective was to determine the blockage length limit for fuel rods after LOCA events. The results showed that, even with severe radial blockage (90%), with a blockage length minor than 100mm, these parameters could not affect directly the coolability of the fuel rod. Nevertheless, for blockage lengths longer than 150mm, with radial blockage greater than 80%, it was possible to observe that during reflood phase high surface temperatures over clad-ding is present, which could affect the reactor security. The study did not consider fuel relocation. The fuel relocation phenomena can lead for a different axial power density. To analyzed experimen-tally the influence, [13] tested a 5x5 assembly, with 9 partially blocked fuel rods, using a cossenoinal axial power density. The temperature peaks presented inside ballooned fuel rods were smaller when compared to a normal rod. As the ballooned region increased turbulence inside the flow channel, the increase of heat transfer coefficient, lead to minor temperatures. When the fuel relocation was considered, higher temperatures were observed when compared to normal fuel rods. In order to analyze the influence of blockage length as the main factor in fuel rod coolability, [14] tested for a 90% radial blockage, for a 2x2 electrically heated two different blockage lengths. With constant mass flow inside blockage channels, the results indicated that, independently from the ge-ometry and reflood velocity used in the study, it is possible to reach a secure steady-state condition, but the time to reach it can be committed.
To validate fluid dynamics analysis, CFD technique showed to be an excellent tool to obtain flow properties, as turbulence behavior and eddy dissipation. To validate all data, laser used in [15] and [16] and are one of the most modern alternatives.
As discussed, the reflood phase in PWR nuclear reactors contains a two-phase flow during initial conditions after emergency actions from LOCA prevention. Due to the numerous factors that can originate a LOCA event, it is very difficult to predict the ballooned resulting geometry.
Therefore, this study presents a numerical analysis utilizing the Ansys-CFX commercial code to evaluate the influence of the blockage length inside fuel rods. Using similar boundary conditions and geometry as used in [14]. The main objective is capture many turbulence effects originate by ballooned regions, even with 90% radial swelling. Thermal gradient inside fuel rods, as well as the cladding temperature and a secondary analysis, to show flow redistribution with many ballooned fuel rods.
2. MATERIALS AND METHODS
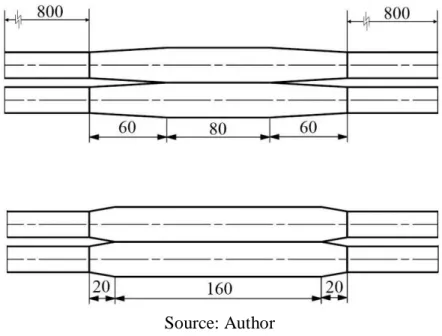
Numerical simulations based on a 2x2 assembly are designed inside a closed channel. For correct understanding the simulated geometry, Figure 1 shows the top view. The geometry is twice the size of a regular PWR fuel rod.
Figure 1: Top view of fuel rods
Fuel rods has 1800mm length, where, the ballooned region was constructed in the middle of the geometry. Both partially blocked regions are illustrated in Figure 2. Nevertheless, the short and long blockage length has twice the size of a regular PWR fuel rod.
Due to the lack of alignment with the objectives of this study, the spacer-grids were not included in the simulated geometry. As it is known from the study of [17], these elements require a great num-ber of volumetric elements to correctly simulate its fluid-dynamics effects. Thereby, it is already possible to predict the pressure drop for each spacer-grids located in the fuel assembly.
Figure 2: Short and long blockage geometries
Source: Author
3. CFD ANALYSIS OF FUEL ROD BUNDLE
The commercial code, Ansys-CFX, was utilized in the numerical simulations, where, all water properties were corrected by IAPWS (International Association for the Properties of Water and Steam) [18]. For the solid region, all properties from the commercial steel INCONEL® Alloy 600 was considered.
3.1. TURBULENCE MODEL: TWO EQUATIONS MODEL k-ε
In this study, the turbulence model k-ε were chosen due to its stability and computational time re-quired for each simulation. Another factor is its major use in literature, [19].
Considering the Buossinesq’s hypothesis Equation (1), the k-ε model includes two transport equa-tions, so that, it can calculate the average Reynolds stress tensor. One for turbulent kinetic energy (k), shown in Equation (2) and turbulent dissipation (ε) presented in Equation (3).
(1)
(2) (3)
As, Pk is the term of production of turbulent kinetic energy Equation. (4).
(4) To equalize the number of incognitos with expressions utilized in the turbulence model, the rela-tionship between the turbulent dynamic viscosity, turbulent kinetic energy and dissipation rate of turbulent kinetic energy is presented in Equation (5).
(5)
Constant values for this turbulence model, , , , , are respectively equal to 1.44 , 1.92 , 0.09 , 1.0 and 1.3.
4.COMPUTATIONAL DOMAIN
The computational domain was considered bi-symmetric at xz and yz planes due to the reduction in volumetric elements necessary to obtain a correct numeric simulation.
Figure 3 shows the principal regions in the computational domain, among them: (i) fluid domain, (ii) inlet, (iii) outlet, (iv) solid domain (v) ballooned region and other boundary conditions.
Figure 3: Isometric view of principal regions and boundary conditions
Source: Author
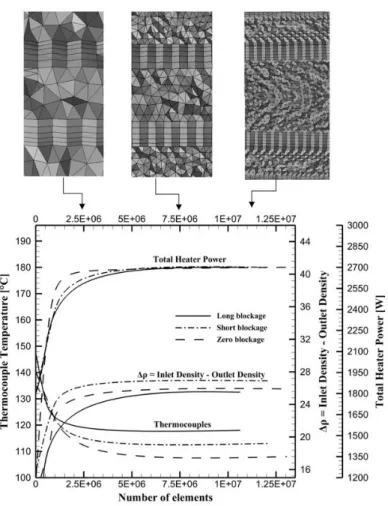
Using the methodology proposed by [20], where, increasing the number of elements by an iteration method, using the same boundary conditions, the resultant error tends to an infinitesimal variation when compared to the previously iteration. Thus, the numerical solution is independent from the mesh. Nevertheless, to verify the numerical convergence for the fluid domain separately, the density difference between inlet and outlet domain was compared to the IAPWS table [18]. For the solid domain, one geometric point was created and named as “Thermocouple”, to illustrate how the same point vary the temperature during convergence.
Figure 4 shows all numerical convergence for the computational domain with three main physical properties. The Total Heat Power is the heat transferred to the fluid domain. This property is capa-ble to show the equilibrium of, inlet density, velocity, specific heat at constant pressure and
tempe-rature difference beyond inlet and outlet. All the presented data is illustrated in Figure 4 as a func-tion of the number of elements. The dotted line shows the point in which the simulafunc-tion reaches the equilibrium used in this paper. As this study considers the heat transfer through the fluid beyond heat generation by solid domain, both have different values for the ideal number of elements. Figure 4 already shows these relations for both domains with the final mesh for each situation of the con-vergence.
For the final explanation for the numerical convergence, all data illustrated in Figure 4 shows the results for the minor inlet velocity and all geometries due to the lowest buoyancy forces. The other boundary conditions converged with the same number of elements.
Figure 4: Numerical convergence for all geometries simulated using 2cm/s as inlet velocity
Source: Author
5. BOUNDARY CONDITIONS
All boundary conditions were divided for each computational domain, one for the solid domain, other for the fluid domain.
For the fluid domain:
(i) Inlet velocity (2cm/s, 2.5cm/s and 3.5cm/s) (ii) Constant inlet temperature (50°C)
(iii) Outlet (1 atm - Absolute pressure) (iv) Symmetry walls
(v) Smooth walls (vi) Gravity at –z
(vii) Interface fluid/solid with heat transfer
For the solid domain:
(viii) Interface solid/fluid with heat transfer (ix) Symmetry walls
(x) Rod walls (xi) Smooth walls
(xii) Subdomain for linear heat generation
The use of gravity at –z lead to a correct calculation for buoyancy forces.
6. CONVERGENCE CRITERIA
The mathematical model used a convergence criteria with error lower than 10^-5 for root mean square (RMS) for the mass, momentum and energy.
7. RESULTS
7.1 VELOCITY ALONG FUEL ROD
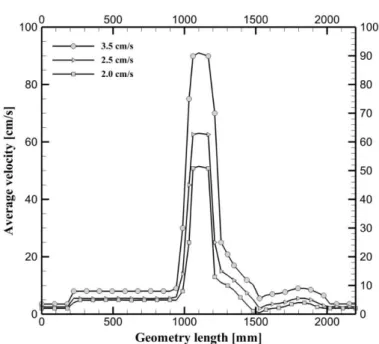
To observe all fluid dynamics behavior originated by partially blocked effect, the average velocity profile is illustrated at Figures 5-7. Figure 5 illustrate the velocity profile for the non-blocked ge-ometries, for all inlet velocities used during simulations. Up to 200mm, the velocity presented is the region of fluid domain without fuel rod. When the fluid enter in contact with fuel rod, the cross sec-tional area is reduced, and the velocity is increased. The inverse behavior occurs at the outlet. For the same region with short and long blockage, all data are illustrated, respectively at Figure 6 and Figure 7. A distinct behavior was observed due the 90% radial blockage. The flow area is great re-duced, creating a zone of high velocity when compared to non-blockage fuel rod. For the short blockage (Figure 6), a velocity peak observed at 1100mm follows a drop. An unstable region ap-peared between 1500mm to 2000mm.
Figure 5: Average velocity for zero blockage
Figure 6: Average velocity for short blockage
Source: Author
A similar behavior was verified for long-blockage (Figure 7), but, due to the size of the blo-ckage length, the boundary layer was completely evolved and created greater velocities peaks, fol-lowing by an abruptly drop. This effect create the same unstable region observed in the short-blockage, but with higher intensity. Furthermore, as the velocity peak was higher when compared to short-blockage, the property was maintained for a longer length, what influenced wall heat transfer coefficient. This issue will be discussed in the next topics.
Figure 6: Average velocity for long blockage
Source: Author
7.2 FUEL ROD TEMPERATURE PROFILES
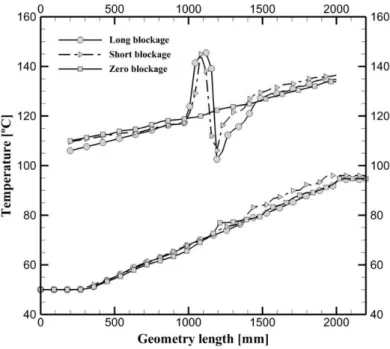
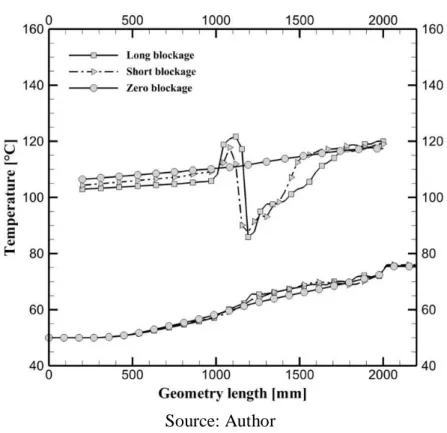
For nuclear power reactors, the center of the fuel rods contemplates the highest temperatures. To analyze all thermo-hydraulic behavior originated by partially blocked effect, all temperature profiles are illustrated at Figure 8- 10. The inlet velocity is presented respectively with 2cm/s, 2.5cm/s and 3.5cm/s.
Figure 8: Thermal behavior for solid/fluid with 2cm/s
Source: Author
Figure 9: Thermal behavior for solid/fluid with 2,5 cm/s
Figure 10: Thermal behavior for solid/fluid with 3,5 cm/s
Source: Author
It is possible to observe that, regardless of inlet velocity, all non-blocked conditions showed a linear and gradual heating along the length. This result is reasonable for the linear heat generation.
For the partially blocked geometries, a temperature peak is observed exactly at the ballooned region (1000mm to 1200mm). The maximum value for temperature did not show great variations between 2cm/s and 2.5cm/s, but when it reaches 3.5cm/s, the highest point drops substantially. To present all data obtained, Table 1 shows all temperature peaks in the center of the computational domain.
Table 1: Temperature Peaks for all geometries 2 cm/s 2.5 cm/s 3.5 cm/s Zero-blockage 120.3 °C 116.8 °C 110.8 °C Short-blockage 145.0 °C 136.9 °C 117.8 °C Long-blockage 145.5 °C 143.0 °C 121.7 °C Source: Author
When non-blockage conditions are compared to partially blocked temperature peaks, it is observed that the greater the blockage length, the greater the center temperature. This effect may be lesser relevant when compared to a higher inlet velocity, as the turbulent effect becomes more evident. Another perceptible effect originated by ballooned effect, is a drop in the temperature locating its minimum value at 1200mm. Table 2 shows all minimum temperatures for the respective location.
Table 2:Minimum central temperatures for all geometries
2 cm/s 2.5 cm/s 3.5 cm/s Zero-blockage 123.4 °C 117.2 °C 111.6 °C Short-blockage 106.0 °C 100.8 °C 87.5 °C Long-blockage 102.6 °C 96.2 °C 85.5 °C
Source: Author
One of the reasons to originate a drop in temperature is the high turbulence effects originated by ballooned region. Figure 10 shows streamlines for 3.5 cm/s for all geometries.
Figure 11: Streamlines for 3.5 cm/s for all geometries
Source: Author
Along fluid flow, the turbulence becomes regular and the fuel rod temperatures become next to non-blockage conditions. To understand how turbulence influenced wall heat transfer coefficient, Figure 12 shows for long blockage the respective property at 3.5cm/s.
Figure 12: Wall heat transfer coefficient for long blockage (3.5cm/s)
Therefore, even with high wall heat transfer coefficient inside ballooned area a presence of high temperatures just reduces its magnitude when inlet velocity is increased. This behaviour must be related to turbulence effects.
However, to analyse a more realistic flow distribution originated by balloned fuel rods, a 5x5 as-sembly, with 3x3 partially blocked fuel rods (Figure 13). The metodology is the same as used in this paper, using 2 cm/s as inlet velocity. However, solid domain was not included due to high number of elements required for a stable analysis.
Figure 13: 5x5 assembly with colored map for velocity
The cross sectional along assembly shows the mass flow redistribution, indicating a stagnation zone after ballooned region. This flow redistribution, for a convetional PWR, could be much more evi-dent, indicating an overheat possibility.
CONCLUSIONS
After LOCA events, fuel rods may balloon, when this strain occurs, velocity, temperature and tur-bulence for each fuel rod vary according to radial and blockage-length.
All partially blocked geometries have a significant increasing on central region of the rod tempera-ture. The smaller the inlet velocity, the greater the outlet fluid temperatempera-ture. For the critical situation (inlet velocity at 2 cm/s), the increasing on temperature reached 22% when compared to the same non-blocked condition.
The turbulence increased heat transfer capacity, so that, fuel rod temperatures dropped after passing through the ballooned region, reaching regular values after some length (Figure 8, Figure 9 and Fi-gure 10).
The velocity profiles encountered are similar to analogous studies of [7], however, with the use of CFD, flow properties could be better observed as pointed by [3]–[5].
It is important to reinforce that mass flow is considered constant for this numeric simulation, where, in real PWR situations, pressure drop in reactor core is redistributed, to maintain itself constant. Nevertheless, the briefly simulation with 5x5 fuel rods could indicate mass flow pass around the ballooned region, creating a stagnation zone, indication an overheated region [21], [3], [8] and [22]. It is not possible to compare quantitatively all data obtained during simulations to another studies, but, as discussed, the qualitative results were very satisfactory. The agreement with other studies reinforce that the peaks of temperature originated by ballooned effect are more dangerous when compared to the temperature drop caused by turbulence.
REFERENCES
[1] M. NAITOH, K. CHINO, AND H. OGASAWARA, Cooling mechanism during transient reflooding of a reactor fuel bundle after loss of coolant, Nucl. Eng. Des, vol. 44, no. 2, pp. 193– 200, Nov. 1977.
[2] P. IHLE AND K. RUST, “PWR reflood experiments using full length bundles of rods with zircaloy claddings and alumina pellets,” Nucl. Eng. Des., vol. 99, pp. 223–237, Feb. 1987.
[3] M. L. ANG, A. AYTEKIN, AND A. H. FOX, “Analysis of flow distribution a PWR fuel rod bundle model containng A 90% blockage,” Nucl. Eng. Des., vol. 103, no. 2, pp. 165–188, Aug. 1987.
[4] M. L. ANG, A. AYTEKIN, AND A. H. FOX, “Analysis of flow distribution in a PWR fuel rod bundle model containing a blockage - Part 1. A 61% coplanar blockage,” Nucl. Eng. Des., vol. 108, no. 3, pp. 275–294, Jul. 1988.
[5] M. L. ANG, A. AYTEKIN, AND A. H. FOX, “Analysis of flow distribution in a PWR fuel rod bundle model containing a blockage - Part 2. A non-coplanar blockage,” Nucl. Eng. Des., vol. 108, no. 3, pp. 295–314, Jul. 1988.
[6] K. R. THURGOOD, M. J.; KELLY, J. M.; GUIDOTTI, T. E.; KOHRT, R. J.; CROWELL, “COBRA/TRAC-A thermal-hydraulics code for transient analysis of nuclear reactor vessels and primary coolant systems.,” Comm., 1983.
[7] C. GRANDJEAN, “Coolability of blocked regions in a rod bundle after ballooning under LOCA conditions,” Nucl. Eng. Des., vol. 237, no. 15–17, pp. 1872–1886, Sep. 2007.
[8] K. IHLE, P.; RUST, “FEBA-flooding experiments with blocked arrays-influence of blo-ckage shape,” Trans. Am. Nucl. Soc., 1979.
[9] K. G. JOWITT, D.; COOPER, C. A., “The THETIS 80% blocked cluster experiment. Part 5,” UKAEA At. Energy Establ., vol. No. AEEW-R, 1984.
[10] K. G. DENHAM, M. K.; JOWITT, D.; PEARSON, “ACHILLES unballooned cluster expe-riments, part 1, description of the ACHILLES rig, test section and experimental procedures.,”
AEEW-R2326., 1989.
[11] B. D. G. FAIRBAIRN, S. A. ; PIGGOTT, “Flow and Heat Transfer in PWR Rod Bundles in the Presence of Blockage due to clad Ballooning; Experimental Data Report-Part 2,” CEGB Rep.
TPRD/B/0458, vol. 2, 1984.
[12] L. E. HOCHREITER, “FLECHT SEASET program. Final report,” Westinghouse Electr. Corp., Pittsburgh, PA, vol. No. NUREG/, no. Westinghouse Electric Corp., Pittsburgh, PA (USA), 1985.
[13] B. J. KIM, J. KIM, K. KIM, S. W. BAE, AND S.-K. MOON, “Effects of fuel relocation on reflood in a partially-blocked rod bundle,” Nucl. Eng. Des., vol. 312, pp. 239–247, 2017.
[14] K. KIM, B.-J. KIM, H.-S. CHOI, S.-K. MOON, AND C.-H. SONG, “Effect of a blockage length on the coolability during reflood in a 2×2 rod bundle with a 90% partially blocked region,”
Nucl. Eng. Des., vol. 312, pp. 248–255, 2017.
[15] E. E. DOMINGUEZ-ONTIVEROS, Y. A. HASSAN, M. E. CONNER, AND Z. KAROU-TAS, “Experimental benchmark data for PWR rod bundle with spacer-grids,” Nucl. Eng. Des., vol. 253, pp. 396–405, Dec. 2012.
[16] E. E. DOMINGUEZ-ONTIVEROS AND Y. A. HASSAN, “Non-intrusive experimental investigation of flow behavior inside a 5×5 rod bundle with spacer grids using PIV and MIR,”
Nucl. Eng. Des., vol. 239, no. 5, pp. 888–898, May 2009.
[17] S. CHENG, H. CHEN, AND X. ZHANG, “CFD analysis of flow field in a 5×5 rod bundle with multi-grid,” Ann. Nucl. Energy, vol. 99, pp. 464–470, 2017.
[18] H. J. WAGNER, W. ; KRETZSCHMAR, “IAPWS industrial formulation 1997 for the ther-modynamic properties of water and steam,” Int. Steam Tables Prop. Water Steam Based Ind.
Formul. IAPWS-IF97, p. 7–150., 2008.
[19] B. E. LAUNDER AND D. B. SPALDING, “The numerical computation of turbulent flows,”
Comput. Methods Appl. Mech. Eng., vol. 3, no. 2, pp. 269–289, Mar. 1974.
[20] E. G. STERN, F.;WILSON, R. V.; COLEMAN, H. W.; PATERSON, “Comprehensive ap-proach to verification and validation of CFD simulations-Part 1: methodology and procedures,”
Trans. Soc. Mech. Eng. J. Fluids Eng., vol. 123(4), pp. 793–802, 2001.
[21] K. IHLE, P.; RUST, “SEFLEX fuel rod simulator effects in flooding experiments. Pt. 3,”
Kernforschungszentrum Karlsruhe GmbH, 1986.
[22] E. DOMINGUEZ-ONTIVEROS AND Y. A. HASSAN, “Experimental study of a simplified 3x3 rod bundle using DPTV,” Nucl. Eng. Des., vol. 279, pp. 50–59, Nov. 2014.