i
An ANP model to support decision-making in a Portuguese pharmaceutical
supply chain
Copyright©: Paulo Emil Nikolas Mourão de Melo e Abreu, Universidade Nova de Lisboa – Faculdade de ciências e tecnologia.
A Faculdade de Ciências e Tecnologia e a Universidade Nova de Lisboa têm o direito, perpétuo e sem limites geográficos, de arquivar e publicar esta dissertação através de exemplares impressos reproduzidos em papel ou de forma digital, ou por qualquer outro meio conhecido ou que venha a ser inventado, e de a divulgar atraves de repositórios científicos e de admitir a sua cópia e distribuição com objectivos educacionais ou de investigação, não comerciais, desde que seja dado crédito ao autor e editor.
iii
Aknowledgments
To Professor Doctor Virgínia Helena Arimateia Campos Machado and Professor Doctor Ana Paula Ferreira Barroso, my supervisors, for the availability, support, ideas and text reviews that made the realization of this dissertation possible.
To my aunt and my uncle, Filomena de Melo e Abreu and Pedro Duarte, respectively, for providing me the contacts to the industry and therefore made this study possible.
To Doctor Manuel Figueiredo, for the enormous availability and for providing an extensive insight into the supply chain in order for me to understand all interesting details related to the industry.
To Engineer Manuel Sapinho, for the availability and for providing me a guided tour into the company’s warehouse.
To Ivo Bastos, for the availability and support.
To my cousin Catarina Duarte and to João Matias for the support and provided data related with the pharmacy.
To Ana Crespo for the availability and also for the provided data related with the other pharmacy. To Izunildo Cabral, who made the understanding of the Analytic Network Process much easier and more logical and for his availability and support.
To my mother, Liisa de Melo e Abreu and to my father José de Melo e Abreu for all the support. Finally, I want to thank all my friends who supported me all the way.
v
Resumo
Para que as cadeias de abastecimento consigam competir no seu meio envolvente, as empresas que as constituem tiveram de adoptar novas maneiras de pensar, nomeadamente, considerando a gestão da cadeia de abastecimento como um pilar essencial para a sobrevivência no mercado. No contexto da gestão da cadeia de abastecimento, é fundamental entender de que modo é que os paradigmas de gestão Lean e Ágil aplicados às cadeias de abastecimento permitem alcançar uma gestão eficiente. A gestão da cadeia de abastecimento envolve ainda práticas de gestão e indicadores de desempenho, sendo importante que os seus gestores identifiquem os que permitem alcançar mais vantagens competitivas. A presente dissertação apresenta um modelo de apoio à tomada de decisão, baseado no Analytic Network Process, que tem como objectivo apoiar os gestores de entidades de cadeias de abastecimento da indústria farmacêutica na tomada de decisões, relativamente a práticas de gestão, e a indicadores de desempenho, de forma a torná-las mais competitivas.
Palavras chave: Gestão da cadeia de abastecimento, Lean, Ágil, Analytic Network Process, Indicadores de desempenho, Capacidade de resposta.
vii
Abstract
In order to cope up with a volatile and scarce environment, companies have had to adopt new ways of thinking. One of them is embracing Supply Chain Management (SCM) and considering it as a crucial asset if willing to compete in the marketplace. In the context of SCM, it is important to understand how Lean and Agile SCM paradigms are adopted as means of achieving an efficient Supply Chain (SC). Besides the mentioned paradigms, many Key Performance Indicators (KPIs) and management practices come along with SCM, and it is important that SC managers identify the ones that bring the most competitive advantages. This dissertation intends to design a model based on the Analytic Network Process (ANP) in order to assist SC managers from different entities of a pharmaceutical SC in exploring efficient decisions to be made, with respect to KPIs and management practices, as means of achieving a highly competitive SC.
Keywords: Supply Chain Management, Lean, Agile, Analytic Network Process, Key Performance Indicators, Responsiveness.
ix
Index
1. INTRODUCTION ... 1 1.1 CONTEXT ... 1 1.2 OBJECTIVES ... 2 1.3 RESEARCH METHODOLOGY ... 21.4 STRUCTURE OF THE DISSERTATION ... 4
2. LITERATURE REVIEW ... 5
2.1 RELEVANCE AND REVIEW OF THE MAIN TOPICS ... 5
Supply chain management ... 5
2.1.1 Aligning products with supply chains ... 8
2.1.1.1 Lean thinking ... 9 2.1.2 Historical background ... 9 2.1.2.1 Lean SCM paradigm... 10 2.1.2.2 How to measure leanness? ... 12
2.1.2.3 Agility ... 13 2.1.3 Historical background ... 13 2.1.3.1 Agile SCM paradigm ... 13 2.1.3.2 Agility variables ... 15 2.1.3.3 Hybrid strategies ... 16 2.1.4 SCM practices and Key Performance Indicators ... 18
2.1.5 Models for decision-making ... 19
2.1.6 Analytic Hierarchy Process ... 21
2.1.6.1 Analytic Network Process ... 23
2.1.6.2 2.1.6.2.1 Outline the steps of the ANP ... 24
2.1.6.3 AHP versus ANP ... 26
2.2 MATERIAL COLLECTION ... 27
2.3 SEARCH FOR RELATED PAPERS ... 27
2.4 DESCRIPTIVE ANALYSIS ... 28
2.5 INTERPRETING RESULTS OF THE LITERATURE REVIEW ... 31
3. PHARMACEUTICAL SUPPLY CHAIN ... 33
3.1 THE INDUSTRY ... 33
3.2 THE CASE STUDY SUPPLY CHAIN ENTITIES ... 35
3.2.1 Primary manufacturing ... 36
3.2.2 Secondary manufacturing ... 36
3.2.2.1 Lusomedicamenta ... 37
3.2.3 Distributor – Novartis Farma and ETO ... 38
3.2.4 Wholesaler – Alliance Healthcare ... 39
3.2.5 Pharmacies ... 39
x
4. ANALYTIC NETWORK PROCESS APPROACH TO ASSESS PHARMACEUTICAL SUPPLY
CHAIN MANAGEMENT ... 41
4.1 DATA GATHERING ... 41
4.2 MODEL CONSTRUCTION AND PROBLEM STRUCTURING ... 42
4.2.1 1st Cluster ... 44 4.2.2 2nd Cluster ... 44 4.2.3 3rd Cluster ... 45 4.2.4 4th Cluster ... 46 4.2.5 5th Cluster ... 47 4.2.6 6th Cluster ... 48
4.3 CONDUCTING THE PAIRWISE COMPARISONS BETWEEN ELEMENTS AND OBTAINING RELATIVE WEIGHTS49 4.3.1 Pair-wise comparison of the clusters ... 51
4.3.2 Pair-wise comparison of the elements ... 52
4.3.3 Pair-wise comparisons of the elements from the different perspectives of the supply chain ... 60
4.3.3.1 Pharmaceutical company ... 60
4.3.3.2 Wholesaler ... 62
4.3.3.3 Pharmacy ... 63
4.4 DETERMINING THE SCORE FOR EACH ELEMENT ... 67
4.5 DISCUSSION OF THE RESULTS OF THE MODEL ... 68
4.5.1 Global anaysis ... 68
4.5.2 Analysis by cluster ... 69
5. CONCLUSIONS AND RECOMMENDED FUTURE WORK ... 71
REFERENCES ... 75
ANNEX I – QUESTIONNAIRE DESIGNED FOR NOVARTIS FARMA ... 83
ANNEX II – ADDITIONAL INFORMATION OF LUSOMEDICAMENTA ... 91
II.1 MANAGEMENT ... 92
xi
List of figures
Figure 1.1 - Research methodology diagram ... 4
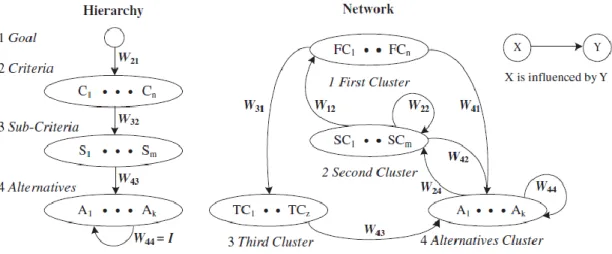
Figure 2.1 - Comparison of a hierarchy with a network ... 23
Figure 2.2 - Number of publications across the time period 1988-2013 ... 30
Figure 2.3 - Distribution of the publications by content ... 30
Figure 3.1 - Total pharmaceutical industry in Europe. ... 34
Figure 3.2 - Manufacturing of raw materials and pharmaceutical products in Portugal. ... 35
Figure 3.3 - Pharmaceutical Supply Chain (Case study) ... 35
Figure 4.1 - ANP network ... 48
Figure 4.2 - JIT supply example considering a standard product ... 65
Figure 4.3 - JIT supply example considering an innovative product ... 66
Figure 4.4 - Example of a product that is occasionally supplier in large quantities ... 66
Figure 4.5 - Experimental final priorities for the ANP model ... 68
Figure II.1 - Reception and expedition area ... 91
Figure II.2 - Internal area (PT) ... 92
xiii
List of tables
Table 2.1 - Product supply matrix. ... 9
Table 2.2 - Market winners and qualifiers for the ASC and the LSC ... 16
Table 2.3 - Characterization of lean and agile supply chain management paradigms ... 17
Table 2.4 - SCM practices and Key Performance Indicators. ... 19
Table 2.5 - SCM measures versus management practices... 19
Table 2.6 - The fundamental scale. ... 22
Table 2.7 - Average RI for corresponding matrix size. ... 25
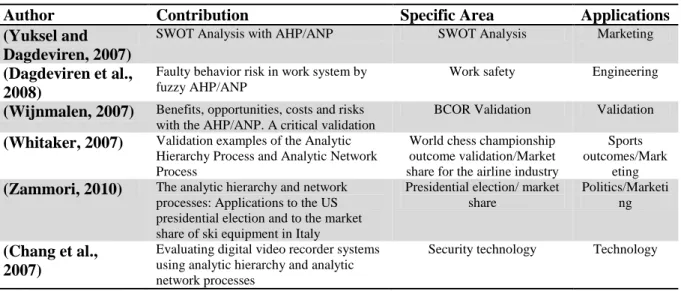
Table 2.8 - AHP/ANP applications made by different authors ... 26
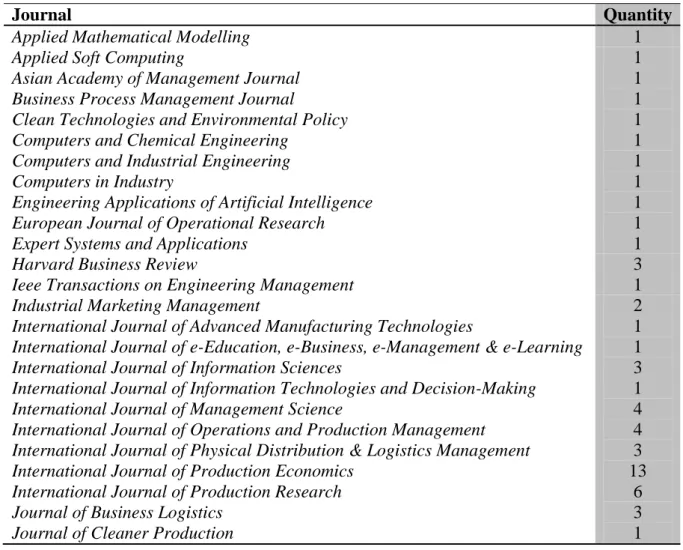
Table 2.9 - Distribution of the papers related to journals ... 28
Table 4.1 - Number of pair-wise questions (different scenarios) ... 44
Table 4.2 - Clusters and respective elements considered in the ANP model ... 49
Table 4.3 - Description of the pair-wise comparisons ... 50
Table 4.4 - Clusters with respect to the competitive priorities cluster ... 51
Table 4.5 - Cluster comparison with respect to SCM paradigms ... 52
Table 4.6 - Cluster comparison with respect to the stakeholders ... 52
Table 4.7 - Competitive priorities with respect to SC competitiveness and performance ... 53
Table 4.8 – Competitive priorities elements with respect to Cost ... 53
Table 4.9 - Competitive priorities elements with respect to Service level ... 53
Table 4.10 - Competitive priorities elements with respect to Delivery time ... 54
Table 4.11 - KPI elements with respect to Cost ... 54
Table 4.12 - KPI elements with respect to Service level ... 54
Table 4.13 - KPI elements with respect to Delivery time ... 55
Table 4.14 – Management practices elements with respect to Cost ... 55
Table 4.15 - Management practices elements with respect to Cost ... 56
Table 4.16 - Management practices elements with respect to Delivery time ... 56
Table 4.17 - KPI elements with respect to the Lean SCM paradigm ... 56
Table 4.18 – KPI elements with respect to the Agile SCM paradigm ... 57
Table 4.19 – Management practices elements with respect to the Lean SCM paradigm ... 57
Table 4.20 – Management practices elements with respect to the Agile SCM paradigm ... 57
Table 4.21 - KPI elements with respect to management practice “JIT” ... 58
Table 4.22 - KPI elements with respect to management practice “Promoting visibility throughout the SC” ... 58
Table 4.23 - KPI elements with respect to management practice “Promoting the ability to change the delivery date and/or quantity” ... 59
xiv
Table 4.25 – Management practices elements with respect to the KPI "OTIF" ... 59
Table 4.26 – Management practices elements with respect to the KPI "Responsiveness to urgent deliveries" ... 60
Table 4.27 – Competitive priorities with respect to the Goal cluster (Pharmaceutical company perspective) ... 60
Table 4.28 - Most important KPIs in the perspective of the pharmaceutical company ... 61
Table 4.29 - Most important management practices (Pharmaceutical company) ... 61
Table 4.30 - Most important SCM paradigm (Pharmaceutical company) ... 62
Table 4.31 – Competitive priorities with respect to the Goal cluster (Wholesaler perspective) ... 62
Table 4.32 - Most important KPIs in the perspective of the Wholesaler ... 62
Table 4.33 - Most important management practices in the perspective of the Wholesaler ... 63
Table 4.34 - Most important SCM paradigm in the perspective of the Wholesaler ... 63
Table 4.35 . Competitive priorities with respect to the Goal cluster (Pharmacy perspective) ... 64
Table 4.36 - Most important KPIs in the perspective of the pharmacy ... 64
Table 4.37 - Most important management practices in the perspective of the Pharmacy ... 64
xv
List of abbreviations
AHP Analytic Hierarchy Process AI Active Ingredient
AIs Active Ingredients ANP Analytic Network Process ASC Agile Supply Chain
CPFR Collaborative Planning, Forecasting and Replenishment CR Consistency Ratio
ECR Efficient Consumer Response GSC Global Supply Chain
IS Information Sharing JIT Just-In-Time
KPI Key Performance Indicator KPIs Key Performance Indicators LSC Lean Supply Chain
MCDM Multi Criteria Decision Making MS Microsoft
NPI New Product Introduction OTIF On Time In Full delivery PWC Pair-Wise-Comparison PWCs Pair-Wise-Comparisons
RUD Responsiveness to Urgent Deliveries SC Supply Chain
xvi
SCC Supply Chain Collaboration SCM Supply Chain Management SCP Supply Chain Performance SKU Stock-Keeping-Unit TPS Toyota Production System VMI Vendor Management Inventory WPM Weighted Product Model WSM Weighted Sum Model
List of symbols
ω Eigenvector of a pair-wise comparison matrix
1
1. Introduction
1.1 Context
While markets have boosted as means of becoming extremely competitive in the last few decades, companies have had to improve their procedures and their way of thinking in order to keep up with the competitors. Actually the idea in the modern way of doing business is that it´s the Supply Chains (SCs) who compete, not companies, and the success or failure in the marketplace is ultimately determined by the end customer (Christopher and Towill, 2001; Li et al., 2005; Gunasekaran, 2008; Jain et al., 2008). To meet the requirements of the end consumer, all Supply Chain (SC) entities have to contribute equally in the selection of the strategies to adopt in order to reach the objectives of the SC (Kisperska-Moron and Haan, 2011). As a consequence, Supply Chain Management (SCM) has arisen to be not only a way to achieve competitive success and advantage, but also the key for survival. Ramanathan (2013) recognizes SCM as a powerful business tool to survive in a competitive marketplace, while Vonderembse (2006) states that embracing SCM is extremely important because it focuses on actions along the whole value chain.
Decision-making is crucial for companies who strive to improve their Supply Chain Performance (SCP). In order to make the right decisions, and thus, improve competitiveness, the global market has imposed that collaborative working across SCs is required. In doing so, companies enforce their partnerships and strengthen their business in the market. As a matter of fact, collaboration between companies, supported by flawless communication between their information systems has been identified a key enabler for company success on a continuously changing global environment (Jardim-Gonçalves and Grilo, 2006). In addition, companies are required to provide superior quality products, at low costs, with on-time delivery and thus, enhance performance and competitiveness (Agarwal et al., 2008).
SC managers must implement new strategies in order to respond rapidly and cost efficiently to unpredictable changes in the markets, both in terms of volume and variety (Azevedo et al., 2011). However, decision-making is also an important part when implementing the referred strategies, considering that they have to be carefully selected in order to cope with the objectives of each SC. Management paradigms, Key Performance Indicators (KPIs), management practices and competitive priorities are a few of the SC characteristics involved in the strategic planning of a SC. These characteristics have to be involved in the decision-making process in order to strive for high SCP rates. In order to evaluate the referred characteristics, one has to be aware of the most sophisticated decision-making tool considering the structure of the problem and the marketplace. The Analytic
2
Hierarchy Process (AHP) and the Analytic Network Process (ANP) are two of the many available tools, but only after a literature review of each, can one decide on the best tool to adopt.
The challenge of this dissertation is to build a framework in order to figure out the best decisions to be made, in the strategic planning, when considering a highly regulated and competitive industry, the pharmaceutical industry.
1.2 Objectives
This dissertation has as its main objective to do a literature review of the Lean and Agile SCM paradigms and thus, the development of a decision-making model with the intent of aiding entities of the SC in their respective management issues and strategies. In this dissertation, the main focus rests in the distribution part of the SC. Still, manufacturing facilities are briefly described in the dissertation. The model is constructed using the ANP, which is an extension of the AHP. It helps managers from different entities of the SC to decide on the best Key Performance Indicators (KPIs), management practices, SCM paradigms and competitive priorities to utilize with the ultimate objective of achieving a high SC performance and thus, competitive success.
1.3 Research methodology
This dissertation is motivated by the merging of the studies proposed by Agarwal et al. (2006) and Cabral et al. (2012), where decision-making models (ANP) are applied to the fast moving consumer goods and the automotive industry, respectively. Cabral et al. (2012) made some recommendations for the future work. For instance, they considered important to evaluate perceptions from different entities of the SC, in addition to developing a model for another industry and compare the findings with the ones of their study. Agarwal et al. (2006) modeled the metrics of Lean, Agile and Leagile SCs. They considered four main criteria to assess SC performance: Cost, Quality, Service Level and Lead Time. These criteria are the market winners and qualifiers for Lean and Agile SCs. In addition, the authors considered four different clusters where each cluster can be considered a macro-variable for the respective SC. Furthermore, each cluster has four different elements, or micro-variables. The study made by Cabral et al. in 2012 differs in some details. Besides the industry being different, they include different entities in their model, and instead of Lean or Agile SC variables, management practices and KPIs are linked to the paradigms.
Since the literature review showed no evidence on decision-making modeling in the pharmaceutical industry, the decision in developing one came up.
The research started with the proposal in realizing the dissertation in the pharmaceutical industry. After the approval, Novartis Farma was immediately contacted and the research started to be
3 conducted. Furthermore, and after understanding how the pharmaceutical SC worked, several other entities had to be involved in the research, as means of having a wider and a more diversified perspective of the respective SC. The entities involved directly are: Novartis Farma, ETO (pharmaceutical companies), Lusomedicamenta (secondary manufacturing), Alliance Healthcare (wholesaler), Farmácia Allegro (pharmacy), and Farmácia Crespo (pharmacy).
The procedure adopted in the development of this dissertation is described in the following.
The first part of the research was to conduct a literature review on three main issues: SCM, Lean and Agile SCM paradigms with the purpose of making a proper characterization of them. Initially it was supposed to be only on the paradigms, but it goes without saying that SCM comes along with the Lean and Agile SCM paradigms. In addition, a review on decision-making tools was made in order to understand and address a proper model into the pharmaceutical industry. The main aim of the review was to get answers for some questions, namely what is the historical background of Lean and Agile paradigms? How are these paradigms characterized? Which are the main attributes of Lean and Agile SCM? Which management practices are used in Lean and Agile SCs in order to enhance SCP? Which KPIs are mostly used for measuring these practices and SCP in general? Finally and interpretation of the review was made in order to organize the obtained information.
Meanwhile, an introductory visit was made to each company, with the intent of getting more knowledge about the companies and thus, about the SC. Several conversations in the form of semi-structured interviews were held with the experts of each entity in order to figure out how the industry works and how the theoretical background of the dissertation could be implemented into a real problem or model. After gathering the necessary information, it was decided that a decision-making model that enhances SCP would be constructed and applied to the pharmaceutical industry. This procedure took several months to conclude.
ANP was selected as the most appropriate decision-making tool based on the literature review.
Again, several conversations with experts from all of the companies belonging to the SC were held to decide on the elements to include on each cluster (Management practices, KPIs and competitive priorities) of the ANP. Afterwards, a questionnaire was made in order to gather the judgments of all existing Pair-Wise Comparisons (PWCs) made by the experts. The structuring and constructing of the questionnaires also took a significant amount of time and effort. Many practices and KPIs were suggested by the experts but only the most appropriate ones were selected in order to facilitate the understanding of the model in the experts’ point of view. In addition, the number of pairwise comparisons lowers significantly, which reduces the time needed for answering the questionnaires (some experts may not be willing to answer questionnaires which take too much time in doing so). The most appropriate competitive priorities were also selected. The last step was to collect and analyze the
4
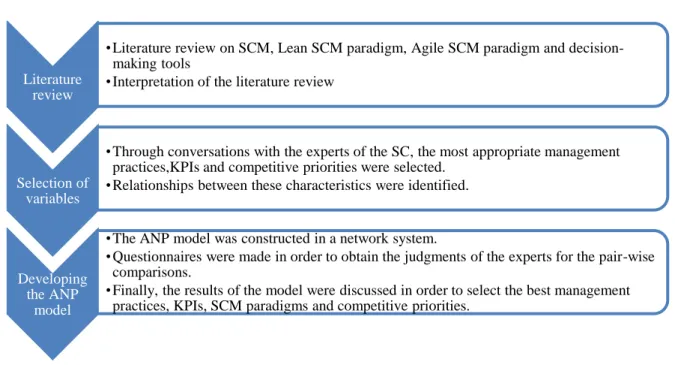
data to discuss the obtained results. Super Decisions software (version 2.2.6 beta) was used in the modeling of the ANP network.In order to better understand the research methodology, a diagram is illustrated in figure 1.1.
Figure 1.1 - Research methodology diagram 1.4 Structure of the dissertation
This dissertation is divided into 5 chapters.
It begins with the present introduction chapter where the context of the dissertation was described, objectives outlined, research methodology explained and finally the structure described.
In the second chapter a literature review is done. It begins with SCM and its relevance. Afterwards Lean and Agile historical background and the scientific characteristics of each of the paradigms are emphasized. Decision-making tools are also reviewed. The chapter also includes the description of how the actual literature review was conducted.
The third chapter describes the case study, a pharmaceutical SC. It also characterizes each entity belonging to the SC separately.
The fourth chapter is related to the application of the ANP into the case study. The analysis of the results is also part of this chapter.
The fifth and final chapter draws out conclusions of the dissertation and makes suggestions for future work.
Finally the bibliography and the annexes are illustrated at the very end of the dissertation.
Literature review
•Literature review on SCM, Lean SCM paradigm, Agile SCM paradigm and decision-making tools
•Interpretation of the literature review
Selection of variables
•Through conversations with the experts of the SC, the most appropriate management practices,KPIs and competitive priorities were selected.
•Relationships between these characteristics were identified.
Developing the ANP
model
•The ANP model was constructed in a network system.
•Questionnaires were made in order to obtain the judgments of the experts for the pair-wise comparisons.
•Finally, the results of the model were discussed in order to select the best management practices, KPIs, SCM paradigms and competitive priorities.
5
2. Literature Review
The literature intends to obtain answers for the following questions:
What is supply chain management? How does it affect a company´s performance in today’s volatile and extremely competitive marketplace? What comes along with it? Which are the essential constructs that enhance supply chain performance?
Lean and Agile paradigms are two essential concepts that come along with supply chain management. It’s essential for managers to understand how these concepts are related to each other and how they differ. This literature review must cover the aspects in which each of these paradigms tend to focus; which is the operational performance that distinguishes them and more importantly, whether these systems compete or complement each other?
Which are the decision-making tools available to assist supply chain managers in their complex decisions? How do they differ from each other and what is the most adequate and most up to date tool available?
2.1 Relevance and review of the main topics
In this section the relevance and review of each topic is handled separately. The main topics are the following: Supply Chain Management (SCM), Lean SCM paradigm, Agile SCM paradigm, and models for decision-making. In addition, a review of Leagility or Hybrid strategies is made.
Supply chain management 2.1.1
Naylor et al. (1999) defines a supply chain (SC) as a system whose constituent parts include material suppliers, production facilities, distribution services and customers linked together via a feed forward flow of materials and feedback flow of information. Azevedo et al. (2012) describes SCM as promoting the integration between companies and their suppliers through the development of supplier partnerships and strategic alliances.
SCM is a critical factor for achieving and maintaining competitive advantage (Mohammed, 2008). Li et al. (2005) agrees stating that SCM is an essential prerequisite in order to stay in the competitive global race to growing profitability. Martin and Patterson (2009) claim that due to the need for company and overall SC efficiency, companies are forced to review, evaluate and consider the adoption of SCM concepts. The aim of SCM is to create sourcing, making and delivery processes and logistics functions across the SC as an effective weapon.
Lambert et al. (2005) identified the three key SC elements required to make products available to end customers: i) SC network, ii) SC processes the network operates with and supports and iii) SC decisions required for managing the network.
6
The SC network consists of the suppliers, manufacturing sites and warehouses, where raw-material, semi-finished and finished inventory flows between the entities with the intent of satisfying end-customer demand (Stavrulaki and Davis, 2010). SC processes refer to a set of activities used to carry out the flow of material through the network. In addition, SC processes include production and logistics processes as the council of SCM professionals suggests. More specifically, logistics processes include the activities related to the storage and flow of goods (forward and reverse), i.e. warehousing and transportation. At last, when it comes to management and decision-making, they cover the aspects of planning, organizing, implementing and controlling of SC processes (Davenport et al., 1995). Collaboration plays a huge role among Supply Chains (SCs) willing to improve their overall performance, where all chain entities benefit from it (Simatupang and Sridharan, 2005). In order to support SCM and to improve Supply Chain Performance (SCP), several collaborative tools are being adopted by SC operators, e.g. Vendor Management Inventory (VMI) and Collaborative Planning and Forecasting Replenishment (CPFR) (Ramanathan, 2013). Manufacturers have increased their profits and achieved cost reduction when practicing Supply Chain Collaboration (SCC) and advanced information sharing (IS) with other SC entities (Kulp, 2004). These are two of the many benefits which come along with SCC. However, to generate these benefits, available information must be properly used in the right context among partners (Moinzadeh, 2002). In addition, Cao and Zhang (2010) state that collaboration and the derived benefits are absent when SC entities purse their own objectives.
As mentioned above, SCP is one of the main issues that SC managers have to deal with when embracing SCM. How to enhance performance? What should be the measures/ Key Performance Indicators (KPIs) considered to enhance SCP? During the recent years, SCP measurement has been on the top of business research list meaning that it´s a crucial asset linked to success (Najmi and Makui, 2012). Likewise, Gunasekaran and Kobu (2007) assure that good performance measures and metrics will facilitate a more open and transparent communication between people leading to a co-operative supported work and thus, improve organizational performance. The performance measures and indicators will be reviewed in section 2.1.5.
Another issue which has gained importance in recent years is the fact that uncertainties have become a bigger of a concern in SCs, as well as the consequently increasing inventories and distorting demand forecasts have. Besides, these forecast errors amplify as we move upstream in the SC (phenomenon known as the bullwhip effect). In order to prevent this from happening, the SC should have a centralized and collaborative planning supported by effective use of IT tools (Agarwal et al., 2005). Akyuz and Erkan (2010) provide an extensive literature review on SCP measurement.
Lambert et al (2005) identified the three key elements to make products available to the customers, in a generalized way. Li et al. (2005) in turn, identified 6 constructs (Information sharing, information
7 quality, strategic supplier partnership, customer relationships, postponement, internal lean practices) of SCM considering delivery dependability and time to market as performance outcomes. These constructs are more related with actual management practices and measures. Delivery dependability is the ability of to meet quoted or anticipated delivery dates and quantities on a consistent basis (Nair, 2005). Time to market is the extent to which an organization is capable of introducing new products more quickly than major competitors (Carvalho et al., 2012).
One of the constructs, is the above mentioned Information Sharing (IS). According to Li et al. (2006), IS refers to “the extent to which critical and proprietary info is communicated to one’s SC partner”. IS that bear on key performance metrics and process data, not only enables efficient decision-making but also improves the SC visibility. However, shared information within SC partners is only beneficial if the information is relevant, accurate, timely and reliable; i.e. information quality has to be good (another construct). Data acquisition, processing, storage, presentation, retrieval, and broadcasting of demand and forecast data, inventory status and locations, order status, cost-related data and performance status are some of the elements that IS consists of. Generally speaking, IS facilitates the flow of goods in the SC (Cachon and Fisher, 2000).
Strategic supplier partnership is Li’s another SCM construct and it´s defined as the long-term relationship between the organization and its suppliers. Direct long-term association, mutual planning and problem solving efforts are emphasized by strategic partnerships (Gunasekaran et al., 2001). The purpose is to promote shared benefits among the entities and enable them to work more effectively with a few important suppliers who are in compliance with sharing responsibility for the success of the products (Killing, 1995).
Another construct is customer relationships and they involve practices related to customer complaints management, long-term relationship building with customers. It also improves customer satisfaction, which is in fact, an important variable of SC agility (Agarwal et al., 2006). An organization can differentiate its products from companies through maintaining close customer relationships (Li et al., 2005). It also sustains customer loyalty and increases the perceived value of the product to the customers (Magretta and Dell, 1998).
Postponement is also a construct. It’s defined as the practice of moving forward one or more operations of activities (making, sourcing and delivering) to a further point in the SC. Three types of postponement have been recognized in literature: form, time and place.
Li et al. (2006) refers to one more construct which is related with practices of the Lean SCM paradigm, which are detailed in section 2.1.2.
8
Aligning products with supply chains 2.1.1.1
Vonderembse et al. (2006) state that the product is the soul of the SC. Mason-Jones et al. (2000) add that a SC has to adopt a strategy matching both their particular product and marketplace. In order to develop that strategy, the constraints of the marketplace have to be well understood.
A function of the product characteristics and expectations of the final customers should always be considered when designing a SC (Fisher, 1997). Vonderembse et al. (2006) go even further arguing that the product is the soul of the SC. Hence, several authors have proposed through frameworks, the strategic alignment of products with the right kind of SCs considering their demand and supply characteristics (Mohammed, 2008).
To successfully meet customer demands and consequently designing a SC, it’s essential to understand the characteristics of the product (Vonderembse et al., 2006). According to Mason-Jones et al. (2000), there are three types of products: standard, innovative and hybrid.
If demand is stable and can be accurately forecasted; when production requirements and design characteristics change slowly/incrementally over time; if these prerequisites are met, the product is considered standard. This type of products generally has long-term relationships, which leads to high quality materials and quantity discounts through Just-in-Time (JIT) delivery (Mason-Jones et al., 2000; Vonderembse et al., 2006), e.g. fast-moving-consumer-goods, groceries (Reichhart and Holweg, 2007).
If demand is uncertain, product designs/manufacturing capabilities unstable and sophisticated; if the product is aimed to new customers or new markets and if it satisfies needs that are still to articulate, it is considered to be an innovative product. In addition, these products require close customer contact and they’re adaptable to changing customer requirements. Normally this type of product has a premium price which enhances profitability. These products suffer a transformation into standard products when demand increases and competitors appear, e.g. fashion apparel (Vonderembse et al., 2006). For that matter, Bruce and Daly (2011) provide an example, through a case study, concluding that companies in textiles and clothing industry need to be able to respond quickly to changing markets and be able to provide quick replenishment. However, large quantities of inventory should not be accumulated due to the short life cycle of the respective products and due to the market being seasonal.
These products include a mix of standard and innovative. If products are complex, have several components and are considered to be major purchases made periodically by customers (after careful consideration), they’re considered to be hybrid. Hybrid products have a long life cycle with a few improvements and innovations offered periodically, e.g. automobile industry, furniture.
9 Table 2.1 confirms that the functional product is related to an efficient supply, which in turn, can be linked to “Lean” supply strategies. The innovative product is aligned with responsive supply, which is, as opposed to the efficient supply, linked to “Agile” supply strategies. These two strategies or philosophies will be described in detail starting from section 2.1.2 of the present literature review.
Table 2.1 - Product supply matrix. Adapted from: Fisher M., 1997
Functional Product Innovative Product Efficient Supply Alignment Misalignment Responsive Supply Misalignment Alignment Lean thinking
2.1.2
“Lean emerged slowly over the years, rather than that it was invented as a grand theory” –
(Kisperska-Moron and de Haan, 2011)
Historical background 2.1.2.1
The literature review showed that the Lean philosophy and its evolution have been widely discussed in literature so there’s a lot of feasible material related. However, it officially emerged in the post-war era (WW2) in Japan, where competing markets were short on resources implying that companies had to make the most out of them. In this context, Toyota designed a production system that utilized some of Ford’s mass production techniques and combined it with a small-batch production system and some concepts from its loom business. Meanwhile, the Toyota Production System (TPS) was born. The goal was to eliminate “muda”1
in all possible forms, i.e. eliminate defects in production, overproduction, inventories, unnecessary processing, unnecessary movement of people, unnecessary transport of goods and waiting by employees (Ohno, 1988). One element was added to the list by Womack and Jones (1996), the waste of goods and services that fail to meet the needs of the customers. Since then, TPS has continuously evolved (Reichhart and Holweg, 2007). However, it only became known in the west in the beginning of the 90’s as just-in-time (JIT) production. Furthermore, emerged the term “Lean”, originally conceived by a MIT researcher called John Krafak. Although the term wasn´t coined by Womack and Jones, it was the launching of their seminal book “The Machine that changed the World” (1990) where the premise of lean production was introduced to the business world. In their book it was stated that a lean company uses “less of everything compared with mass production – half the human effort in the factory, half the manufacturing space, half the investment in tools, half the engineering
1
10
hours to develop a new product in half the time”. Womack and Jones (1994) also examined operations and work methods utilized by automotive industries in Japan, U.S. and Germany and showed how the Japanese outperformed their U.S. and German competitors.
Extension of lean operations to the so called “extended company” started raising attention in literature. The extended company is a group of individuals, functions and operationally synchronized companies with a common goal, which is to analyze and focus on the value stream so that everything related to supplying a good or a service is done from the client’s perspective. In the extended company, there can be no boundaries, and an ethos of trust and commitment must prevail (Christopher, 2000). In the past few decades, this has been a major concern for the SC managers.
“The narrower the scope of responsibility, the more easily a company can calculate costs and the benefits it generates and see the results of its improvement efforts. Therefore, the value stream should be segmented so that each company is responsible for a narrow set of activities.” (Womack and Jones, 1994)
According to Womack and Jones (1996) and Hines et al. (2004) the philosophy of contemporary lean thinking can be abbreviated as maximizing the relative value delivered2 by reducing waste and consequently operational costs.
Lean production has been largely debated in literature and it´s in many cases (companies) implemented almost perfectly, but when it comes to service operations, there´s still much to discuss. Lean distribution was introduced in the late 1980’s.
Reichhart and Holweg (2007) define lean distribution as “minimizing waste in the downstream SC, while making the right product available to the end customer at the right time and location”. Extending lean beyond the factory depends upon the type of the product. However, in many SCs the main focus still rests on the manufacturing operation, mostly due to the uncertainty in extending lean into the downstream part of the chain (Holweg and Pil, 2004). Furthermore, Womack introduced lean consumption in 2005. However, this dissertation will not review this concept further because it´s out of context.
Lean SCM paradigm 2.1.2.2
Lean thinking can be described from two different points of views, either from the philosophical perspective related with guiding principles and global objectives, or from the more practical one
2
The relative value delivered can be defined as the value a certain product has to a specific customer divided by the cost, at which this value is created.
11 consisting of a set of management activities, techniques and tools which can be observed directly. This doesn´t necessarily mean disagreement when it comes to the meaning of lean production, but it sure undermines conceptual clarity (Hines et al., 2004).
In the Lean Supply Chain (LSC) operating costs and efficiency as well as quality and reliability are essential (market winner and qualifiers). This is consistent with Christopher (2000) who states that Lean management focuses on process efficiency generating the most outcome out of the least input through minimization of wastes. Vonderembse et al. (2006) contradicts stating that quality should be a market winner in addition to cost. A LSC focuses on employing continuous improvement efforts with its main concern being the elimination of waste and non-value adding tasks3 across the chain, e.g. excess time, labor, equipment, space, inventories, transport and movement (Vonderembse et al. 2006; Mollenkopf et al., 2010). These improvement efforts favor the internal manufacturing flexibility (for already available products) considering that the manufacturing process gets more and more perfect. It also reduces setup time, which enhances cost reduction and consequently, profitability.
Some authors prefer to separate the “obvious” wastes from the “less obvious” ones, referring to excessive setup times, unneeded processes, unreliable machines and wastes associated with variability, respectively (De Treville and Antonakis, 2006). Meanwhile, the LSC lacks responsiveness to customer demands which requires flexibility in product design, planning and scheduling and distribution in addition to manufacturing. Some authors claim that Lean is simply JIT philosophy restructured. Sugimori et al. (1977) defined JIT as follows: “only the necessary products, at the necessary time, in the necessary quantity”.
One of the main assets of the lean thinking is waste reduction and consequently the minimization of inventory. According to Anupindi et al. (1999), inventory can be reduced either by maintaining excess capacity or by lowering throughput time. Considering that excess capacity goes against the principles of lean production, it´s preferable to lower the throughput time by enabling continuous flow production without the stop and go characteristic of a batch production. To achieve continuous flow, it´s necessary a dedicated and efficient work force. The “less obvious” waste referred above, variability, has to be well managed in terms of supply, processing time and demand, in order to successfully minimize inventory (De Treville and Antonakis, 2006 ; Hopp and Spearman, 2004). In order to manage variability successfully, a company must know the underlying causes of the respective variability, i.e. supply variability occurs when a supplier doesn´t deliver the right quantity at the right time and location (Womack et al., 1990). In order to minimize supply variability, Shah and
3 Activities that consume resources but generate no redeeming value in the eyes of customers (Womack and Jones, 1996).
12
Ward (2007) suggest the creation of an involved and dependent supplier base consisting of a few key suppliers with long term contracts. As means of reducing processing time, lean production has many different tools, one of them being specifying work until its ultimate detail and consequently enabling line balancing, which makes forecasting of produced inventory much easier and more precise. In addition, it´s important to avoid rework and have cross-trained employees who can step in for absent employees without disrupting flow, quantity or quality of work.
Through a case study, Jimenez et al. (2012) concluded that lean practices implemented in the Spanish wine industry reduced inventory, and redundant information was eliminated through the use of advanced technologies.
Sundin et al. (2011), in turn, applied lean production principles on recycling center operations and concluded that existing flow problems could be decreased. For instance, they stated that these recycling centers have to be managed in a better way in terms of choosing a suitable layout, signs, and opening hours. In addition, they concluded that considering lean production engineering philosophy, several improvements were achieved, e.g. shorter visiting times and cleaner waste fractions.
How to measure leanness? 2.1.2.3
Shah and Ward (2007) identified, through a reliable empirical test, the ten dimensions of lean production, including internal and external constructs (supplier, customer and internal). They argue that every one of the ten dimensions is an important contributor and that none should be eliminated, due to their inter-relations. These dimensions allow researchers to test the lean implementation in companies.
The dimensions are the following:
Supplier feedback – suppliers must be informed in a regular basis about their performance. JIT delivery by suppliers – ensures that suppliers deliver the right quantity at the right time in
the right place.
Supplier development - suppliers must be developed so they can be more involved in the production process of the focal firm.
Customer involvement – focuses on a company’s customers and their needs. Pull – facilitates JIT production including “kanban” cards.
Continuous flow – Establishes a mechanism that enables and eases the continuous flow of products.
Setup time reduction – reduces process downtime between product changeovers. Total productive maintenance – achieves a high level of equipment availability. Statistical process control – ensures that each process will supply defect free units.
13 Employee involvement – employees’ role in solving problems and their cross functional
character is crucial. Agility
2.1.3
“Agility is an important factor in supply chains” - (Christopher, 2000).
Historical background 2.1.3.1
Agility as a concept received attention later when compared to lean (Naylor, et al., 1999). Mc Cullen and Towill (2001) suggest through a case study, that agile manufacturing can be a precursor to lean manufacturing. Others claim that leanness is foundational to agility (Katayama and Bennett 1999; Sharp et al 1999). Gunasekaran (2008) states that agile manufacturing is a natural development of the original concept of Lean production. However, while lean thinking has its origins clearly defined and directly related to the TPS, agility’s origins aren’t that explicit (Stratton and Warburton, 2003). Anyway, the concept of agility as an organizational orientation was born and brought to public in 1991 by a group of scholars (at Iaccoca Institute of Lehigh University in the U.S.) who believed that the route to manufacturing flexibility was through capacity to enable rapid changes, i.e. to ensure a greater responsiveness to changes in product mix or volume (Yusuf et al., 1999; Christopher, 2000).
The concept has raised a lot of interest amongst practitioners and academics alike, due to the need for organizations to become more responsive towards the needs of customers, whereas the conditions of competition are changing and markets have increased levels of economic and environmental turbulence (Aronsson, et al., 2011).
Agile SCM paradigm 2.1.3.2
When discussing leanness, efficiency is a central characteristic related to the paradigm. When it comes to agility, the main characteristic is responsiveness. An Agile Supply Chain (ASC) must be responsive to the market. In order to achieve this characteristic, it’s required speed and high level of maneuverability (Agarwal et al., 2006). Harrison and Van Hoek (2005) mentioned that a company’s speed capabilities are elevated when having an agile approach.
Some may have confused responsiveness, agility and flexibility between each other, until Reichhart and Holweg (2007) provided a clarification for that matter. They defined responsiveness as a form of external flexibility, i.e. visible to the customer and triggered by a customer order. Internal flexibility focuses on manufacturing and inbound logistics. Both types of flexibility are key prerequisites to a company´s agile capability.
Responding to unpredictable market changes (or unforeseen events) and capitalizing on them through fast delivery and lead-time flexibility is the main focus in an ASC (Swafford et al., 2008;
14
Vonderembse et al., 2006). However, SCs with high flexibility are more costly than SCs with low flexibility. Still, SC managers would prefer high flexibility over low flexibility, being the benefits of flexibility in general, obvious. More specifically, to implement ASC successfully, a firm must be able to respond to rapidly changing and continually fragmenting global markets by being dynamic, growth-oriented, context-specific, flexible across the organization and more importantly, driven by customer. In addition, if a company wants to be able to respond better to the changing expectations and requirements of the end-consumers, collaborative relationships with suppliers should be developed (Bruce and Daly, 2011). Moreover, the ASC paradigm is related to the interface between markets and companies (Vonderembse et al., 2006).
The critical elements in the ASC differ from the ones in the LSC. In the ASC innovation, speed, and flexibility are essential. Quality and reliability are obviously still important elements. As customers demand new and innovative solutions, it goes without saying that operating costs and efficiency have a reduced amount of significance. This is consistent with Christopher (2000), who states that agility refers to effective, flexible accommodation of unique customer demands. Furthermore, products are processed only after demand becomes known, i.e. speculative notions are ignored. Hence, ASC employs make-to-order supplying instead of make-to-stock replenishment used in the LSC, i.e. ASC doesn’t accumulate inventory (Stavrulaki and Davis, 2010).
Goldsby (2006) confirms that flexibility throughout the SC is a key factor when providing agile response. In manufacturing, this would mean being capable of, or having the capacity to produce in different sized batches when necessary, minimizing the wastes associated with machine setups and product changeovers. Agility might also require flexible workforce, with cross-trained employees. The products should also be designed in a way that raw materials can be easily and quickly converted into final products. For agile market accommodation, the firms must be responsive throughout the SC. In general, response-based SCs have few or no intermediaries, and frequent and open information sharing among entities is essential. In addition, suppliers should be located nearby. If the previous prerequisites are met, a firm is able to respond directly to the end-customer demand, which is the goal in an ASC. In order to get a proper response, the Efficient Consumer Response (ECR), the use of IT tools and Supply Chain Collaboration (SCC) play a huge role, i.e. increases visibility throughout the SC. With these improvements, it´s possible to capture data on sales directly from the point of sale and thus, responding properly to unpredictable market changes (Vonderembse et al., 2006).
Swafford et al. (2008) concluded, through a framework, that IT integration enhances SC flexibility, which in turn, enhances SC agility and furthermore a higher competitive business performance is achieved.
In an ideal situation, all virtual SC entities should be linked with a common information system. Gunasekaran (2008) agrees stating that effective SCM requires a strong partnership between suppliers
15 and customers and thus, a common information system. The referred virtual chains are based on information rather than inventory, as the business community is learning that the visibility of demand reduces complexity of control. Furthermore, information systems must be up-to-date and information has to be correct. In addition, communication between partners should be easy and painless (Kisperska-Moron and de Haan, 2011). Christopher (2000) also states that agility embraces not only organization structures and mind-sets, but also information systems. The author also adds that a truly agile SC must possess a few distinguishing characteristics. An ASC must be market sensitive, virtual, network-based and must embrace process integration. Agarwal et al. (2007) made an update on Christopher’s (2000) publication and came up with the following description on each of the referred characteristics:
Market sensitiveness – it is closely connected to the end-user and must provide daily P.O.S4. feedback, capture emerging trends and listen to consumers.
Information driven virtual integration – it has a shared information system among all SC partners on real demand, end-to-end visibility and collaborative planning.
Centralized and collaborative planning (network based) – it focuses on the core competencies, leverages partners’ capabilities and acts as a network orchestrator.
Process integration and performance management– it has a high degree of process interconnectivity between the network members meaning supply is synchronous, inventory is co-managed and product design is also collaborative.
In addition, Yusuf et al. (1999) summarizes agile manufacturing as high quality and highly customized products; products and services with high information and value-adding content; mobilization of core competencies; responsiveness to social and environmental issues; synthesis of diverse technologies; response to change and uncertainty; intra and inter- company integration.
Agility variables 2.1.3.3
According to Christopher and Towill (2001) and Van Hoek et al. (2001), the agility of a SC is dependent on quality improvement, cost minimization, lead time reduction and service level improvement. The study made in 2007 by Agarwal et al., confirmed that SC agility depends not only on these variables but also on customer satisfaction, delivery speed and new product introduction. In this article, the author claims that literature hasn´t taken into account the influence of interrelationships among the variables.
4
16
An agile manufacturing program constantly strives for improvement in performance in areas such as responsiveness, product customization, new product lead time shortening, and reduced system changeover costs and times and efficient scaling up and down of operations (Brown and Bessant, 2003).
Hybrid strategies 2.1.4
The goal of SCM is to achieve a perfect hybrid system mixing these two paradigms (or more) along the SC, in order to adjust the strategy to the market.
The leanness or agility needed depends upon the total SC strategy, in particular by considering the positioning of the decoupling point and market knowledge (Naylor 1999).
According to Christopher and Towill (2002), lean and agile paradigms can be implemented together within a SC, as long as they remain separated by time or space. Separation by time means that a SC can have an agile approach during summer and lean during winter. Separation by space means that one product is produced in a lean site whilst the other is manufactured in an agile plant. Cagliano (2004) claims that both paradigms perform better than traditional ones, but neither of them has a clear advantage over each other.
As a matter of fact, the lean and agile paradigms point out the same competitive priorities, even though they emphasize different elements. Christopher (2000) assures that quality, service level and lead time are market qualifiers for leanness, being cost the market winner. Likewise, Mason-Jones et al. (2000) claim service level to be the market winner for agile manufacturing, whereas cost, quality and lead time are qualifiers. Christopher and Towill (2001) is consistent with the service level being market winner for agile manufacturing. Table 2.2 shows the market qualifiers and winners for the ASC and the LSC.
Table 2.2 - Market winners and qualifiers for the ASC and the LSC Adapted from Mason-Jones et al. (2000).
Market Qualifiers Market Winners Agile Supply Chain Quality, Cost, Lead
Time Service Level
Lean Supply Chain Quality, Lead Time,
Service Level Cost
In order to better understand this concept of mixing the two paradigms, a few examples described by Goldsby (2006) are shown in the following:
Example 1: The first example embraces the Pareto rule, where 20% of the products generate 80% of a company’s profits. The dominant fast moving inventories (20%) should be manufactured in a Lean, Make-to-stock (MTS) manner. In these cases demand is relatively stable meaning the supply should be made in an efficient way in order to prevent stock outs.
17 Meanwhile the remaining 80% should be produced in a less anticipated, agile manner, maybe even in a Make-to-Order (MTO) manner.
Example 2: The second hybrid SC involves the characteristic of producing according to the demand, especially when it peaks. Most companies experience a stable demand during the year. Hence, demand is accommodated in a lean manner and a level schedule (Heijunka) is implemented to maintain highly efficient operations. However, there’re indeed some periods over the year where demand peaks, e.g. promotion periods. Therefore, agile operations are adopted and extra buffer capacity or flexibility must be available in order to accommodate demand of these distinct time windows.
Example 3: The third example is related to form-postponement. It calls for lean operations until reaching a generic or semi-finished Stock-Keeping-Unit (SKU) and in the customization process it uses the agile approach. When diverse needs are accommodated efficiently, one can refer to “mass customization”.
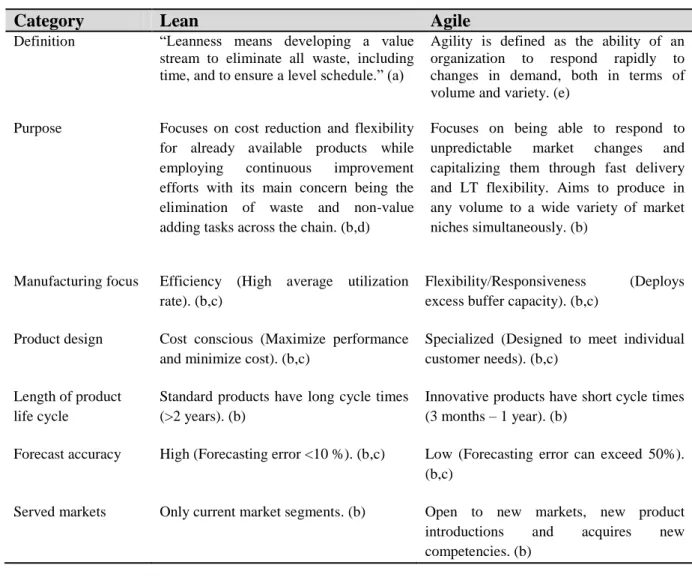
Finally, table 2.3 represents the characterization of both management paradigms, Lean and Agile, in addition to their respective SC characteristics.
Table 2.3 - Characterization of lean and agile supply chain management paradigms
Category
Lean
Agile
Definition “Leanness means developing a value
stream to eliminate all waste, including time, and to ensure a level schedule.” (a)
Agility is defined as the ability of an organization to respond rapidly to changes in demand, both in terms of volume and variety. (e)
Purpose Focuses on cost reduction and flexibility
for already available products while
employing continuous improvement
efforts with its main concern being the elimination of waste and non-value adding tasks across the chain. (b,d)
Focuses on being able to respond to
unpredictable market changes and
capitalizing them through fast delivery and LT flexibility. Aims to produce in any volume to a wide variety of market niches simultaneously. (b)
Manufacturing focus Efficiency (High average utilization rate). (b,c)
Flexibility/Responsiveness (Deploys
excess buffer capacity). (b,c)
Product design Cost conscious (Maximize performance
and minimize cost). (b,c)
Specialized (Designed to meet individual customer needs). (b,c)
Length of product life cycle
Standard products have long cycle times (>2 years). (b)
Innovative products have short cycle times (3 months – 1 year). (b)
Forecast accuracy High (Forecasting error <10 %). (b,c) Low (Forecasting error can exceed 50%). (b,c)
Served markets Only current market segments. (b) Open to new markets, new product
introductions and acquires new
18
Category
Lean
Agile
Profit margin, product variety and order lead time
Low (c) High (c)
Logistics processes focus
Efficiency (c) Flexibility (c)
Bullwhip effect Likely (c) Less likely (c)
Number of intermediaries
Large (c) Small (c)
Inventory strategy High inventory turnover rate 5.
Minimizes inventory throughout the chain. (b)
Makes inventory in response to direct customer demand. (b)
Approach to choosing suppliers
Supplier attributes involve low cost and high quality. (b)
Supplier attributes involve speed,
flexibility and quality as well. (b)
Organizational structure
Uses a static organizational structure with few levels in the hierarchy.
Creates virtual organizations with partners that vary with different product offerings that change frequently.
Alliances with suppliers and customers
At the operational level it uses traditional alliances such as partnerships and joint ventures. The demand information is spread along the chain. (f)
It uses a type of alliance known as virtual
organization, which has a shared
information system among all SC partners.
Legend: (a) Shah and Ward, 2007; (b) Vonderembse, et al., 2006; (c) Stavrulaki and Davis, 2010; (d) Mollenkopf, et al., 2010 (e) Christopher, 2000 (f) Carvalho et al., 2009
SCM practices and Key Performance Indicators 2.1.5
In order to improve SCP, a set of management practices have to be implemented. In addition, the impact of the implementation of each practice has to be measured through KPIs.
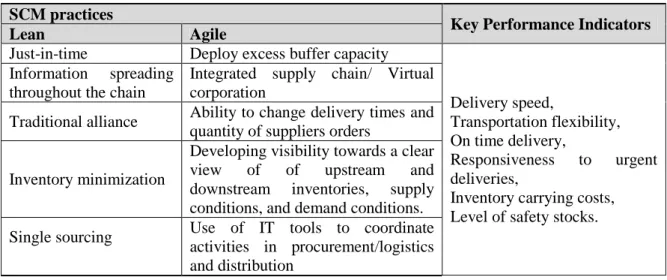
In table 2.4, a few Lean and Agile SCM practices and KPIs are highlighted. The literature (Carvalho et al., 2009; Azevedo et al., 2011; Carvalho et al., 2012) offered a vast number of SCM practices and KPIs, but only a few were selected. All practices should contribute to effective SC, based on the principle of each paradigm. Some practices may belong to both of the paradigms; the same goes for the KPIs.
5
19 Table 2.4 - SCM practices and Key Performance Indicators.
Adapted from: Azevedo et al., 2012; Carvalho et al., 2012; Carvalho et al., 2009; Azevedo et al., 2011 SCM practices
Key Performance Indicators
Lean Agile
Just-in-time Deploy excess buffer capacity
Delivery speed,
Transportation flexibility, On time delivery,
Responsiveness to urgent deliveries,
Inventory carrying costs, Level of safety stocks. Information spreading
throughout the chain
Integrated supply chain/ Virtual corporation
Traditional alliance Ability to change delivery times and quantity of suppliers orders
Inventory minimization
Developing visibility towards a clear view of of upstream and downstream inventories, supply conditions, and demand conditions. Single sourcing Use of IT tools to coordinate
activities in procurement/logistics and distribution
A conceptual model has been proposed by Azevedo et al. (2011) in order to assess the relationships between SCM practices and SC performance measures. Table 2.5 shows the influences of some SCM practices on the following SC operational and economic performance measures: Inventory level, quality of products, customer satisfaction, time and cost.
Table 2.5 - SCM measures versus management practices Adapted from: Azevedo et al., 2011
SCM Practices Operational Performance Economic Performan ce Inventory Levels Quality Customer
satisfaction Time Cost
Just in time
↓
↑
↓
↓
Supplier relationships
↓
↑
↓
↓
Speed in improving responsiveness to
changing market needs
↑
↓
Ability to change delivery times of
suppliers order
↓
↓
Developing visibility to a clear view of upstream inventories and supply conditions
↓
↑
↓
Lead time reduction
↑
↓
For instance, the proper implementation of JIT practices lowers inventory levels and consequently reduces cost. It also reduces time and enhances customer satisfaction.
Models for decision-making 2.1.6
People are known to believe that logical thinking is the one and only way to face and solve problems, i.e. to make good decisions. Yet, this goes against the fact that our mind besides rational, is also
20
emotional. The emotional side is associated with feelings intuitions and hunches, whereas the rational side is related with logical and structured reasoning (Saaty, 1990; Saaty, 1994). Rational decision-making is the talent we possess to be more effective in implementing our ideas in the real world (Saaty, 2005).
Our intuition is capable of dealing with simple problems, but has to be supported by rationality as the degree of complexity of the problem gets higher. Since complex problems normally have so many related variables, logical thinking may also be quite difficult, due to the sequences of ideas that are so tangled that their interconnections are not immediately discerned. As a matter of fact, rationality only applies to the objective and measurable parts of the problem, being incapable of capturing the subjective and qualitative aspects. Thus, there´re situations where neither logic nor intuition is of much help, unless combined (Saaty, 1990; Saaty, 1994).
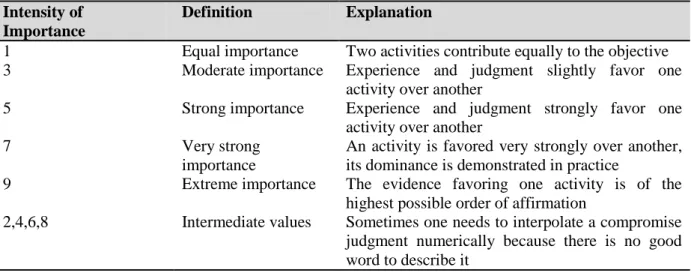
These multi-criteria decision-making (MCDM) methods facilitate decision-making by organizing perceptions, hunches, judgments and memories into a framework that shows the forces that influence a decision. It has been demonstrated by practitioners that multi criteria logic gives different and better answers than ordinary logic and does it in an efficient way (Saaty, 1994). Besides, the role of the inconsistency is emphasized. This framework deals with decisions in a structured way, by rigorously structuring the problem as a hierarchy or a network of all the factors and the influences among them, and by establishing the intensities of the influence relations through pairwise comparison judgments (Zammori, 2010). These judgments are elicited to express people’s understanding of the preference or importance of these elements on the final outcome achieved by synthesizing the priorities derived from different sets of pairwise comparisons (Whitaker, 2007). Pairwise comparisons are made through a comparison of two objects, where one has to decide on which is the smaller or lesser one according to a certain property or attribute. Afterwards, considering it as the unit, we ask how many times more dominant the larger one is with respect to that property than the smaller or less important one. This is a powerful way to derive priorities through judgments, as well as a several times validated one (by comparing the closeness of the derived outcome with actual measurements). Relative measurement makes it possible to create a hierarchic and network structure that relate diverse criteria which have bearing on the outcome of an issue or decision and determine the most likely outcome of these influences thus giving our creative thinking to structure problems greater effectiveness.
Hence, all the relevant knowledge and intuition that contributes to the decision are ‘scientifically” converged as means of discovering the rationale behind the best choice to be made and understanding how quantitative reasoning underlies and guides the decision. Furthermore, sensitivity analysis is performed to determine the stability of the outcome to wide perturbations in the judgments (Saaty, 2005).