1
Andreia Filipa dos Santos Gomes
Degree in Biochemistry
Proteomic analysis of a
neurodegeneration cell model, treated
with plant extracts with potential
neuroprotective activity
Dissertation to obtain a Master Degree in Biotechnology
Supervisor: Cláudia Santos, Ph.D, IBET/ITQB-UNL
Co-Supervisor: Marta Alves, Ph.D, ITQB-UNL
Jury:
President: Professor Rui Oliveira, Ph.D.
Examiner: Gabriela Almeida, Ph.D.
Supervisor: Cláudia Santos, Ph.D.
3
Andreia Filipa dos Santos Gomes
Degree in Biochemistry
Proteomic analysis of a neurodegeneration cell model,
treated with plant extracts with potential
neuroprotective activity
Dissertation to obtain a Master Degree in Biotechnology
Supervisor: Cláudia Santos, Ph.D, IBET/ITQB-UNL
Co-Supervisor: Marta Alves, Ph.D, ITQB-UNL
Jury:
President: Professor Rui Oliveira, Ph.D.
Examiner: Gabriela Almeida, Ph.D.
Supervisor: Cláudia Santos, Ph.D.
5
Proteomic analysis of a neurodegeneration cell model, treated with plant extracts with potential neuroprotective activity
Copyright Andreia Gomes, FCT/UNL, UNL
A Faculdade de Ciências e Tecnologia e a Universidade Nova de Lisboa têm o direito, perpétuo e sem limites geográficos, de arquivar e publicar esta dissertação através de exemplares
impressos reproduzidos em papel ou de forma digital, ou por qualquer outro meio conhecido ou que venha a ser inventado, e de a divulgar através de repositórios científicos e de admitir a sua
cópia e distribuição com objetivos educacionais ou de investigação, não comerciais, desde que seja dado crédito ao autor e editor.
The Faculty of Science and Technology and the New University of Lisbon have the perpetual
right, and without geographical limits, to archive and publish this dissertation through press copies in paper or digital form, or by other known form or any other that will be invented, and to divulgate it through scientific repositories and to admit its copy and distribution with
vii
Acknowledgments
All words will be few to express my gratitude to all who helped me in this stage of my life.
In special, I would like to thank to Cláudia Nunes dos Santos, PhD, and Marta Alves, PhD, my
supervisors, for all the support, guidance and accuracy through this year. All this work would
not have been possible without your help. You made me a better researcher and I’m so grateful
for that.
To Professor Ricardo Boavida Ferreira, my sincere gratitude for having received me in the
Disease and Stress Biology lab.
I would also like to express my gratitude to all the Disease and Stress Biology lab team, for the
support and cooperation gave during this year, in particular to Inês Figueira and Lucélila Tavares. Thanks for all the laughs we took together. It was a pleasure working with you.
I cannot forget my family, especially my mother, father, César and Adriano for all the trust and
for always believing in me. All I am I owe it to you.To all, thank you.
“Failure teaches us that life is but a draft,
an endless rehearsal of a show that will never play.”
ix
Abstract
Nowadays, a significant increase in chronic diseases is observed. Epidemiological studies showed a consistent relationship between the consumption of fruits and vegetables and a
reduced risk of certain chronic diseases, namely neurodegenerative disorders. One factor common to these diseases is oxidative stress, which is highly related with proteins, lipids, carbohydrates and nucleic acids damage, leading to cellular dysfunction.
Polyphenols, highly abundant in berries and associated products, were described as having antioxidant properties, with beneficial effect in these pathologies.
The aims of this study were to evaluate by proteomic analyses the effect of oxidative insult in a neuroblastoma cell line (SK-N-MC) and understand the mechanisms involved in the
neuroprotective effects of digested extracts from commercial and wild blackberry
(R. vagabundus Samp.).
The analysis of the total proteome by two-dimensional electrophoresis revealed that oxidative stress in SK-N-MC cells resulted in altered expression of 12 protein spots from a total of 318.
Regarding some redox proteomics alterations, particularly proteins carbonylation and glutathionylation, protein carbonyl alterations during stress suggest that cells produce an early
and late response; on the other hand, no glutathionylated polypeptides were detected.
Relatively to the incubation of SK-N-MC cells with digested berry extracts, commercial
blackberry promotes more changes in protein pattern of these cells than R. vagabundus. From 9
statistically different protein spots of cells incubated with commercial blackberry, only
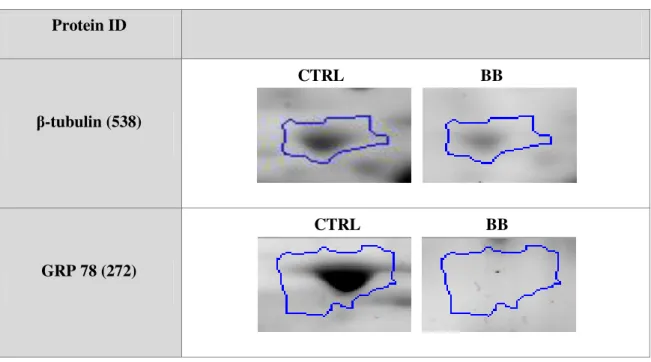
β-tubulin and GRP 78 were until now identified by mass spectrometry.
Further studies involving the selection of sub proteomes will be necessary to have a better understanding of the mechanisms underlying the neuroprotective effects of berries.
xi
Resumo
Nos dias de hoje assistimos a um aumento significativo das doenças crónicas. Estudos epidemiológicos mostraram uma relação consistente entre o consumo de frutas e vegetais e uma
redução do risco de certas doenças crónicas, nomeadamente doenças neurodegenerativas. Um fator comum a estas doenças é o stresse oxidativo, que está relacionado com danos nas proteínas, lipídios, hidratos de carbono e ácidos nucleicos levando à disfunção celular.
Os polifenóis, muito abundantes em pequenos frutos e produtos associados, foram descritos como tendo propriedades antioxidantes com efeito benéfico nestas patologias.
Desta forma, este estudo teve como objetivos a avaliação do efeito do stresse oxidativo numa linha celular de neuroblastoma humano (SK-N-MC) e dos mecanismos envolvidos nos efeitos
neuroprotetores de extratos digeridos de amoras comerciais e de uma variedade endémica (R.
vagabundus Samp.) recorrendo à proteómica.
A análise do proteoma total por eletroforese bidimensional revelou que o stresse oxidativo
imposto às células SK-N-MC promoveu a alteração de 12 spots proteicos num total de 318.
Em relação a algumas alterações redox nas células, particularmente carbonilação e glutationilação proteica, a resposta das proteínas carboniladas ao stresse ao longo do tempo
sugerem que as células respondem de forma diferente no início e no final do período de stresse ao qual estão sujeitas. Por outro lado, não foram detetadas proteínas glutationiladas.
Relativamente à incubação das células SK-N-MC com extratos de amoras, a variedade
comercial promove mais mudanças no padrão das proteínas do que a R. vagabundus. Dos 9
spots proteicos estatisticamente diferentes das células incubadas com amora comercial, apenas a
β-tubulina e a GRP 78 foram identificados até agora através de espectrometria de massa.
Estudos adicionais envolvendo a seleção de subproteomas serão necessários para uma melhor
compreensão dos mecanismos subjacentes aos efeitos neuroprotetores das amoras.
xiii
General Index
Acknowledgments ... vii
Abstract ... ix
Resumo ... xi
General Index ... xiii
Index of Figures ... xv
Index of Tables ... xvii
Abbreviations ... xix
1. Objectives ... 1
2. Theoretical Fundaments ... 3
2.1. Neurodegeneration ... 3
2.1.1. Neurodegeneration and Oxidative Stress ... 3
2.1.2. Neurodegeneration and Berries ... 4
2.1.2.1. Bioavailability –In vitro Digestion ... 5
2.2. Proteomics ... 6
2.2.1. Total proteome analysis ... 6
2.2.2. Redox Proteomics ... 7
2.2.2.1. Protein carbonylation ... 8
2.2.2.2. Protein glutathionylation ... 9
3. Material and Methods ... 11
3.1. Chemicals ... 11
3.2. Plant Material ... 11
3.4. In vitro digestion ... 12
3.5. Cell Culture ... 12
3.6. Time course profile of cells incubated with hydrogen peroxide ... 12
3.7. Incubation of cells with digested plant extracts ... 13
3.8. Protein Quantification ... 13
3.9. Electrophoresis ... 13
3.9.1. 1D Electrophoresis ... 13
3.9.2. 2D Electrophoresis ... 14
3.9.3. Gel Staining ... 14
3.9.3.1. Commassie Brilliant Blue ... 14
3.9.4. 2DE Gel analysis ... 15
3.10. Mass spectrometry analysis ... 15
xiv
3.11.1. Electrotransfer of polypeptides ... 16
3.11.2. Ponceau S Staining ... 16
3.11.3. Immunodetection ... 17
3.12. Measurement of glutathione released from glutathionylated proteins ... 17
3.13. Statistical Analysis ... 18
4. Results and Discussion ... 21
4.1. Evaluation of Oxidative Stress ... 21
4.1.1. Time course profile of protein extracts from SK-N-MC cells treated with hydrogen peroxide ………. 21
4.1.2. Protein Carbonyls ... 27
4.1.3. Protein S-Glutathionylation ... 29
4.2. Protein pattern of SK-N-MC cell line treated with different digested berry extracts... ... 32
5. Final considerations and future perspectives ... 41
6. Bibliography ... 43
xv
Index of Figures
Fig. 2.1 - Representative scheme of the in vitro digestion model, adapted from Aura A. M. and
McDougall G. J, et al. [28, 29] ... 5
Fig. 2.2 - Involvement of oxidative stress in the pathophysiology of cells, adapted from Radak, Z., et al. [48]. ... 8
Fig. 4.1 - (A) Representative 2DE control gel of SK-N-MC cells (65 µg).The gel was CBB stained. Twelve spots were found to change quantitatively between the control and stress conditions evaluated (0-24 h), and numbered spots have been sent for protein identification by MS; (i) Zoom in of some protein spots of 2DE gel with high contrast; (B) Comparison of protein spots differentially expressed against control, white columns for upregulated proteins and gray column for downregulated protein spots. ... 22
Fig. 4.2 - (A) Protein carbonyl profile of SK-N-MC cells submitted to oxidative injury (300 µM
H2O2) with different times of exposure (0-24 h), in comparison to control (CTRL), as well
as oxidized BSA (Ox. BSA – positive control); (B) immunodetection of the loading control
(β-actin). Protein carbonyl profile was obtained after sample derivatization using
OxyBlot™ Protein Oxidation Detection kit (Intergen) Western blot was exposed to chemiluminescence detection using FemtoMax Super Sensitive Chemiluminescent HRP
Substrate – Rockland Inc. A representative image is shown... 28
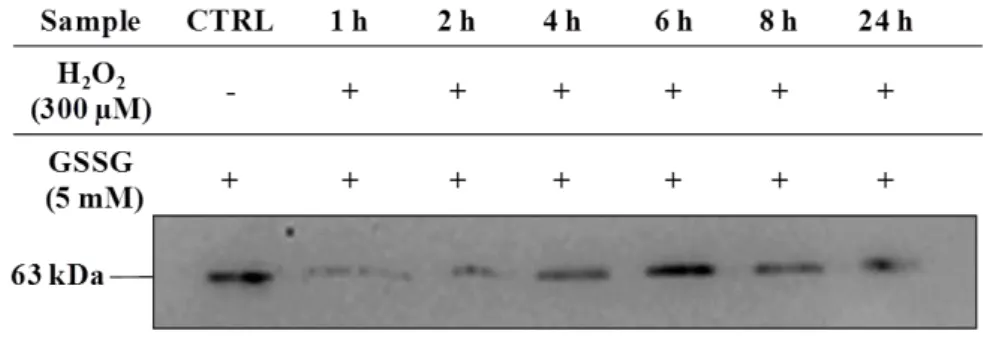
Fig. 4.3 - Protein glutathionylation profile of SK-N-MC cells submitted to oxidative injury
(300 µM H2O2) with different times of exposure (0-24 h), in comparison to (A) control
(CTRL), as well as (B) oxidized samples with 5 mM GSSG. Glutathionylated protein profile was obtained after incubation with mouse anti-GSH antibody (Virogen). Western blot was exposed to chemiluminescence detection using FemtoMax Super Sensitive
Chemiluminescent HRP Substrate – Rockland Inc. A representative image is shown ... 30
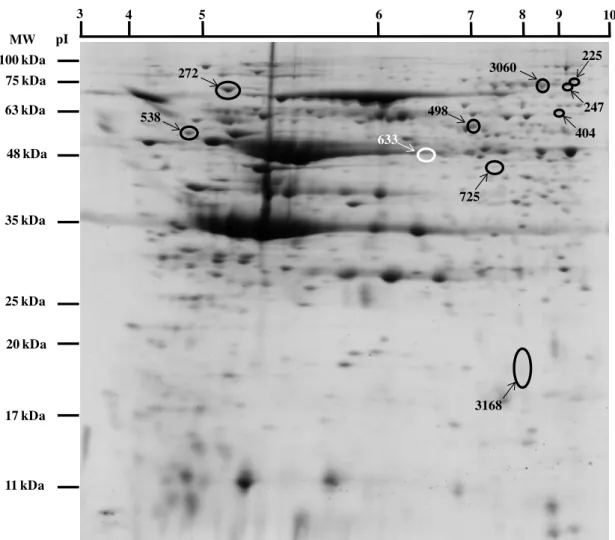
Fig. 4.4 - Representative 2DE control gel of SK-N-MC cells. The gel was CBB stained. One
protein spot (white spot) from SK-N-MC cells incubated with R. vagabundus (RV) during
24 h and 9 protein spots (black spots) from SK-N-MC cells incubated with commercial blackberry (BB) during 24 h were statistically different from control. Numbered spots were sent for protein identification by MS. ... 33
Fig. 4.5 - Time course profile for the expression of GRP 78 in SK-N-MC cells when incubated
for different periods of time (0-24 h) with 300 µM H2O2. ... 39
Fig. 4.6 - Scheme of the hypothetical effect of commercial blackberry (A) and R.vagabundus
xvi
Fig. S1 - Thiols time course profile of stressed SK-N-MC cells: GSH. SK-N-MC cells were
submitted to an oxidative stress (300µM H2O2) for different incubation periods (0-24 h)
and protein cellular extracts were derivatized and quantified by HPLC with fluorescence detector. Glutathione-OPA adduct was monitored at excitation and emission wavelengths of 350 and 420 nm, respectively. Quantifications of GSH were normalized for total protein content. Represented values are the averages ± S.D. of at least three independent determinations. Differences between treatments in relation to control are denoted as
*p<0.05 **p<0.01. Data provided by a colleague from DSB Lab. ... 49
Fig. S2 - (A) Caspase-3 and -7 activity from SK-N-MC cells when incubated with 0.5 µg GAE
mL-1 of commercial blackberry (BB) or R.vagabundus (RV); Differences between
treatments in relation to control (CTRL) are denoted as *p<0.05 **p<0.01 (B) Caspase-3
and -7 activity from SK-N-MC cells when pre-incubated with 0.5 µg GAE mL-1 of
commercial blackberry (BB) or R.vagabundus (RV) and then submitted to oxidative stress
(300 µM H2O2); Differences between treatments in relation to oxidative stress (Stress) are
xvii
Index of Tables
Table 3.1 - Antibodies and dilutions used in Western blot analyses. ... 17
Table 4.1 - Time course profile for the expression of protein spots differentially expressed in
SK-N-MC cells tretated with 300 µM H2O2 and their characteristics (pI and MW (kDa)).
Differences between treatments in relation to control are denoted as *p<0.05 **p<0.01,
***p<0.001. ... 23
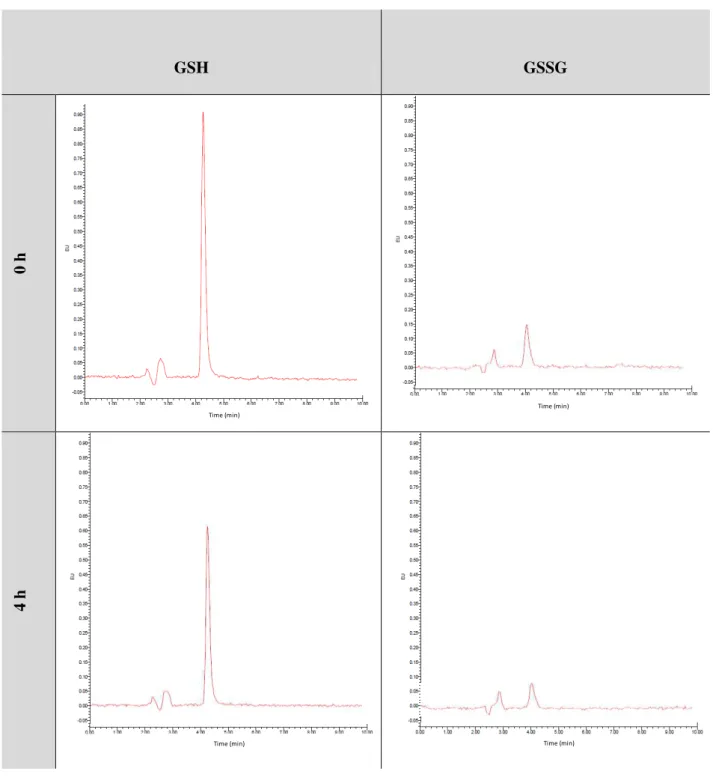
Table 4.2 - HPLC chromatograms of GSH and GSSG for SK-N-MC cells incubated with H2O2 (300 µM) during 4 h and HPLC chromatograms for GSH released from glutathionylated proteins (PSSG) relatively to SK-N-MC control cells (0 h). Glutathione-OPA adduct was monitored at excitation and emission wavelengths of 350 and 420 nm, respectively. ... 31
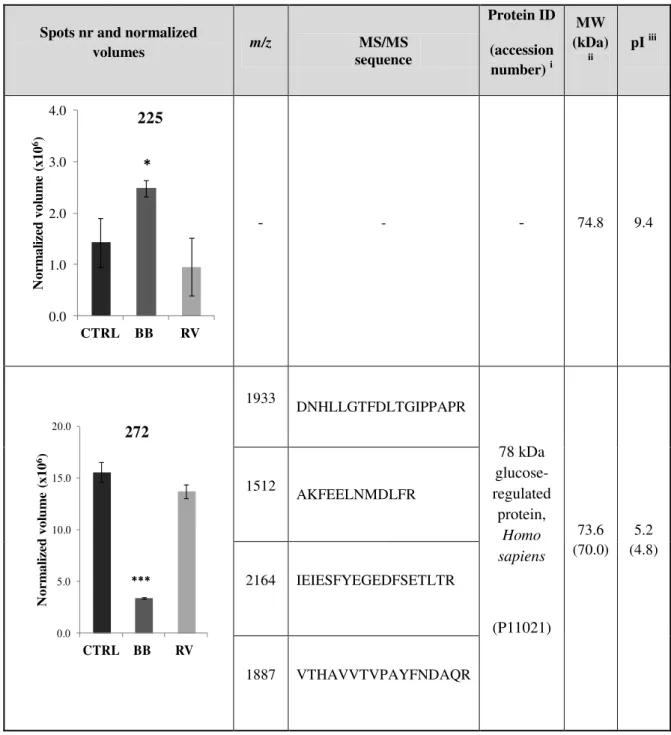
Table 4.3 - Normalized volumes for protein spots in SK-N-MC cells treated with commercial
blackberry (BB) and R. vagabundus ( RV) differentially expressed from control (CTRL)
and their characteristics (pI and MW (kDa)). Differences between treatments in relation to
control are denoted as *p<0.05 **p<0.01 ***p<0.001. ... 34
xix
Abbreviations
1DE– One Dimensional Electrophoresis;
2DE– Two-dimensional electrophoresis;
3-NT - 3-Nitrotyrosine;
AD –Alzheimer’s Disease;
ANOVA– Analysis of Variance;
BB – digested extracts from commercial blackberry;
BSA – Bovine Serum Albumine;
CBB– Commassie Brilliant Blue;
CDI –Collision-Induced Dissociation;
CHAPS– 3[(3-Cholamidopropyl)dimethylammonio]-propanesulfonic acid;
CNS– Central Nervous System;
CTRL – Control;
DNP – 2,4-Dinitrophenylhydrazone;
DNPH – 2,4-Dinitrophenylhydrazine;
DTT – Dithiothreitol;
EDTA – Ethylenediamine Tetra-Acetic Acid;
EMEM – Eagle Minimum Essential Medium;
FBS– Fetal Bovine Serum;
GAE – Gallic Acid Equivalents;
GI – Gastro Intestinal;
GSH – Glutathione;
GSSG – Glutathione disulfide;
HNE -
4-hydroxy-2-
trans
-nonenal;
HPLC– High Performance Liquid Chromatography;
HRP – Horseradish Peroxidase;
HSD– Honest Significant Difference;
IEF– Isoelectric Focusing;
IVD–In vitro Digestion;
MALDI –Matrix-Assisted Laser Desorption/Ionization;
MS–Mass Spectrometry;
MS/MS – Mass Spectrometry/Mass Spectrometry;
xx
MW– Molecular Weight;
NEM –n-Ethylmaleymide;
NOS – Nitrosative Oxygen Species;
OPA – Orthophthaldehyde;
ORAC– Oxygen Radical Absorbance Capacity;
PBS– Phosphate Buffer Saline;
PD–Parkinson’s disease;
pI– Isoelectric Point;
PSH– Protein Sulfidryl groups;
PSSG– Protein S-glutathionylated;
PTM’S– Pos-translational Modifications;
PVDF – Polyvinylidene Fluoride
ROS – Reactive Oxygen Species;
RV – digested extracts from Rubus vagabundus Samp;
SAF– Serum Available Fraction;
SDS-PAGE– Sodium Dodecyl Sulphate-Polyacrylamide Gel Electrophoresis;
Proteomic analysis of a neurodegeneration cell model, treated with plant extracts with potential neuroprotective activity
1
1. Objectives
Neurodegenerative disorders are an increasing concern of the World’s population.
Understanding the mechanisms underlying the development of these disorders is a crucial step in the quest for alternative therapies or even in the prevention of these diseases.
Recently, berries upsurge as potential functional foods in the prevention of neurodegenerative diseases.
In order to have insights of the metabolic pathways involved in oxidative stress responses and
neuroprotective effect of digested berry extracts (commercial blackberry and R. vagabundus) an
in vitro cell model will be used to: i) study the alterations that occur in the total proteome,
protein carbonylation and glutathionylation of a neurodegeneration cell model, which uses SK-N-MC cells submitted to oxidative injury; and ii) study the alterations that occur in the total
proteome of the human neuroblastoma SK-N-MC cells incubated with digested berry extracts. A detailed analysis of the protein profiles obtained using appropriate software for image
analyses should be performed to pinpoint the polypeptides that respond to the conditions imposed to the cells. The identification of those polypeptides will contribute to the overall
Proteomic analysis of a neurodegeneration cell model, treated with plant extracts with potential neuroprotective activity
Proteomic analysis of a neurodegeneration cell model, treated with plant extracts with potential neuroprotective activity
3
2. Theoretical Fundaments
2.1. Neurodegeneration
Neurodegeneration may be a consequence of various forms of neural cell death, e.g. necrosis
and apoptosis. These forms of cell death may result from a variety of cellular insults, including
excitotoxicity and oxidative stress [1-3]. Commonly, neurodegeneration is defined by the progressive loss of specific neuronal cell populations and is associated with protein aggregates.
Alzheimer’s disease (AD) is the most common age-associated neurodegenerative disorder; is characterized by dementia, cognitive impairment and memory loss, which in the near future will affect around 22 million persons in the world [4-6]. AD is characterized by the accumulation of
extracellular amyloid-β deposited in senile plaques, and intracellular neurofibrillary tangles
composed principally of abnormal and hyperphosphorylated tau protein [7].
The second most common neurodegenerative disorder affecting elderly people is Parkinson’s
disease (PD). The patients suffer from progressive loss of dopaminergic neurons in basal
ganglia and the substantia nigra, which entails a substantial decrease of the neurotransmitter
dopamine [8].
AD and PD are all major neurodegenerative disorders where oxidative stress is implicated. Many proteomic studies have provided confirmation of the oxidative damage of particular
proteins in these diseases [3, 9].
2.1.1.Neurodegeneration and Oxidative Stress
Oxidative stress can induce neuronal cell death in a variety of circumstances and is a condition
in which the imbalance of reactive oxygen species (ROS) and reactive nitrosative species (NOS) production and the level of antioxidants are significantly disturbed resulting in damage to cells
[3, 10]. Indeed, ROS/NOS are able to modulate the function of biomolecules causing protein, DNA, RNA oxidation, or lipid peroxidation contributing for the progression of
neurodegeneration [10]. Compared to DNA and lipids, proteins are the most abundant cellular targets for oxidation [11]. Therefore, protein oxidation may disrupt cellular functions by altering
protein expression, gene regulation, protein turnover and modulation of cell signaling, among others alterations. Typical oxidative modifications of brain proteins involve carbonyls,
protein-bound 4-hydroxy-2-trans-nonenal (HNE) and 3-nitrotyrosine (3-NT), thiol groups oxidation and glutathionylation [8].
Central Nervous System (CNS) is said to be especially sensitive to oxidative stress because it
Proteomic analysis of a neurodegeneration cell model, treated with plant extracts with potential neuroprotective activity
4
it is relative deficient in the enzymes that metabolize a number of oxygen-based reactants to
innocuous species, and highly enriched in polyunsaturated fatty acids which are readily oxidized by toxic oxygen derivates [12, 13].
In our lab, Disease and Stress Biology (DSB) Lab, SK-N-MC cell line is used as a human neuronal cell model. It is a clonal neuroblastoma cell line composed of small fibroblast-like
cells which contain a reduced cytoplasm. This is a continuous cell line, obtained from human metastic neuroblastoma tissue [14]. Cellular models may have some limitations but they are a
very helpful way to try to reproduce and manipulate molecular mechanisms that can be extrapolated for whole organisms, offering a faster approach to get solid results and providing
valuable biochemical information.
To create a neurodegeneration cell model, cultured SK-N-MC are exposed to relatively low
concentration of hydrogen peroxide (H2O2) that induces changes in cell metabolism leading to
some neuronal cell death, mimicking what may occur during neurodegeneration [15].
2.1.2.Neurodegeneration and Berries
Berries are rich sources of a wide variety of antioxidant phenolics such phenolic acids, flavonoids, stilbenes and tannins, which are associated with many biologically significant mechanism of action, like scavenging and detoxification of ROS [16].
The importance of the diet in relation to human health has increased the interest of consumers about rich diets, which include fruits and vegetables [16].
Epidemiological studies have shown a consistent relationship between the consumption of fruits and vegetables and a reduced risk of certain chronic diseases such as neurodegenerative disorders. In particular, berries and associated products have an increasing focus of attention, not only because of its high nutritional value and beneficial effects to human health, but also because they are crops with agro-economic importance [17-19].
Some in vitro studies demonstrate a potent antioxidant, antiproliferative and anti-inflammatory activities of blackberry; moreover studies with rodents have revealed an attenuation of brain aging when these fruits are ingested [20-22].
Proteomic analysis of a neurodegeneration cell model, treated with plant extracts with potential neuroprotective activity
5
2.1.2.1. Bioavailability –In vitro Digestion
The health effects of phenolic compounds are largely dependent upon their bioavailability. The
commonly accepted definition of bioavailability is the proportion of the polyphenols that is digested, absorbed and metabolised. Consequently, it is not only important to know how much of a polyphenol is present in a food or dietary supplement, but even more important to know
how much of that is bioavailable, i.e. the quantity of polyphenols that reach the target tissue
[27].
Various studies established that the chemical structure of phenolics reaching the peripheral circulation and tissues differ from those present in foods, due to the biotransformation in the
gastrointestinal tract (GI) [24]. Since the GI-tract is a barrier of access of phytochemicals to
other organs, the use of an in vitro digestion procedure provides a simple and rapid method to
assess the potential stability of phytochemicals from fruits [28].
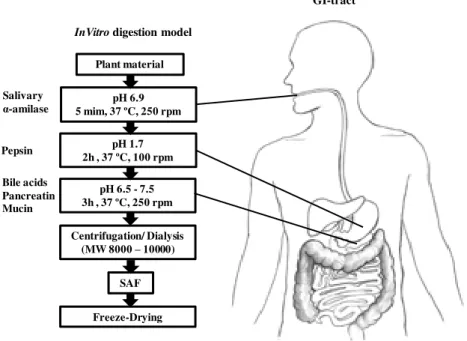
In order to understand the mechanisms underlying the neuroprotection of digested berry
polyphenols, we used a invitro digestion model (IVD) that simulates the physicochemical and
biochemical changes that occur in the GI-tract (Fig. 2.1) [28].
Serum available fractions (SAF) from commercial blackberry (BB) and R. vagabundus Samp.
(RV) obtained by IVD were used in the neurodegeneration cell model to evaluate the
mechanisms involved in the neuroprotective effects of these two species by using proteomic analyses.
Fig. 2. 1 -Representative scheme of the in vitro digestion model, adapted from Aura A. M. and McDougall G. J, et al. [28, 29]
InVitrodigestion model
Plant material
pH 6.9 5 mim, 37 ºC, 250 rpm
pH 1.7 2h , 37 ºC, 100 rpm
pH 6.5 - 7.5 3h , 37 ºC, 250 rpm
Centrifugation/ Dialysis (MW 8000 –10000)
SAF
Freeze-Drying Salivary
α-amilase Pepsin
Bile acids Pancreatin Mucin
Proteomic analysis of a neurodegeneration cell model, treated with plant extracts with potential neuroprotective activity
6
2.2. Proteomics
The knowledge gathered so far indicate that proteins are involved in almost all biological activities meaning that the study of the proteome of a cell or organism can contribute to the
understanding of biological systems [30, 31]. As in the case of the understanding of disorders in
the nervous system, where proteomic approaches are being successively used.
The comparative analysis of cerebral disorders such AD and PD is one of many examples where proteomics plays an important role [8].
Several technologies can be used in proteomic research being the gel-based applications (one and two-dimensional polyacrylamide gel electrophoresis (1DE or 2DE)) one of the most
commonly used approaches [32-35]. However, for the characterization of a complex proteome a combination of different proteomic approaches can be used [31].
Nevertheless, proteomic research is still dealing with some difficulties due the origin and complexity of the protein extract, physical and chemical properties of certain proteins and
instrumental limitations. Therefore, proteomics is an ongoing and developing field with the existing technologies being still further improved [36].
2.2.1.Total proteome analysis
An ideal separation method would be able to resolve, in a single map, all of the proteins expressed by a single cell. Current technologies, however, have not achieved this resolution yet,
and nowadays the only available technique that provides a global profile of a cell proteome is high resolution two-dimensional electrophoresis (2DE) [37]. This technique was developed
during the 1970s, and is the first approach and probably still the most frequently used technique to separate complex protein mixtures prior to downstream protein characterization by mass
spectrometry (MS) [4, 31, 36, 38, 39]. The 2DE is based on two important physicochemical properties of the polypeptides: isoelectric point (pI), the specific pH at which the net charge of
the protein is zero, and molecular weight (MW) [4].
Protein spots on 2DE gels can be visualized by a variety of protein staining techniques, each
with specific technical aspects, sensitivity, linear range for quantification, reproducibility and compatibility with mass spectrometry [36] .
After 2DE gel image acquisition analysis by specialized software is performed. These
software’s are used for spot detection, spot matching, and comparison of spot intensities among
several gels [36]. Then the protein spots of interest can be identified by MS. This technique
Proteomic analysis of a neurodegeneration cell model, treated with plant extracts with potential neuroprotective activity
7
2.2.2.Redox Proteomics
Redox proteomics approaches aims to identify oxidatively modified proteins such as protein
carbonyls, 3-NT-, and HNE-modified proteins in various biological samples in redox signaling scenarios and oxidative stress [40-43].
Oxidatively modified proteins can have repercussions at both physiological and pathological
levels [43-45]. One consequence of protein oxidation can be conformational changes, thereby leading to exposure of the hydrophobic amino acids residues to an aqueous environment,
promoting protein aggregation and accumulation of the oxidized proteins as cytoplasmatic inclusions. Another consequence can be the loss of tertiary structure of a protein consequently
affecting its function [8, 42].
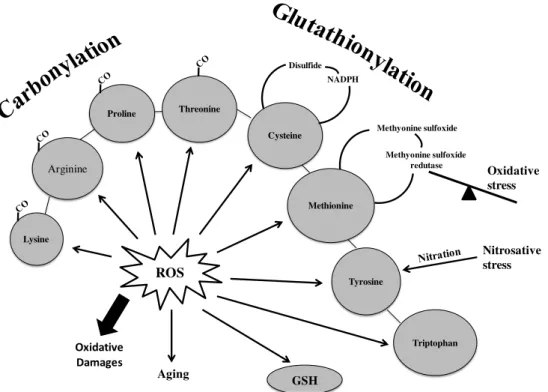
Some amino acids like lysine, arginine, proline and threonine side-chains can be oxidatively
converted to reactive aldehyde or ketone groups causing inactivation, cross-linking or breakdown of proteins. Also sulphur-containing residues, cysteine and methionine, are
especially susceptible to oxidation, and cysteines can be also oxidized forming disulfides in proteins or as mixed disulfides with cysteine or GSH (Fig. 2.2) [46, 47].
In redox proteomics approaches the same principles for separation and identification of proteins are employed, however a 2DE Western Blot is used in complement to immunochemically detect
oxidatively modified proteins [40, 41].
Redox proteomics methods for the detection of protein carbonylation and glutathionylation allowed the identification of various oxidatively modified brain proteins in a variety of
neurodegenerative disorders or associated models, providing new insights to the mechanisms of these diseases, namely identification of associated markers. The identification of oxidatively
Proteomic analysis of a neurodegeneration cell model, treated with plant extracts with potential neuroprotective activity
8
Fig. 2.2 - Involvement of oxidative stress in the pathophysiology of cells, adapted from Radak, Z., et al. [48].
2.2.2.1. Protein carbonylation
The detection of protein carbonylation are general and widely used markers to determine the
extent of oxidative modifications in aging and physiological disorders, including
neurodegenerative diseases either in vivo or in vitro conditions (Fig. 2.2) [40, 49].
The usage of protein carbonyl groups as biomarkers for oxidative stress has some advantages in comparison with the measurement of other oxidation products, due to their relative early
formation and relative stability of carbonylated proteins [50].
Protein carbonylation may occur via: i) oxidation of the protein backbone leading to the
formation of protein fragments with a N-terminal α-ketoacyl amino acid residue; ii) oxidation
of some amino acids side chains: histidine, arginine and lysine, into ketone or aldehyde derivates; iii) reaction with products of lipidic peroxidation, and conjugation with reducing
sugars or their oxidation products [49].
Protein carbonyls most often are detected by derivatization with 2,4-dinitrophenylhydrazine
(DNPH), that reacts with carbonyl groups to form protein resident-2,4-dinitrophenylhydrazona (DNP), which can be detected using commercially available anti-DNP antibodies [46, 51].
ROS Lysine
Arginine
Proline Threonine
Cysteine
Methionine
Tyrosine
Triptophan
Oxidative Damages
Aging
Disulfide NADPH
Methyonine sulfoxide
Methyonine sulfoxide redutase
Oxidative stress
Nitrosative stress
Proteomic analysis of a neurodegeneration cell model, treated with plant extracts with potential neuroprotective activity
9
2.2.2.2. Protein glutathionylation
The thiol redox state can also be use to reflect the oxidant conditions in a biological system.
Thiols have numerous functions, including a central role in antioxidant defense [52]. This antioxidant system includes a low molecular weight thiol compound, glutathione, GSH,
composed of three amino acids: δ-glutamyl-cysteinyl-glycine, in which the thiol on the cysteine plays an important role in maintaining the cellular redox state under oxidative stress [53, 54]. An increase in ROS/NOS may induce reversible formation of mixed disulfides between protein
sulfydryl groups (PSH) and glutathione on multiple proteins (S-glutathionylation), however, S
-glutathionylation is an oxidative pos-translational modification (PTM) that occur also on some protein cysteines under basal conditions [53, 55].
Nowadays S-glutathyonilation is considered a regulatory event in redox signaling and it is
involved in physiological processes including kinase signaling, channel function, apoptosis and regulation of transcription [56].
The measurement of glutathionylated proteins by Western blot analysis has emerged as the technique of choice. This approach is possible due to the availability of antibodies that
recognize GSH-protein complexes [46, 57].
Also a high performance liquid chromatography (HPLC) procedure can be used for the
determination of GSH released from the proteins, an indirect way to determine the extent of protein glutathionylation in a biological system [58].
Proteomic analysis of a neurodegeneration cell model, treated with plant extracts with potential neuroprotective activity
Proteomic analysis of a neurodegeneration cell model, treated with plant extracts with potential neuroprotective activity
11
3. Material and Methods
3.1. Chemicals
Eagle Minimum Essential Medium (EMEM), L-glutamine, non-essential aminoacids, hydrogen
(H2O2) peroxide, dithiothreitol (DTT), n-ethylmaleimide (NEM), thiourea, glycerol, sodium
pyruvate, sodium azide, formaldehyde and Tween-20®, glycerol, sodium borohydride, m-cresol
and phenantroline were order from Sigma-Aldrich® (Sintra, Portugal). Opti-Protein XL Marker
was from abm® (Richmond, Canada) Penicillin-streptomycin, trypsin and foetal bovine
serum
(FBS)
were order from Gibco® (New York, USA). Triton X-100, sodium dodecyl sulphate(SDS), Ponceau S, trichloroacetic acid and sulfossalicylic acid were order from Merck S.A.
(Lisbon, Portugal). Acetic acid and ethanol were order from Panreac S.L.U (Barcelona, Spain). Acrylamide:Bis 29:1, commassie brilliant blue G and phosphoric acid were order from Carl
Roth® (Karlsruhe, Germany). Sodium carbonate and urea were from Riedel-de Haёn®
(Hanover, Germany). DNase I was order from Roche (Basel, Switzerland), and protease
inhibitor cocktail EDTA-free were order from Calbiochem® (Massachusetts, USA). Ammonium sulphate was order from Prolabo® (Carnaxide, Portugal) and methanol was from
Carlo Erba (Telheiras, Portugal).
Rabbit anti-DNP antibody and Goat Anti-Rabbit IgG HRP conjugated were order from
Millipore (Billerica, USA). Mouse anti-GSH antibody was order from Virogen (Watertown, USA), Stabilized Rabbit Anti-mouse HRP conjugated and Goat anti-Rabbit HRP conjugated
were from Thermo Fisher Scientific Inc. (Waltham, USA). Rabbit anti-actin antibody was order
from Frilabo Lda (Porto, Portugal).
3.2. Plant Material
Commercial blackberry (Rubus L. Subgenus Rubus Watson) cv. Apache was grown in Fataca
Experimental field (Odemira, Portugal) and berries were harvested at full ripeness.
Fruits of a wild blackberry species (R. vagabundus Samp.) were collected in September 2009 in
Bragança region (northeast region of Portugal) and stored at -80 ºC. Fruits were collected from several populations, growing in different locations in order to be representative of species. For
this specie, voucher samples were authenticated and deposited at herbarium “João de Carvalho e
Vasconcelos”, Instituto Superior de Agronomia, Lisbon, Portugal [23].
3.3. Extract Preparation
The samples were freeze-dried, ground without separation of seeds in an IKA M20 mill to pass
Proteomic analysis of a neurodegeneration cell model, treated with plant extracts with potential neuroprotective activity
12
Fruits extracts were prepared using ethanol 50 % (v/v) as previously described [59]. Briefly, to
each 1 g of lyophilized powder, 12 mL of ethanol 50 % (v/v) were added and the mixture shaken for 30 min at room temperature in the dark. The extracts obtained were dried under
vacuum.
3.4. In vitro digestion
Phytochemical alterations during digestion were mimicked using the in vitro digestion model
(IVD) already described by McDougall et al. [15, 60] performed in collaboration with Gordon
McDougall and Derek Stewart from The James Hutton Institute, Dundee, Scotland (former
Scottish Crop Research Institute). Briefly, the extracts were submitted to conditions that mimic gastric digestion such as adjusted pH to 1.7, addition of pepsin and incubation at 37 ºC with shaking at 100 rpm for 2 h. Small intestine conditions were mimicked by addition of pancreatic
and bile salts, followed by dialysis with a cellulose tube containing NaHCO3 to neutralize
titratable acidity. After 2 h of incubation at 37 ºC, the solution inside de dialysis tubing that mimic the SAF was collected and dried under vacuum.
3.5. Cell Culture
Human neuroblastoma SK-N-MC cells were obtained from the European Collection of Cell
Cultures (ECACC) and cultured in EMEM supplemented with 2 mM L-glutamine, 10 % FBS, 1
% (v/v) non-essential aminoacids, 5000 U mL-1 of penicillin and 5000 µg mL-1 (w/v) of
streptomycin. The cells were maintained at 37 ºC in 5 % CO2 and split at sub confluence of
90-100 %, using 0.05 % trypsin/EDTA. Treatments with digested extracts or with (H2O2) were
carried out in medium with 0.5 % (v/v) FBS. Periods of incubation varied according with the purpose of the experiment.
3.6. Time course profile of cells incubated with hydrogen peroxide
To evaluate a time-dependent response to oxidative stress induction, SK-N-MC cells were
incubated with H2O2 for different periods (0-24 h). For that purposes, cells were seeded in
T-flasks of 25 cm2 (1.4 x 10⁵ cells mL-1). After 24 h, growth medium was removed and cells
washed with PBS. Cells were pre-incubated with medium containing 0.5 % (v/v) FBS, and 24 h
later, H2O2 at a final concentration of 300 μM was applied with new fresh medium to the T
-flask [15].
After incubations periods of 0 h, 1 h, 2 h, 4 h, 6 h, 8 h, and 24 h, cells were collected with
Proteomic analysis of a neurodegeneration cell model, treated with plant extracts with potential neuroprotective activity
13
3.7. Incubation of cells with digested plant extracts
SK-N-MC neuroblastoma cells were incubated for 24 h with digested berries extracts of
commercial blackberry (BB) and R. vagabundus (RV). Cells were seeded in T-flasks with 25
cm2 (1.4 x 10⁵ cells mL-1) and 24 h after seeding, growth medium was removed and cells washed
with PBS. Cells were incubated with non-toxic concentration of digested blackberry
metabolites: 0.5 μg GAE mL-1
for, ressuspended in medium containing 0.5 % (v/v) FBS [23]. After 24 h of incubation cells were collected with trypsin.
3.8. Protein Quantification
Protein quantification was made using modified Lowry’s method as reported by Bensadoun and
Weinstein [61]. The original method has been modified so that protein can be assayed in the presence of interfering chemicals such as Tris or ammonium sulphate. The absorbance of the
samples was measured at 750 nm [61, 62].
3.9. Electrophoresis
3.9.1.1D Electrophoresis
Protein extraction from SK-N-MC samples was performed according to Barata with slightly adjustments [63]. Briefly, protein extracts for detection of protein carbonyls were obtained
using a fresh lysis buffer containing 25 mM Tris-HCl at pH 8.0, 1 % (v/v) Triton X-100, 45 % (v/v) ethyleneglycol, 16 mM NEM, 18 mM sodium metabissulfide, 5 mM phenantroline, 1 mg
mL-1 DNase I, 1 % (v/v) cocktail inhibitor proteases III] and 50 mM DTT, whereas protein
extracts for detection of glutathionylated proteins were obtained with the same lysis buffer but
without DTT. After this, samples were centrifuged at 13,400 g during 10 min at 4 ºC and
supernatants were collected.
For protein carbonyls detection OxyBlot™ Protein Oxidation Detection kit (Millipore, Billerica,
USA) was used. Briefly, the supernatant obtained was immediately used for the derivatization
of the carbonyl groups by DNPH. The reaction was stopped by the addition of the neutralization solution from kit, and samples were stored at 4 ºC until further use.
For glutathionylated protein, supernatants were collected after centrifugation (13,400 g) and
stored with Sample Buffer [1 M (w/v) Tris-HCl, pH 6.8; 1 % (w/v) m-cresol purple and 10%
(v/v) glycerol] at -20 ºC until further use.
Fifteen micrograms of protein were subjected to SDS-PAGE in 10 % (w/v) acrylamide gels with 1 mm thick at 200 V during 1 h. The electrophoresis buffer used was composed by 25 mM
(w/v) Tris base, 192 mM (w/v) glycine and 0.1 % (w/v) SDS [64]. Protein standards were run
Proteomic analysis of a neurodegeneration cell model, treated with plant extracts with potential neuroprotective activity
14
3.9.2. 2D Electrophoresis
Protein extraction from SK-N-MC samples was performed according to Esteves, S. [65].
Briefly, cells were tripsinizated and centrifuged at 200 g during 10 min. The cells were washed
with PBS, and centrifuged at 200 g during 10 min. Then the supernatant was discarded and a
ressuspension buffer [60 mM DTT, 7 M Urea, 2 M Thiourea, 4 % (w/v) CHAPS, 0.4 % (v/v)
Triton X-100, 2 % (v/v) IPG Buffer (1:2, 3-10NL:4-7L), 1 mg mL-1 DNase, 1 % (v/v) cocktail
inhibitor proteases III] was added to the cells. Protein samples were collected after
centrifugation at 13,400 g during 10 min and stored at -20 ºC until further use.
For isoelectric focusing electrophoresis (IEF), the IPGphor system was used (Amersham
Biosciences, Uppsala, Sweden) with a non-linear gradient gel of pH 3-10, 13 cm (IPGstips, GE Healthcare, Uppsala, Sweden).
The samples, containing 65 μg of protein were centrifuged at 13,400 g at room temperature during 5 min, and the supernatant was applied to the Strip Holder. The IEF was carried out at
30 V for 12 h, followed by 250 V for 1 h, 500 V for 1.5 h, 1000 V for 1.5 h, 2500 V for 1.5 h, 8000 V for 1 h gradient and 8000 V for 4 h at 20 ºC. In the end of the IEF the strips were stored
at -20 oC until second dimension separation was performed [65].
Prior to SDS-PAGE the IPGstrips were equilibrated twice for 15 min in a buffer solution containing 50 mM Tris-HCl (pH 6.8), 6 M urea, 1 % (w/v) SDS, and 30 % (v/v) glycerol. DTT
in a concentration of 0.06 (w/v) mM was added to the first equilibration step and 0.135 mM (w/v) iodoacetamide to the second one. The samples were subjected to SDS-PAGE in 12.5%
(v/v) acrylamide gels with 1 mm thick. The electrophoresis buffer used was composed by 25 mM Tris base (w/v), 192 mM (w/v) glycine, 0.1 % (w/v) SDS [64]. Protein standards were run
along with the sample using 15 mA per gel for 15 min and then 30 mA per gel for 3 h.
3.9.3. Gel Staining
3.9.3.1. Commassie Brilliant Blue
This staining was done according to Neuhoff et al.[66]. After second dimension, the gels were
fixed in a solution containing 2 % (v/v) of phosphoric acid and 50 % (v/v) of methanol during 2 h, followed by 3 wash steps with bidestilled of 20 min each. Then the gels were incubated in 34
% (v/v) methanol, 17 % (w/v) ammonium sulphate and 2 % (v/v) of phosphoric acid during 1 h. After this period, a solution containing 1.1 % (w/v) Commassie Brilliant Blue G and 34 % (v/v)
Proteomic analysis of a neurodegeneration cell model, treated with plant extracts with potential neuroprotective activity
15
3.9.4. 2DE Gel analysis
Commassie Brilliant Blue stained gels were used for image analysis.
Gel images were analysed in Progenesis SameSpots software (Nonlinear Dynamics, Newcastle,
United Kingdom) for spot detection, measurement and matching.
The first step in the analysis of Progenesis SameSpots software was image control. Images went
through a process of image quality assessment for accurate image analysis.
Second, an appropriate reference image was selected to align the images to and then the areas of
the gel to be excluded from the analysis were defined. Once made the detection of spots they were edited, validated and reviewed.
One of the crucial steps in this analysis is spot volume normalisation: the intensity of each spot in a gel is expressed as a proportion of the total protein intensity detected in the entire gel [67, 68].
Individual spots with irregularities (i.e. ink spikes) were rejected and a protein spot was kept for
further analysis and declared reliable if at least n-1 normalized volume values were available in
each condition.
3.10. Mass spectrometry analysis
After protein spots excision from the 2DE gels, the protein spots were submitted to a digestion
with trypsin. After this, the trypsin digested proteins were analyzed by matrix-assisted laser desorption/ionization/time-of-flight (MALDI-TOF/TOF) performed in collaboration with
Proteomics Unit by the INIBIC- University Hospital Complex of Coruña.
Briefly, protein spots were diced in small pieces and in-gel digested following standard
procedures [69]. The samples were desiccated with acetonitrile, reduced with DTT, alkylated
with iodoacetamide and trypsin-digested (6 ng µL-1, Roche (Basel, Switzerland)) for 16 h at
37 oC. Peptides were then extracted, dried in a speed-vac reconstituted in 0.1 % trifluoroacetic
acid and de-salted using nu-tipC18 (Glygen).
The samples were analyzed in a MALDI-TOF/TOF instrument (4800 ABSciex) and 4000 series
Explorer v.4.2 software was used to generate the spectra and peak list. MS adquisitions were done with a laser voltage of 3800 kV and 1500 shots/spectrum. Automated precursor selection
was done using an interpretation method (up to 20 precursors/fraction, Signal to Noise lower threshold = 50) with a laser voltage of 4800 and 1500 shots/spectrum. Collision-induced
dissociation (CID) collision energy range: medium.
Fragmentation spectra were acquired by selecting the 20 most abundant ions of each
Proteomic analysis of a neurodegeneration cell model, treated with plant extracts with potential neuroprotective activity
16
averaging 2000 laser shots per fragmentation spectrum. The parameters used to analyze the data
were a signal-to-noise threshold of 20, minimum area of 100 and a resolution higher than 10, 000 with a mass accuracy of 20 ppm. For database queries and protein identification, the
monoisotopic peptide mass fingerprinting data obtained from MS and the amino acid sequence tag obtained from each peptide fragmentation in MS/MS analyses were used to search for
protein candidates using Mascot v.1.9 from Matrix Science (www.matrixscience.com). Peak intensity was used to select up to 50 peaks per spot for peptide mass fingerprinting and 50 peaks
per precursor for MS/MS identification. Tryptic autolytic fragment-, keratin-, and matrix-derived peaks were removed from the data set utilized for database search. The search for
peptides mass fingerprints and tandem MS spectra were performed in NCBInr database (August 2012). Fixed and variable modifications were considered (Cys as S-carbamidomethyl and Met as oxidized methionine, respectively), allowing one trypsin missed cleavage. MS/MS ions
search were conducted with a mass tolerance of 50 ppm on the parent and 0.3 Da on fragments.
Decoy search was done automatically by Mascot on randomized database of equal composition and size. Mascot scores for all protein identifications were higher than the accepted threshold
for significance (at the p < 0.050 level, positive rate measured to be 0.047).
3.11. Western Blot
3.11.1. Electrotransfer of polypeptides
The electrotransfer of polypeptides was done according to Swerdlow et al. [70]. After
SDS-PAGE, gels were incubated in electrotransfer buffer containing 25 mM (w/v) Tris base, 19 mM (w/v) glycine, 0.1 % (w/v) SDS and 20 % (v/v) of methanol at pH 8.3 during 15 min. PVDF
membranes (Amersham Biosciences, Uppsala, Sweden) were incubated in methanol followed by incubation in electrotransfer buffer. The gel and the membrane were assembled in the
transfer cell (Trans-Blot electrophoretic transfer cell, BioRad, Amadora, Portugal) containing transfer buffer. Transfer was carried out at 70 V for 1.5 h for gels with 1 mm thick at 4 ºC.
3.11.2. Ponceau S Staining
Ponceau S staining solution [0.2 % (w/v) Ponceau S, 3 % (w/v) trichloroacetic acid, 3 % (w/v)
sulfosalicylic acid] was used for the detection of proteins on PVDF membranes.
After electrophoresis, the blotted membrane was immersing in Ponceau S staining solution
Proteomic analysis of a neurodegeneration cell model, treated with plant extracts with potential neuroprotective activity
17
3.11.3. Immunodetection
OxyBlot™ Protein Oxidation Detection kit (Millipore, Billerica, USA) was used according to
the manufacturer’s instructions for the detection of carbonylated proteins, and the detection of
glutathionylated proteins was done according to Newman et al. [54] with slightly adjustments.
After protein transfer or Ponceau S staining, membranes were dried at room temperature and
blocked with 5 % (w/v) membrane blocking agent (MBA-GE Healthcare, Uppsala, Sweden) in
PBS containing 0.01 % (w/v) sodium azide and 0.1 % (v/v) Tween 20® (PBS-Tween) overnight
at 4 oC or 1 h at room temperature.
The membranes were incubated with primary antibody in blocking/dilution buffer for 2 h, which was verified to develop better signal than one hour of incubation, with gentle stirring at
room temperature. The membranes were then washed twice for 5 min with PBS-Tween and once for 15 min with PBS-Tween followed by incubation with secondary antibody in
blocking/dilution buffer for 1 h at room temperature. The conditions for each antibody are described in Table 3.1. Antibody detection was performed with the chemiluminescent substrate
(FemtoMax Super Sensitive Chemiluminescent HRP Substrate; Rockland Inc., Gilbertsville, USA). Membrane images were acquired in the Molecular Imager ChemiDoc XRS (Quantity
One© software v. 4.6.6; BioRad, Amadora, Portugal).
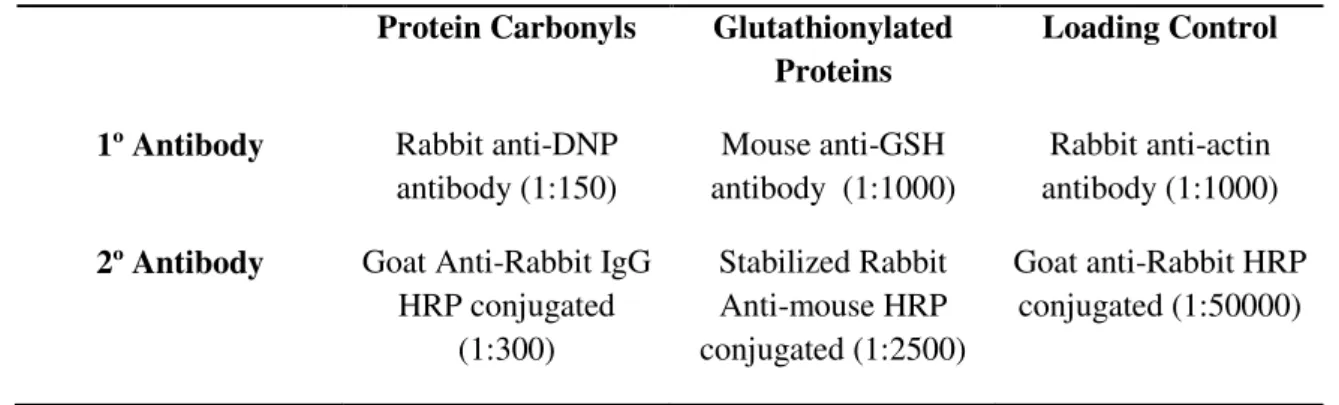
Table 3.1 -Antibodies and dilutions used in Western blot analyses.
Protein Carbonyls Glutathionylated Proteins
Loading Control
1º Antibody Rabbit anti-DNP antibody (1:150)
Mouse anti-GSH antibody (1:1000)
Rabbit anti-actin antibody (1:1000)
2º Antibody Goat Anti-Rabbit IgG HRP conjugated
(1:300)
Stabilized Rabbit Anti-mouse HRP conjugated (1:2500)
Goat anti-Rabbit HRP conjugated (1:50000)
3.12. Measurement of glutathione released from glutathionylated proteins
This method was performed in collaboration with Dr Inês Figueira from DSB Lab.
To quantify GSH and GSSG, cold 10 % (w/v) metaphosphoric acid was carefully added to
samples or standards. After incubation (4 ºC, 10 min) and centrifugation (16,000 g, 20 min,
Proteomic analysis of a neurodegeneration cell model, treated with plant extracts with potential neuroprotective activity
18
The procedure for the reduction of proteins by sodium borohydride was performed according to
Hiil, et al. [57]. The pellet (PSSG – Protein S-glutathionylated) was washed 4 times with cold
10 % (w/v) metaphosphoric acid, sonicated and then samples were centrifuged (1,000 g, 5 min,
4 ºC). After this 0.25% (w/v) sodium borohydride in 10 mM (w/v) Tris-HCl, pH 7.5, was added to the samples (45 min at 41 ºC). The next step was acidification of the samples by adding cold
10 % (w/v) metaphosphoric acid. After incubation (4 ºC, 10 min) and centrifugation (16,000 g,
20 min, 4 ºC), supernatants were collected (50 μL for determination of GSH and 200 μL for
determination of GSSG).
Derivatization was performed accordingly to Kand’ar and co-workers [71], that was adapted from Hissin and Hilf [72]. Briefly, for GSH analysis 1 mL of 0.1 % (w/v) EDTA in 0.1 M
sodium hydrogen phosphate, at pH 8.0, was added to 50 μL of supernatant. To 20 μL portion of
this mixture, 300 μL of 0.1 % (w/v) EDTA in 0.1 M PBS, at pH 8.0, and 20 μL of 0.1 % (w/v) OPA in methanol, were added. Tubes were incubated at 25 ºC for 15 min in the dark. The
reaction mixture was then stored at 4 ºC until analysis.
For GSSG analysis, 200 μL of supernatant was incubated at 25 ºC with 200 μL of 40 mM
NEM for 25 min in dark. To this mixture, 750 μL of 0.1 M NaOH was added. A 20 μL portion
was taken and mixed with 300 μL of 0.1 M NaOH and 20 μL of 0.1 % OPA. Tubes were
incubated at 25 ºC for 15 min in dark and stored at 4 ºC until analysis. Chromatographic
analysis was accomplished using isocratic elution on C18 analytical column (SupelcosilTM
ABZ+Plus HPLC Column 15 cm x 4.6 mm, 3 μm (Supelco)) at 40 ºC on an AcquityTM Ultra Performance LC system (Waters). The mobile phase consisted of 15 % (v/v) methanol in 25
mM (v/v) PBS at pH 6.0. The flow rate was kept constant at 0.7 mL min-1. The excitation and
emission wavelengths were set at 350 and 420 nm, respectively. The amount of GSH and GSSG was quantified from the corresponding peak area using Empower® Pro 2.0 software. The
concentration of GSH and GSSG in the samples was determined from standard curves with
ranges 0-100 μM for GSH and 0-5 μM for GSSG. Values were normalized for total protein
content.
3.13. Statistical Analysis
A complete data matrix of protein spot normalized volumes was generated by replacing the missing values in a condition by the mean of existing values for that protein spot [73]. The
protein spots were statistically evaluated by ANOVA-Tukay HSD (Analysis of
variance-Honest Significant Difference) test when normality test passed, however, when normality test
Proteomic analysis of a neurodegeneration cell model, treated with plant extracts with potential neuroprotective activity
19
For all the statistical analysis performed the SigmaStat v.3.10 software (Systat software Inc,
Proteomic analysis of a neurodegeneration cell model, treated with plant extracts with potential neuroprotective activity
Proteomic analysis of a neurodegeneration cell model, treated with plant extracts with potential neuroprotective activity
21
4. Results and Discussion
4.1. Evaluation of Oxidative Stress
To mimic pathological situations with increased oxidative stress, peroxides are often used to
implement cell models [74]. To reproduce a neurodegeneration cell model, 300 µM H2O2 was
used to induce oxidative stress in SK-N-MC neuroblastoma cells, a concentration of H2O2 that
reduces cells viability to approximately 50 % after 24 h of incubation [15].
4.1.1.Time course profile of protein extracts from SK-N-MC cells treated with hydrogen
peroxide
To detect the proteins altered during oxidative stress in neuronal cells, the cells were treated
with 300 µM of H2O2 for 1 h, 2 h, 4 h, 6 h, 8 h and 24 h. After protein extraction, the proteins
were separated using 2DE technique. The separated proteins were visualized with CBB and
analyzed with Progenesis SameSpots software.
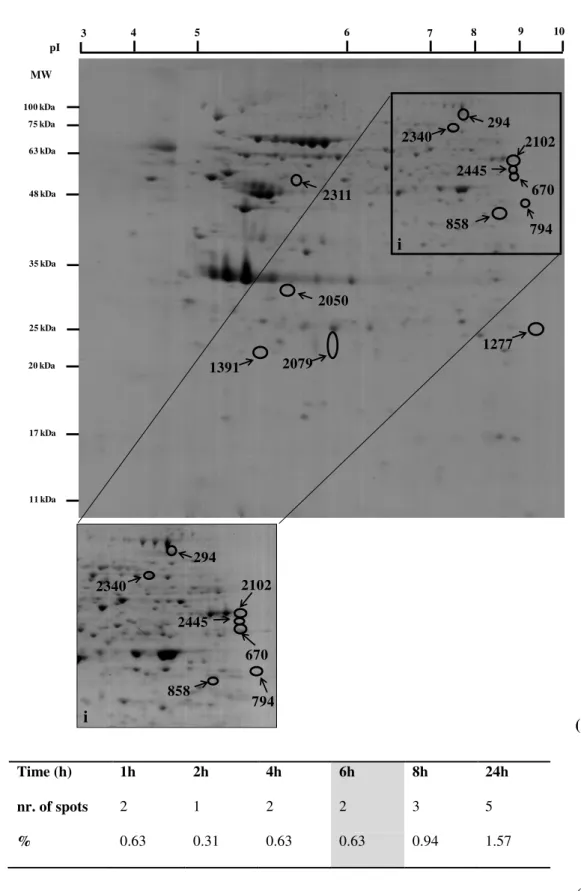
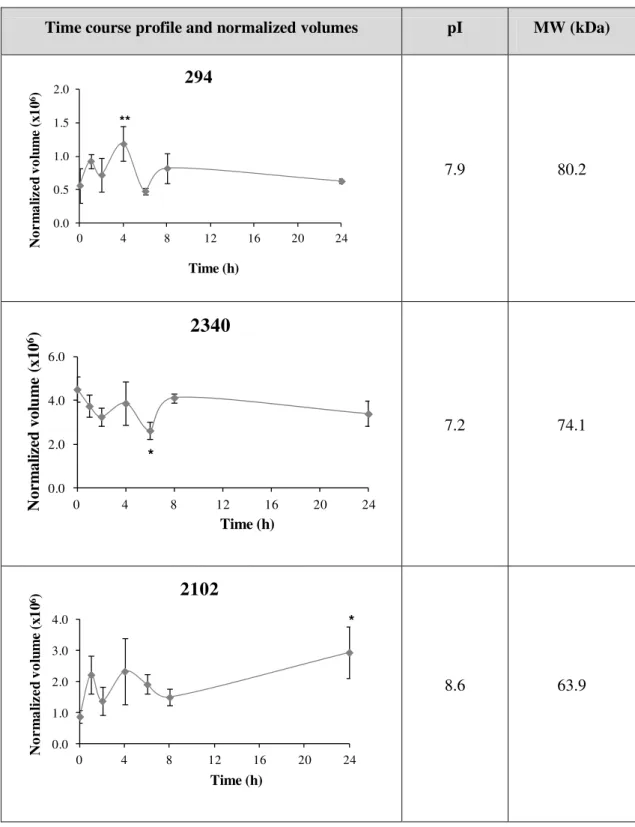
After statistical analysis, 318 protein spots were pinpointed, from which 12 were statistical different from the control which corresponds to 3,77 % of the total protein spots (Fig. 4.1 (A)).
For 1 h, 2 h, 4 h, 8 h and 24 h of stress injury the protein spots altered were upregulated, however, after 6 h of stress the protein spots were downregulated relatively to control (Fig. 4.1
(B)); the time course profile for each protein spot as well as the estimated pI and MW (kDa) are described in Table 4.1.
Exposure of cells to H2O2 for 24 h caused more alterations in the protein pattern than in the
remaining treatments, while 2 h of incubation with H2O2 had less effect on protein pattern.
These results showed that longer exposure times to H2O2 lead to more changes in the pattern of
the proteins (Fig. 4.1 (B)).
Proteomic analysis of a neurodegeneration cell model, treated with plant extracts with potential neuroprotective activity
22
(A)
(B)
Fig. 4.1 -(A) Representative 2DE control gel of SK-N-MC cells (65 µg).The gel was CBB stained. Twelve spots were found to change quantitatively between the control and stress conditions evaluated (0-24 h), and numbered spots have been sent for protein identification by MS; (i) Zoom in of some protein spots of 2DE gel with high contrast; (B)
Comparison of protein spots differentially expressed against control, white columns for upregulated proteins and gray column for downregulated protein spots.
100 kDa
25 kDa 48 kDa
35 kDa 63 kDa 75 kDa
2050
2079 1391
2311
1277 294
2340 2102
670 2445
858 794
3 4 5 6 7 8 9 10
pI
MW
20 kDa
17 kDa
11 kDa
i
294
2340 2102
2445
670 794 858
i
Time (h) 1h 2h 4h 6h 8h 24h
nr. of spots 2 1 2 2 3 5
Proteomic analysis of a neurodegeneration cell model, treated with plant extracts with potential neuroprotective activity
23
Table 4.1 - Time course profile for the expression of protein spots differentially expressed in SK-N-MC cells tretated with 300 µM H2O2 and their characteristics (pI and MW (kDa)). Differences between treatments in relation to control
are denoted as *p<0.05 **p<0.01, ***p<0.001.
Time course profile and normalized volumes pI MW (kDa)
7.9 80.2
7.2 74.1
8.6 63.9
0.0 0.5 1.0 1.5 2.0
0 4 8 12 16 20 24
N o r m a li z e d v o lu m e (x 1 0 6) Time (h) 294 ** 0.0 2.0 4.0 6.0
0 4 8 12 16 20 24
N or m al iz ed vo lu m e (x10 6) Time (h)
2340
* 0.0 1.0 2.0 3.0 4.00 4 8 12 16 20 24
Proteomic analysis of a neurodegeneration cell model, treated with plant extracts with potential neuroprotective activity
24
Time course profile and normalized volumes pI MW (kDa)
8.6 60.5
5.6 57.9
8.6 57.7
0.0 10.0 20.0 30.0 40.0
0 4 8 12 16 20 24
N or m al iz ed vol u m e (x10 6) Time (h)
2445
* 0.0 1.0 2.0 3.0 4.00 4 8 12 16 20 24
N o r m a li z e d v o lu m e (x 1 0 6) Time (h)
2311
*** 0.0 1.0 2.0 3.0 4.00 4 8 12 16 20 24
Proteomic analysis of a neurodegeneration cell model, treated with plant extracts with potential neuroprotective activity
25
Time course profile and normalized volumes pI MW (kDa)
9.2 49.7
8.2 47.0
5.7 32.0
0.0 1.0 2.0 3.0 4.0
0 4 8 12 16 20 24
N or m al iz ed vol u m e (x10 6) Time (h)
794
* 0.0 1.0 2.0 3.0 4.00 4 8 12 16 20 24
N or m al iz ed vo lu m e (x10 6) Time (h)
858
*** 0.0 10.0 20.0 30.0 40.00 4 8 12 16 20 24
Proteomic analysis of a neurodegeneration cell model, treated with plant extracts with potential neuroprotective activity
26
Time course profile and normalized volumes pI MW (kDa)
9.5 26.1
5.9 24.2
5.4 23.5
Taking into account what is already known about the induction of stress in this cell model (50%
reduction in cell viability, changing on free GSH levels and caspases activity) it would be expectable that the percentage of protein spots that are different expressed from control would
be higher than the obtained [23]. However, these facts could indicate that protein changes do not occur in the most abundant proteins, those which can be detect on global proteome analysis, but
most likely occur in the less abundant proteins, specific sub proteomes or specific proteins.
0.0 1.0 2.0 3.0 4.0 5.0 6.0
0 4 8 12 16 20 24
N or m al iz ed vol u m e (x10 6) Time (h)
1277
** 0.0 10.0 20.0 30.0 40.00 4 8 12 16 20 24
N or m al iz ed vo lu m e (x10 6) Time (h)
2079
* 0.0 1.0 2.0 3.0 4.00 4 8 12 16 20 24
Proteomic analysis of a neurodegeneration cell model, treated with plant extracts with potential neuroprotective activity
27
The 2DE technique exhibit a great potential to resolve thousands of proteins simultaneously,
providing important clues even for PTM’s that involve changes in protein total charge, but has
several limitations like the inability to detect low-abundance proteins, this become a limiting
step because these proteins can be hampered by protein with similar size and charge or by expression levels below the current detection limits of the technique used [4, 36, 38]. Current
available proteomic approaches are estimated to focus on 30 % most abundant proteins such as cytoskeleton proteins that tend to interfere with proteomic analysis by masking proteins with
lower copy numbers. An advantage of selecting protein populations for proteomic analysis is that it substantially decreases the complexity of extracts and thus increases the likelihood of
identifying proteins with lower abundance [36].
It becomes clear that could be interesting to fractionate our sample; this allows to reduce the complexity of protein/peptide mixtures and to separate various groups of proteins for
subsequent analysis [75].
Proteome analysis was the first approach but since oxidative reactions are the main features during neurodegeneration we looked more specifically for redox proteomics alterations, focusing in some redox alterations in particular some chemical groups in the proteins, such as
protein carbonyls and protein glutathionylation.
4.1.2.Protein Carbonyls
The determination of carbonyl groups has been widely employed as a parameter of protein oxidation to characterize tissue alterations occurring in neurodegenerative diseases [76].
Protein carbonyls can be easily detected by forming a hydrazone derivative with DNPH. This product can then be detected by various methods such as spectophotometric assay,
enzyme-linked immunoabsorbent assay (ELISA), and 1DE or 2DE followed by Western blot immunoassay [50, 77].
The detection of oxidatievely modified proteins by immunoblotting has advantages over the methods listed above: i) the sensitivity of the method is at least 100 times greater than those
obtained by other procedures; ii) individual oxidized proteins can be separated and identified from a complex mixture by 1DE/2DE; and the oxidative status of each polypeptide can be
analyzed quantitatively by comparison of the signal intensity of the same polypeptide in different lanes on the same gel. Based on this we decided to use this method to determine
carbonylated proteins.
In our work, SK-N-MC samples were tested by the immunodetection in membrane of the adduct
protein-hydrazone after resolve in SDS-PAGE, by using the OxyBlot™ Protein Oxidation