Article
, Vol. 30, No. 2, 342-349, 2019 Printed in Brazil - ©2019 Sociedade Brasileira de Química
*e-mail: tubino@iqm.unicamp.br
Biodiesel Synthesis: Influence of Alkaline Catalysts in Methanol-Oil Dispersion
JoséG.RochaJr., aAndrezaD.M.Mendonça,aDanielA.R.deCampos,a
RenilsonO.Mapele,bCristinaM.Barra,aGlaucoF.Bauerfeldtaand
MatthieuTubino *,c
aInstituto de Química, Universidade Federal Rural do Rio de Janeiro, BR-465, km 7, 23897-000 Seropédica-RJ, Brazil
bDepartamento de Engenharia Química, Universidade Federal Rural do Rio de Janeiro, BR-465, km 7, 23897-000 Seropédica-RJ, Brazil
cInstituto de Química, Universidade Estadual de Campinas, P.O. Box 6154, 13083-970 Campinas-SP, Brazil
Biodiesel synthesis from soybean oil using methanol and alkaline catalysts occurs in the following two consecutive steps: dispersion of methanol in the oil and methanolysis. The effect of the alkaline catalysts NaOCH3, KOCH3, NaOH, and KOH in the dispersion step at 30-60 °C and
under mechanical stirring at 400 rpm was evaluated. The dispersion step accounts for 44.6-73.3% of the total synthesis time and was poorly favored compared to methanolysis due to the increase in temperature. The catalysts decreased the dispersion time, although most of them increased the methanol-oil interfacial tension. K-containing catalysts were more active than their Na analogues due to higher adsorption of K+ in the methanol-oil interface and the higher production of methyl
esters (which act as emulsifying agents), which promote a more favorable interfacial tension. The alkaline cation effect was more significant in the dispersion step than in the methanolysis step.
Keywords: emulsification, methanolysis, refractometer, methyl esters, interfacial tension
Introduction
Due to the instability of the petroleum market, the limited availability of crude oil, and the environmental impact of fossil fuels, worldwide attention has been given to processes related to biodiesel synthesis and their applications. Biodiesel is a mixture of fatty acid mono-alkyl esters obtained from renewable raw materials, such as vegetable oil or microalgae oil and animal fats.1,2
The transesterification reaction of triglycerides with methanol (methanolysis) and alkaline catalysts, such
as NaOH, NaOCH3, KOH, and KOCH3, is commonly
used in biodiesel production,2,3 producing methyl esters
(biodiesel) and glycerol. Alkaline catalysts are most often used in methanolysis because of their relatively low cost and capability of promoting high conversion in a few minutes under moderate conditions.4 The activity of these
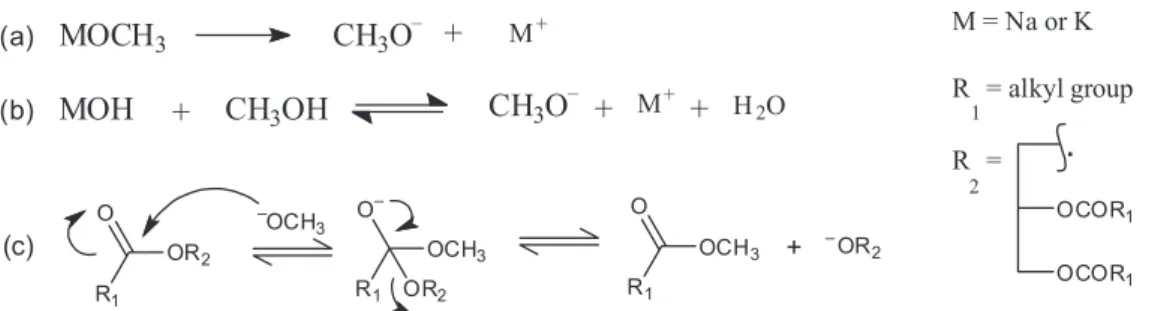
catalysts is due to the formation of methoxide ion from the dissociation of the corresponding alkaline methoxide in
methanolic solution (Figure 1a) or from reaction of alkaline hydroxide with methanol (Figure 1b). The methoxide ion then reacts with the carbonyl groups of the triglycerides to form methyl esters (Figure 1c).4
To ensure appropriate mass transfer between the triglyceride and methanol phases, as well as to reduce the time required, biodiesel synthesis must be conducted under vigorous stirring because of the low miscibility of the reactants.5-7 The miscibility
of oils with higher chain alcohols, such as ethanol, isopropanol, butanol and tert-butanol is relatively higher. However, these alcohols make it difficult to separate the glycerol.8
Methanol is frequently used in a higher molar proportion compared to the triglyceride (6:1 or 9:1),3 but its
volume is lower than that of the triglyceride in the reaction media. Therefore, methanol is dispersed (such as droplets) in the triglyceride phase during stirring of the reaction mixture.7,9 The formation of these droplets was observed
in raw materials from different sources, such as canola, peanut, soybean and sunflower oil.8
Biodiesel Synthesis: Influence of Alkaline Catalysts in Methanol-Oil Dispersion
JoséG.RochaJr., aAndrezaD.M.Mendonça,aDanielA.R.deCampos,a
RenilsonO.Mapele,bCristinaM.Barra,aGlaucoF.Bauerfeldtaand
Different reaction orders have been attributed to the methanolysis reaction law. Recently, zero-order kinetics has been proposed due to the heterogeneity of the system and the good correlation with experimental data. It was then proposed that the reaction occurs at the methanol-oil interface.10
Tubino et al.9 designed an experimental system that
allowed for online monitoring in continuous flow during biodiesel synthesis and used refractive index measurements. This experimental system was able to show that biodiesel synthesis occurs in two steps when promoted by methanol and the alkaline catalyst KOCH3 and under mechanical
stirring at 400 rpm at 30.0, 40.0, 50.0, and 60.0 °C. Initially, variation in the refractive index over time occurred due to dispersion of the methanol in the oil (first step), and then it was due to methanolysis (second step), indicating the existence of an induction period that either precedes the reaction or causes the reaction to occur very slowly. This induction period has been previously reported,11,12 but the
dispersion step was not monitored because the analytical methods employed at that time were not suitable for this observation.
A reaction mechanism consisting of a mass transfer-controlled initial step followed by a kinetically transfer-controlled step was proposed by Noureddini and Zhu,13 when they
investigated the kinetics of soybean oil methanolysis with NaOH. These authors observed that mass transfer region was reduced from 55 to about 20 min as temperature was increased from 30 to 60 °C, at a Reynolds number of 3100. At higher mixing intensities, the mass transfer region was short and this effect was not significant.
Although some previous studies have evaluated the efficiency of NaOH, NaOCH3, KOH and KOCH3 in kinetics
of methanolysis, they compare the activities of them using the same weights of different catalyst (therefore, different molar quantities) and same initial raw material weights. A systematic comparison of the efficiency of the catalysts NaOH, NaOCH3, KOH, and KOCH3 in biodiesel synthesis
clearly showed that the alkaline metal influences the rate of methanolysis under the same methanol:triglyceride:catalyst
molar ratio conditions.14 The potassium catalysts were
more effective than their Na analogues, and such behavior appeared to be related to the greater stability of the Na+-OCH
3 ion pair in comparison to K+-OCH3, a fact
which makes the activation energy of the sodium catalysts relatively higher.
Although the influence of alkaline catalysts on the methanolysis step has been previously studied, to the best of our knowledge the influence of the nature of the catalyst on the dispersion step has not yet been investigated. Thus, the goal of this work was to investigate the influence of the alkaline catalysts NaOH, NaOCH3, KOH, and KOCH3 in the
dispersion step by monitoring refractive index measurements over time and the influence of this step in the overall biodiesel synthesis process. Methanol-oil dispersion with alkali metal salts (CH3CO2Na and CH3CO2K) was monitored,
and interfacial tension measurements were performed to determine the effect of the Na+ and K+ ions from the catalysts.
Experimental
Materials
In this study, commercial refined soybean oil was used. Oil from the same batch were used to ensure an approximately constant composition to avoid that other parameters, such as water and free fatty acids contents, could influence the study of the catalysts. NaOH (99.8%, Synth, Brazil), KOH (85%, Vetec, Brazil), KOCH3 (25%
in methanol, Sigma-Aldrich, Brazil), NaOCH3 (30%
in methanol, Vetec, Brazil), CH3CO2Na (> 99%, Vetec,
Brazil), CH3CO2K (> 99%, Vetec, Brazil), and methanol
(99.8%, Synth, Brazil) were used as received.
Monitoring biodiesel synthesis
with a double helix (10 mm). The oil was pumped with a peristaltic pump (Ismatec mp13 GJ4) to the monitoring system at a volumetric flow rate of 1 mL min-1 (pumping
tubes: Tygon® 2-Bridge (Red-Red) PVC Solva tubing®
1.14 mm internal diameter; conducting tubes: polyethylene 1.0 mm internal diameter). Methanolic solutions of 0.41 mol L-1 catalysts were prepared by dissolution of
15.7 mmol of catalyst (0.42% m/m, in terms of NaOH) in 30.0 g of methanol (methanol/oil molar ratio of 6:1) and, after, immersed in the thermostatic bath. After thermal equilibrium was achieved, the catalyst-methanol mixture was rapidly added to the round-bottomed flask containing vegetable oil, and the chronometer was immediately triggered.
As proposed by Tubino et al.,9 the monitoring system
used two homemade phase separators, a liquid-liquid separator (SL-L), to remove glycerol from the oil/biodiesel
phase, and a gas-liquid separator (SG-L), to remove air
bubbles formed in the system.
During biodiesel synthesis, the reaction mixture under stirring (triglyceride + methanol + catalyst + biodiesel + glycerol) was continually pumped from the round-bottomed flask to the phase separators (Figure 2), where the glycerol and bubbles of air were removed and pumped to the reaction flask. The isolated triglyceride + biodiesel phase was pumped to a digital refractometer (Mettler, model Refracto® 30GS, precision: ± 0.0005) for determination of the refractive index and then transferred back to the round-bottomed flask.
Air bubbles were not discharged from the system because a small fraction of the reaction mixture was always carried with them. So, it was necessary to return the bubbles (and glycerol) to the system to not change the composition of the reaction mixture. The reaction was processed in open system. So, the bubbles were undone upon returning to the reaction flask.
The methanol phase was partially dragged with the triglyceride + biodiesel phase and partially with the glycerol phase. The latter carried more methanol due to the similarity between its polarity and that of glycerol. The measurements were performed at 5 s intervals until equilibrium of the reaction was reached and when the refractive index reached a constant value. All experiments were performed in quadruplicate at 30.0, 40.0, 50.0, and 60.0 °C. The Grubbs test was employed for exclusion of anomalous data (at α = 0.05).
Monitoring emulsification of the methanol-oil mixture
A monitoring system similar to that depicted in Figure 2 was used to evaluate the effect of Na+ and K+ in the
dispersion of a methanol-oil mixture, but without the phase separators (SL-L and SG-L). The catalysts were not used to
avoid the formation of biodiesel. Instead, CH3CO2Na and
CH3CO2K were used as additives to provide the Na+ and
K+ ions, respectively. In this medium, the acetate ion was
a weak base, and after reacting with methanol it was not expected to yield an appreciable amount of methoxide ion, which would act as a catalyst.
Approximately 50.0 g of soybean oil and 3.33 mmol of the additive (previously dissolved in 10.0 g of methanol; equivalent to 0.26 mol of additive per liter of methanol) were used. The reaction and monitoring conditions used were the following: temperature of 40.0 °C, mechanical agitation at 300 rpm, and flow rate of 1 mL min-1. Refractive
index measurements were performed immediately after stirring began. For comparison purposes, monitoring of the emulsification of the methanol-oil mixture was also conducted without the additives. The experiments were performed in triplicate. The Grubbs test was employed for exclusion of anomalous date (at α = 0.05).
Methanol-oil interfacial tension
Methanol-oil interfacial tension measurements were performed using the drop volume method15 using Tate’s
law (equation 1):
(1)
where γ is the interfacial tension in mN m-1, ∆ρ is the
operating density difference (i.e., the difference between the densities of the fluid forming the drop and that surrounding the drop) in g mL-1, g is the gravitational acceleration
in m s-2, r is the tube radius in m, V is the volume of
the detached drop in mL, and φ(r/V1/3) is an empirically
Figure2. Monitoring system for biodiesel synthesis where P = peristaltic pump; SL-L = liquid-liquid phase separator; SG-L = gas-liquid phase
derived correction factor. φ(r/V1/3) is used because (i) the
drop does not totally leave the tip (as much as 40% may remain attached), (ii) the boundary tension forces are not generally vertical, and (iii) there is a pressure difference across the curved interface.13
The interfacial tensions between the soybean oil and the following solutions in methanol were determined: NaOH, KOH, KOCH3, and NaOCH3 with a concentration
of 0.41 mol L-1, and CH
3CO2Na and CH3CO2K with
a concentration of 0.26 mol L-1. These concentrations
were the same as the previously used for monitoring the dispersion step when using the catalyst and additive. The interfacial tension between the soybean oil and pure methanol was also determined.
Determination of the volume drop (V) was performed in triplicate. The recommendations of Lee et al.16 were
considered. For such, the tip of a burette filled with soybean oil was dipped in 30.0 mL of the solution in methanol. The drip was adjusted at regular intervals of 50 s. Approximately 30 drops of oil were collected in each solution and the droplet volume (V) was calculated. The density (ρ) was measured five times for each fluid, weighing a mass of 1.00 mL for each fluid. All experiments were conducted at 25.0 ± 0.5 °C.
The capillary geometry of the drip tip was thin-walled, where the droplets were formed in the outer diameter.16 The
external diameter of the tip of the burette (4.30 ± 0.02 mm) was measured with the aid of a pachometer. According to Harkins and Brown,17 the most accurate results for
φ(r/V1/3) would be obtained between 0.6 ≤ r/V1/3≤ 1.2.15,17
The r/V1/3 ratio obtained was between 0.69 ≤ r/V1/3≤ 1.02.
The values of φ(r/V1/3) were obtained by interpolation with
the tabulated values of φ(r/V1/3) and r/V1/3.13
Results and Discussion
Monitoring the dispersion process and methanolysis reaction
Refractive index is a good parameter for monitoring conversion versus time in the methanolysis reaction. Discrimination of the dispersion process of the different liquid phases and the reaction itself can also be determined. According to previous studies, it is possible to discriminate the end of the dispersion step from the beginning of methanolysis by observing the second abrupt variation in the refractive index of the reaction mixture over time.9,12
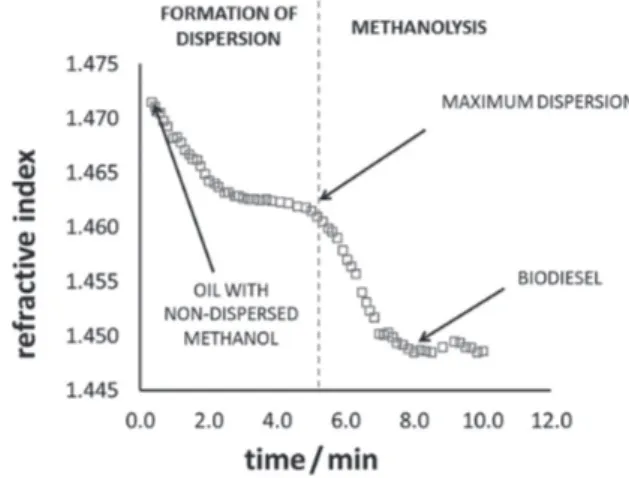
This behavior can be clearly noticed by plotting the variation of the refractive index of the mixture under agitation versus time, as depicted in Figure 3.
In the dispersion step, the refractive index values
varied from slightly above 1.4720 to approximately 1.4620 for quadruplicate experiments conducted at different temperatures (Figure 3). These values correlated quite well with those found for the soybean oil and the methanol-oil mixture without the presence of a catalyst.9 After the
methanolysis reaction, the refractive index decreased to 1.4450-1.4505, which is in agreement with that reported in the literature.18-20 This variability in the final refractive index
of the obtained biodiesel can be attributed to the different quantities of methanol (n = 1.3278) that can be dragged to the refractometer together with the final product.
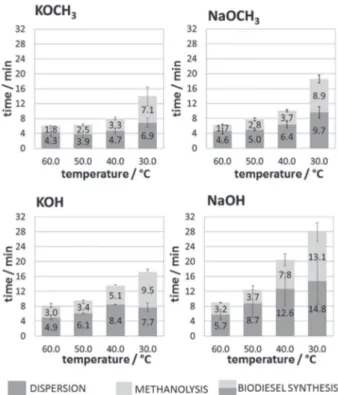
The intervals of time for the dispersion step (tD), the
methanolysis step (tM), and biodiesel synthesis (tS) (where
tS = tD + tM) (Figure 4) were determined from visual analysis
of the monitoring curves. The order of efficiency for each catalyst in both steps (dispersion and methanolysis) compared to all others can be assumed to be essentially the same (i.e., KOCH3 > NaOCH3 > KOH > NaOH). For the
methanolysis, this order is according with the previously reported,12,21 when the catalysts were compared in the same
molar ratio of catalyst/oil.
In order to understand the reasons causing the decrease in the refractive index for dispersion and methanolysis, the following must be considered: (i) in the dispersion stage, the refractive index varies mainly due to the formation of the methanol-oil emulsion; (ii) in the reaction stage, the produced methyl esters cause a decrease in the refractive index of the resultant mixtures, as they present relatively smaller refractive indexes than reactants; and (iii) since the methyl esters can act as emulsifying agents by decreasing the interfacial tension, they contribute to the stabilization of the methanol in the oil phase, leading to a decrease in the refractive index as explained above.
formed and the dispersion process will be faster when K is present in the synthesis. For the same reason, methoxides were more effective than hydroxides for the dispersion of methanol in oil because they produce methyl esters more rapidly in methanolysis.
In Figure 4, it can be easily noticed that the time required for the occurrence of the dispersion and
methanolysis steps with Na-containing catalysts is higher in comparison to their K analogues. Larger differences between Na and K catalysts were observed in the dispersion step in comparison to methanolysis; the tD values for the NaOCH3 catalyst varied from 1.07
(at 60.0 °C) to 1.40 (at 30.0 °C) times higher than tD values
for KOCH3, whereas for tM the variation was from 0.96
to 1.26. The tD values for NaOH varied from 1.16 (at
60.0 °C) to 1.92 (at 30.0 °C) times higher than tD values
for KOH, whereas for tM the values varied from 1.07 to
1.38. The greater influence of the cation in the dispersion step, relative to methanolysis, should be associated with the effect they exert at the methanol-oil interface, which will be discussed further below.
These results show that the effect of the alkaline metal cation in the dispersion step is more important than in the methanolysis step. This becomes more relevant when it is observed that the time required for the dispersion step covers most of the time required for biodiesel synthesis (Figure 5), reaching up to 73.3% of the total time (NaOCH3,
at 60.0 °C). Although, two exceptions can be observed (KOCH3 and KOH, at 30.0 °C), and the contribution of the
dispersion time is still high (49.2 and 44.6%, respectively). For catalysts with the same metal cation (KOCH3 and
KOH or NaOCH3 and NaOH), it was observed that the
hydroxides were more effective than the methoxides in both the dispersion and methanolysis steps (Figure 4). In Figure 4, it is noted that the effect of anion change was higher than the effect of cation change in the values oftD.
With KOH, the tD value varied from 1.13 (at 60.0 °C) to
1.80 (at 40.0 °C) times higher than with KOCH3, whereas
Figure4. Time spent in the dispersion step (tD), the methanolysis step
(tM), and biodiesel synthesis (tS) while using alkaline catalysts at 60.0,
50.0, 40.0, and 30.0 °C.
with NaOH relative to NaOCH3 this range was from 1.23
(at 60.0 °C) to 1.98 (at 40.0 °C).
In general, the decrease in temperature increased the time required for both steps, but the dispersion step was less affected by temperature variation than the methanolysis step (Figure 4). The tD value with KOCH3 increased 59% (from
4.3 to 6.9 min) when the temperature was lowered from 60.0 to 30.0 °C, whereas in methanolysis the tM value increased
306% (from 1.75 to 7 min). For NaOCH3, KOH, and NaOH,
these increases were 109, 56, and 158% for the tD value
and 433, 217, and 307% for the tM value, respectively. The
temperature decreased the interfacial tension and, thus, the time required for dispersion was progressively smaller with increasing temperature.
Although the increase in temperature favors the dispersion process, the gain achieved in this step is relatively smaller. Alkaline methanolysis is rarely done at temperatures above the boiling point of methanol (64.7 °C) because in such situations the conversion of triglycerides is reduced22 and the high temperature promotes
saponification.23 Therefore, ideally, biodiesel synthesis
should be promoted at low temperatures because the production of soaps, among other inconveniences, makes the removal of glycerol more time-consuming, promotes the drag of glycerol into the biodiesel phase, and reduces the yield of biodiesel. However, at low temperatures tM and tD
are prolonged (Figure 4). As the dispersion step consumes an important part of the overall time required for biodiesel synthesis (Figure 5), the increase in tM at low temperatures
could be at least partially compensated by using more efficient dispersion techniques for the reactant mixture.
Influence of K+ and Na+ ions in the dispersion step
The monitoring of dispersion of the methanol-oil mixture when CH3CO2K or CH3CO2Na salts were added
was poorly reproducible in comparison to monitoring without the presence of such salts (Figure 6). It must be emphasized that no catalyst was used in these experiments.
Nevertheless, a decrease in the refractive index to an approximately constant value when the dispersion was finished was observed. The average time for dispersion is shown in Table 1.
Table 1 demonstrates that the addition of salts raises the time required for dispersion of the reactants and the methanol-oil interfacial tension. Therefore, the presence of these ionic species in methanol makes formation of the dispersion more difficult since the methanol droplets will be more rigid and will hardly rupture due to the higher interfacial tension (γ). The increase in γ promoted by CH3CO2K and CH3CO2Na suggests that fewer ions are
found at the methanol-oil interface than in the methanol bulk (i.e., they are negatively adsorbed on interface).24 It is
well known that the interfacial tension of aqueous solutions/ air increases with the addition of inorganic salts or small organic salts. K salts provide lower γ values than the Na analogues, suggesting that a relatively higher amount of K (with respect to Na+) can be adsorbed on the interface.21
Similar behavior for K and Na salts could be expected for methanol-oil interfacial tension, and this was observed in the present work (Table 1).
The time for dispersion of the methanol-oil mixture and the γvalue with CH3CO2K were lower than with CH3CO2Na
(Table 1). The higher rate of dispersion provided by the K-containing catalysts in relation to their Na analogues (Figure 4) must be partly related to the lower interfacial tension in the presence of K in comparison to Na, and is Table 1. Average time ± standard deviation for emulsification of the methanol-oil mixture and interfacial tension ± standard deviation with and without the addition of CH3CO2K or CH3CO2Na salts
Additivea timeb / min Interfacial tension c /
(mN m-1)
None 4.1 ± 0.5 1.0 ± 0.1
CH3CO2K 4.51 ± 0.01 1.3 ± 0.2
CH3CO2Na 5.2 ± 0.4 1.7 ± 0.2
a0.26 mol L-1; b40.0 °C; c25.0 °C.
Figure6. Plot of refractive index versus time obtained by monitoring the dispersion of the methanol-oil mixture with and without the addition of CH3CO2K
not simply associated with the presence of methyl esters formed in this step.
The γ values obtained by the drop volume method for methanolic solutions of KOCH3, KOH, NaOCH3,
and NaOH (Figure 7) indicated that in relation to K, Na hinders the dispersion of methanol in the oil phase. The increase in the observed interfacial tension occurred in the following order: KOCH3 (0.65 ± 0.19 mN m-1) <
KOH (1.5 ± 0.3 mN m-1) < NaOCH
3 (1.9 ± 0.2 mN m-1) <
NaOH (2.5 ± 0.2 mN m-1).
The NaOH, KOH, and NaOCH3 catalysts increase
the methanol-oil interfacial tension, meaning that they are negatively adsorbed on the interface as CH3CO2K
and CH3CO2Na salts. The KOCH3 catalyst decreases the
interfacial tension, suggesting that more ions are found at the interface than in the bulk methanol (positively adsorbed). However, it is reasonable to consider that during the slow formation of the methanol droplet in the
γ value determination experiment, methanolysis can occur to some extent on the interface, decreasing the interfacial tension as a consequence of methyl ester production. For KOCH3, this decrease exceeds the small expected increase
in the interfacial tension when K is added (Table 1) because of the higher methanolysis rate. Consequently, the resultant effect is a lower γ value in this case than with pure methanol. Thus, dispersion of the reactants with KOCH3 is facilitated.
In contrast, the lower rate of production of methyl esters coupled with the greater increase in interfacial tension relative to Na contributed to a high interfacial tension for the NaOH in relation to the other catalysts. It is reasonable to assume that the effect of the catalyst in the dispersion step is a combination of the effects of the metallic cations and the methyl esters at the methanol-oil interface. Figure7. Interfacial tension of oil with methanol (no catalyst) and methanolic solutions of NaOH, KOH, KOCH3, and NaOCH3 catalysts
(concentration: 0.41 mol L-1, temperature: 25.0 °C).
Conclusions
Dispersion of the reactants consumes a large part of the biodiesel synthesis time. Therefore, in order to decrease the time required for biofuel synthesis, more attention should be paid to the search for more efficient techniques to promote the dispersion of the reagents, as compared to the search for methods to improve the efficiency of methanolysis with alkaline catalysts.
The dispersion step is less sensitive to temperature variation than the methanolysis step, suggesting that it is possible to compensate the additional time spent in the synthesis of biodiesel with methanol at lower temperatures due to the decrease of the chemical reaction rate, if more efficient dispersion methods are employed. Thus, optimization of the system, lower energy costs, and smaller soap formation could be achieved.
In the dispersion step, K-containing catalysts proved to be more efficient than their Na analogues and methoxides were better than the analogous hydroxides. The rate of methyl ester production in this step and the specific effect of metallic cations on the interfacial tension were factors that contributed to the reduction in interfacial tension. As a consequence, dispersion of the reactants with these catalysts was favored.
The effect of catalysts and methyl esters on the dispersion time suggests that the addition of readily removable emulsifying agents (which does not influence the quality of the final product) to aid the dispersion process is an interesting and promising alternative to decrease the time required for the dispersion step and, consequently, for the synthesis of biodiesel.
Acknowledgments
The authors would like to thank CAPES, FAPERJ, and CNPq (Brazilian agencies) for their financial support.
References
1. Chisti, Y.; Biotechnol. Adv.2007, 25, 294.
2. Shahid, E. M.; Jamal, Y.; Renewable Sustainable Energy Rev.
2011, 15, 4732.
3. Atadashi, I. M.; Aroua, M. K.; Aziz, A. A.; Sulaiman, N. M. N.; J. Ind. Eng. Chem.2013, 19, 14.
4. Meher, L. C.; Sagar, D. V.; Naik, S. N.; Renewable Sustainable Energy Rev.2006, 10, 248.
5. Bargole, S.; Carpenter, J.; George, S.; Saharan, V. K.; Chem. Eng. Proc.2017, 122, 21.
7. Stamenković, O. S.; Lazić, M. L.; Todorović, Z. B.; Veljković, V. B.; Skala, D. U.; Bioresour. Technol.2007, 98, 2688. 8. Likozar, B.; Levec, J.; Appl. Energy2014, 123, 108.
9. Tubino, M.; Júnior, A. O. G.; Salomão, A. A.; J. Braz. Chem. Soc.2018, 29, 200.
10. Tubino, M.; Rocha Jr., J. G.; Bauerfeldt, G. F.; Fuel 2016, 125, 164.
11. Arzamendi, G.; Arguiñarena, E.; Campo, I.; Zabala, S.; Gandia, L. M.; Catal. Today 2008, 133, 305.
12. Ma, F.; Clements, L. D.; Hanna, M. A.; Bioresour. Technol.
1999, 69, 289.
13. Noureddini, H.; Zhu, D.; J. Am. Oil Chem. Soc.1997, 74, 1457. 14. Tubino, M.; Rocha Jr., J. G.; Bauerfeldt, G. F.; Catal. Commun.
2016, 75, 6.
15. Earnshaw, J. C.; Johnson, E. G.; Carroll, B. J.; Doyle, P. J.; J. Colloid Interface Sci.1996, 177, 150.
16. Lee, B. B.; Ravindra, P.; Chan, E. S.; Chem. Eng. Commun.
2008, 195, 889.
17. Harkins, W. D.; Brown, F. E.; J. Am. Chem. Soc.1919, 41, 499. 18. Santos, R. C. R.; Vieira, R. B.; Valentini, A.; Microchem.
J.2013, 109, 46.
19. Ghanei, R.; Moradi, G. R.; TaherpourKalantari, R.; Arjmandzadeh, E.; Fuel Process. Technol.2011, 92, 1593. 20. Xie, W.; Li, H.; J. Am. Oil Chem. Soc.2006, 83, 869. 21. Vicente, G.; Martinez, M.; Aracil, J.; Bioresour. Technol.2004,
92, 297.
22. Leung, D. Y. C.; Guo, Y.; Fuel Process. Technol.2006, 87, 883. 23. Ma, F.; Hanna, M. A.; Bioresour. Technol.1999, 70, 1. 24. Dutcher, C. S.; Wexler, A. S.; Clegg, S. L.; J. Phys. Chem. A
2010, 114, 12216.
Submitted: July 14, 2018 Published online: September 18, 2018