Ana Cristina Gaspar Silva
BSc in Health and Biological Sciences
Synthesis and biological evaluation of novel
anti-cancer agents
Dissertation for the Master's Degree in Molecular
Genetics and Biomedicine
Orientador: Maria Alexandra Núncio de Carvalho Ramos Fernandes, Professora Auxiliar, FCT/UNL
Co-orientadores: Maria Manuel Duque Vieira Marques dos Santos, Doutora, FF/ULisboa
Pedro Miguel Ribeiro Viana Baptista, Professor Associado com Agregação, FCT/UNL
Júri:
Presidente: Professora Doutora Paula Maria Theriaga Mendes Bernardo Gonçalves Arguente: Professora Doutora Maria Luísa Teixeira de Azevedo Rodrigues Corvo Vogal: Professora Doutora Maria Alexandra Núncio de Carvalho Ramos Fernandes
iii UNIVERSIDADE NOVA DE LISBOA
FACULDADE DE CIÊNCIAS E TECNOLOGIA
DEPARTAMENTO DE CIÊNCIAS DA VIDA
Ana Cristina Gaspar Silva
Synthesis and biological evaluation of novel
anti-cancer agents
Dissertation for the Master's Degree in
Molecular Genetics and Biomedicine, by Universidade
Nova de Lisboa, Faculdade de Ciências e Tecnologia
Orientador:
Professora Auxiliar Alexandra R. Fernandes (FCT/UNL) Co-orientadores:
Doutora Maria M. M (FF/ULisboa)
Professor Associado com Agregação Pedro M. R. V. Baptista (FCT/UNL)
v
Synthesis and biological evaluation of novel anti-cancer agents
Copyright Ana Silva, FCT/UNL, UNL
vii
ACKNOWLEDGMENTS
To everyone here mentioned I would like to express my immense gratitude for the opportunity and trust placed in me and, above all, thank you for walking alongside me during this journey.
Firstly, I would like to thank Professor Alexandra Fernandes which, besides being my supervisor during this project, was a mentor for the beginning of my career, triggering in me an insatiable will of discovery and ambition. To Professor Pedro Batista, my co-supervisor, which always calmed my anxiety with his good mood and cheer. Both have given me the opportunity to develop as a scientist and as a human being. To Professor Maria Santos, also my co-supervisor, for all her availability and support in the subject where I was less comfortable.
I believe that, without a team, it is impossible to achieve our goals brilliantly. For that, I am thankful to both teams of 319 and 315 laboratories, wherein, besides companions, where also my second home. To Catarina Rodrigues, for all her support and counseling, that appeased me so many times. To Elizabeth Lopes, for providing one of the chemical intermediated necessary for the final work. I would also like to thank Dário Valezim for all the care and companionship during the compound synthesis.
Well, the truth is that I would have not make it through this year if I had not had my friends by my side. To Vanessa Silva, for her amazing glee, your strident days will always be remembered. To Andreia Carvalho, my loyal companion during this journey, thank you for all the calmness that you were able to transmit when I needed the most.
To Joana Rodrigues, to you I am thankful for your friendship and unconditional support, you gave me the strength that I needed to achieve my goal. You were also the one responsible for the pounds I gained and all the laughs during this time. I learned a lot with you, I even learned how to be more chilled; how is it possible? I lived incredible moments with you. To our friendship. Cátia Raposo, my best friend, you are one of the persons that knows me better. Thank you for all the support, trust and friendship, for all the tears and laughs but most of all, thank you for being there! You were always there for me when I needed the most!
To my family, for all the faith in me and understanding for the missing moments. Without you and your support, I would not be prepared to take on this madness that is science. Even with an ocean between us, you have never failed me, you were always there, willing to listen to me at any given time.
To Fábio Costa, my person. There were so many times, where you were my motivation and strength. You always believed in me and in my capabilities, even when I did not believe. I am sorry for every hour that I have been away, and thank you for turning miles in such a short distance. You will always be the reason for me to overcome myself, to push forward, to not give up.
“It is hard to fail, but it is worse never to have tried to succeed.”
ix
RESUMO
O cancro continua a ser uma das principais causas de morte a nível mundial, apesar da profunda compreensão não só acerca da sua etiologia e dos esforços para uma deteção precoce, como também do desenvolvimento de abordagens terapêuticas mais personalizadas. A preocupação major em quimioterapia tem sido sintetizar novas moléculas capazes de inibir seletivamente o crescimento de células neoplásicas, evitando, assim, os efeitos adversos e/ou resistência adquirida. Neste contexto, a molécula sintetizada AM130, composta por um motivo espiro [pirrolidina-3, 3´-oxindole], apresenta atividades antiproliferativa contra células neoplásicas e antimalária. No presente estudo, debruçámo-nos sobre a síntese e o potencial antiproliferativo deste composto, bem como ao seu mecanismo de ação em células tumorais.
Os ensaios de viabilidade foram realizados não só em linhagens celulares de carcinoma do ovário, colorretal e da mama, como também em fibroblastos humanos normais, permitindo a caracterização do potencial citotóxico da molécula AM130. Os resultados revelaram que esta possui um maior efeito antiproliferativo contra as células do carcinoma do ovário, demonstrando, igualmente, maior seletividade para células tumorais em comparação com as células normais.
A atividade antiproliferativa observada deveu-se à indução de morte celular pela via apoptótica mediada pela mitocôndria e pela autofagia. Os estudos de interação com o DNA demonstraram que a AM130 interage com o DNA através de uma ligação aos sulcos, sem causar genotoxicidade ou paragem do ciclo celular. Além disso, a AM130 apresentou uma forte afinidade para a albumina de soro bovino. A análise de protéomica revelou que a maioria das proteínas identificadas estão associadas com a regulação da apoptose e da resposta ao stress, corroborando os resultados anteriormente obtidos acerca do mecanismo de morte celular induzido nas células do carcinoma de ovário pelo composto AM130.
xi
ABSTRACT
Cancer is still one of the deadliest diseases worldwide despite the deep understanding of its etiology and efforts toward an early detection and the development of personalized therapeutic approaches. Thus, the development of novel molecules that maybe selectively inhibit the growth of cancer cells, avoid side effects and/or acquired resistance has long been the focus in chemotherapy. One such compounds, AM130 with the spiro[pyrrolidine-3, 3´-oxindole] moiety has shown antiproliferative and antimalarial activity. Here, we report the synthesis and the biological anitproliferative potential of this compound, as well as its mechanism of action in cancer cells.
Viability assays were performed in ovarian, colorectal and breast carcinoma cell lines and normal human fibroblasts, allowing the characterization of the antiproliferative potential of AM130. Results showed that AM130 has a higher cytotoxic effect as well as higher selectivity for the ovarian carcinoma cell line.
The observed antiproliferative activity was due to the induction of cell death by mitochondria-mediated apoptotic pathway and autophagy. DNA interaction studies demonstrated that AM130 interacts with DNA by groove-binding, however without causing genotoxicity or cell cycle arrest. In addition, AM130 showed a strong affinity to bovine serum albumin. Proteomics analysis revealed that the majority of the identified proteins are involved in apoptosis and stress response regulation, corroborating the previous results about ovarian carcinoma cells death.
xiii GENERAL CONTENTS
ACKNOWLEDGMENTS ... vii
RESUMO ... ix
ABSTRACT ... xi
FIGURE INDEX ... xvii
1 INTRODUCTION ... 1
1.1 Cancer distribution, incidence, and mortality worldwide... 1
1.2 The Molecular Biology of Cancer ... 2
1.2.1 Carcinogenesis Hallmarks ... 2
1.2.2 Cell Cycle Regulation ... 4
1.2.3 Cell Death Signalling Pathways ... 6
1.3 Cancer Therapy ... 9
1.3.1 Conventional treatment options for cancer therapy ... 9
1.3.2 Chemotherapy ... 10
1.3.3 Derivatives of spirooxindoles in cancer therapy ... 14
1.4 Rationale and aims ... 15
2 MATERIALS AND METHODS... 17
2.1 Compound characteristics ... 17
2.1.1 Synthesis ... 17
2.1.2 General preparation of AM130 for biological assays... 17
2.2 Human cell lines culture ... 18
2.2.1 Cell line characteristics ... 18
2.2.2 Cell culture maintenance ... 19
2.3 In vitro cytotoxicity assessment ... 20
2.3.1 Cell culture ... 20
2.3.2 Compound exposure ... 20
2.3.3 Cell Viability assay ... 21
2.4 Assessment to cell death ... 21
2.4.1 Cells staining with Hoechst 33258 – Propidium Iodide ... 21
2.4.2 Annexin V-FITC and PI double-staining assay ... 22
xiv
2.4.4 Analysis of AM130-regulated apoptotic proteins by Western Blot ... 23
2.4.5 Measurement of production of intracellular reactive oxygen species... 24
2.4.6 Assessment to autophagic potential ... 25
2.5 Cell cycle Progression Assay ... 25
2.6 Assessment to AM130 interaction with DNA ... 26
2.6.1 Interaction with genomic DNA ... 26
2.6.2 Plasmid DNA cleavage assay ... 27
2.6.3 UV-visible titrations ... 27
2.6.4 Circular Dichroism ... 28
2.7 Assessment to AM130 interaction with serum proteins... 29
2.8 Proteome profiling: Two-Dimensional Gel Electrophoresis ... 29
2.8.1 Protein sample preparation, precipitation and purification ... 29
2.8.2 2-D Gel Electrophoresis: Isoelectric Focusing and SDS-PAGE ... 29
2.8.3 Detection and Digital Imaging ... 30
2.9 Statistical analysis ... 30
3 RESULTS AND DISCUSSION ... 31
3.1 Chemistry ... 31
3.2 Cytotoxicity of AM130 against human cancer and healthy cells ... 32
3.3 Evaluation of cell death ... 34
3.3.1 Hoechst 33258: nuclear morphology alterations ... 34
3.3.2 Annexin V-FITC/PI staining ... 36
3.3.3 Measurement of changes in mitochondrial membrane potential (∆𝜳𝑴) ... 37
3.3.4 Effects of AM130 in the levels of pro- and anti-apoptotic proteins ... 38
3.3.5 Measurement of production of intracellular reactive oxygen species... 39
3.3.6 Assessment to AM130 effect in autophagic cell death ... 41
3.4 Effects of AM130 on cell cycle progression ... 42
3.5 Assessment to DNA cleavage as an AM130 effect ... 43
3.6 Spectroscopic studies of the effects of anticancer AM130 interaction with DNA ... 44
3.6.1 UV-Visible spectra measurement ... 44
3.6.2 Circular dichroism spectra measurement ... 46
xvii
FIGURE INDEX
Figure 1.1 - Cancer hallmarks. ... 2
Figure 1.2 - The metastatic process.. ... 4
Figure 1.3 - Cell cycle phases and the cyclin-CDK complexes associated with each phase, as well as, the checkpoints involved in cell cycle regulation. ... 5
Figure 1.4 - Extrinsic and intrinsic pathways of apoptosis cell death. ... 7
Figure 1.5 - Autophagy process. ... 10
Figure 1.7 - Multiple mechanisms responsible for chemoresistance in tumor cells. ... 12
Figure 1.8 - Classification of ovarian carcinoma patients according with their platinum-response. ... 14
Figure 1.9 - Spirocyclic oxindoles scaffold. ... 14
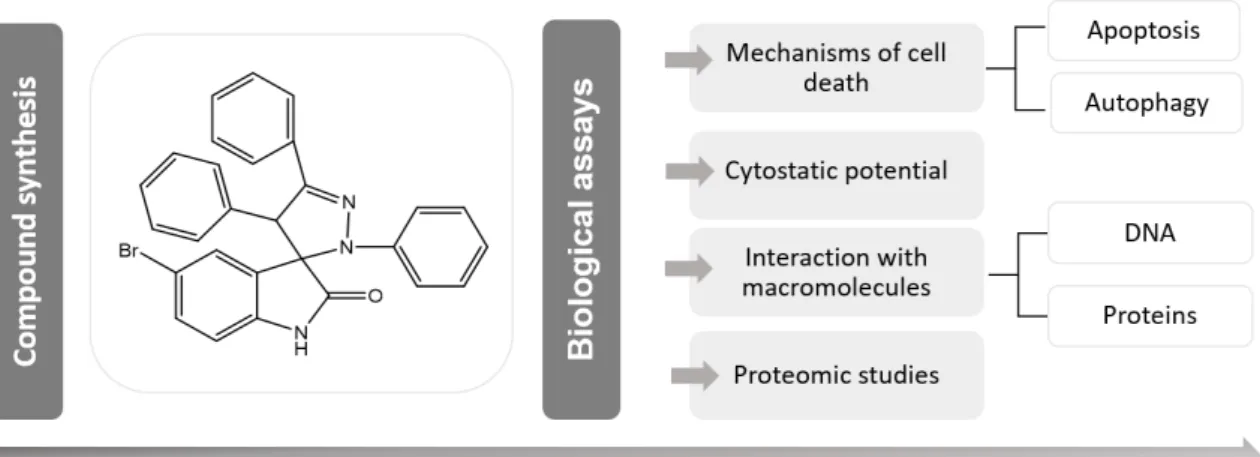
Figure 1.10 - Workflow process for AM130 chemotherapeutic agent study in cancer cells and healthy cells. ... 15
Figure 3.1 - Synthesis of 5-bromo-2',4',5'-triphenyl-2',4'-dihydrospiro[indoline-3,3'-pyrazol]-2-one 5 (AM130) by 1,3-dipolar cycloaddition reaction. ... 31
Figure 3.2 - Dose dependent cytotoxicity and the correspondent dose-response curve of AM130 in A2780 cells followed by 48 h of incubation. ... 33
Figure 3.3 - Dose dependent cytotoxicity and the correspondent dose-response curve of AM130 in healthy cells (fibroblasts) followed by 48 h of incubation. ... 34
Figure 3.4 - Fluorescence microscopy images showing nuclei morphological alterations in A2780 cells ... 35
Figure 3.5 - Mean values expressed as the percentage of apoptotic nuclei in A2780 cells. ... 35
Figure 3.6 - Evaluation and quantification of apoptosis and necrosis by flow cytometry with annexin V-FITC and PI double staining. ... 36
Figure 3.7 - Effect of AM130 compound on mitochondrial membrane potential (ΔΨM) in A2780 cells.. ... 37
Figure 3.8 - Fluorescence ratio green to red of ΔΨM, represented as mean ± SEM.. ... 38
xviii Figure 3.10 - Representative images of fluorescence microscopy to assess AM130 effect in ROS production. ... 40
Figure 3.11 - Quantification of the fluorescence intensity of H2DCF-DA dye in A2780 cells.. ... 40
Figure 3.12 - Hoechst 33342 and Cyto-ID® Green dye double-staining in A2780 cells to assess autophagic cell death. ... 41
Figure 3.13 - Percentage of cells with autophagic vacuoles. ... 42
Figure 3.14 - Effect of AM130 compound or DMSO in the cell cycle progression of HCT116. ... 43
Figure 3.15 - Agarose gel electrophoresis concerning the incubation of A2780 DNA genomic and plasmid DNA with AM130. ... 44
Figure 3.16 - Analysis of AM130 ̶ CT-DNA interaction by UV-Vis spectroscopy.. ... 45
Figure 3.17 - The interaction of AM130 with calf thymus DNA in 5 mM Tris-HCl 50 mM NaCl, pH 7.0 buffer at 37ºC by circular dichroism (CD). ... 47
Figure 3.18 - Absorption spectrum showing the formation of AM130 – BSA complex by UV-Vis spectroscopy. ... 48
Figure 3.19 - Protein overlaps among AM130-treated A2780 cancer cells compared to control. ... 50
Figure 3.20 - Representative two-dimensional gel electrophoresis for total protein extracts from A2780 cell line. ... 51
Figure 6.1 - Dose dependent cytotoxicity and the correspondent dose-response curve of AM130 in HCT116 cells followed by a 48 h incubation.. ... a
Figure 6.2 - Dose dependent cytotoxicity and the correspondent dose-response curve of AM130 in MDA-MB-453 cells followed by a 48 h incubation. ... a
Figure 6.3 - Dose dependent cytotoxicity and the correspondent dose-response curve of cisplatin in A2780 cells followed by a 48 h incubation. ... b
Figure 6.4 - Dose dependent cytotoxicity and the correspondent dose-response curve of doxorubicin in A2780 cells followed by a 48 h incubation... b
xix
TABLE INDEX
Table 1.1 - Main classes of chemotherapeutic drugs. ... 11
Table 2.1 - HCT116, MDA-MB-453 and A2780 cell lines and normal human fibroblast used during this project and respective typical characteristics. ... 19
Table 3.1 - In vitro cytotoxicity of AM130 (relative IC50) against several human cancer cell lines and normal human fibroblasts. ... 33
Table 3.2 - Proteome evaluation of AM130-treated A2780 cells compared to control. ... 51
Table 4.1 - Summary of each biological assay performed in AM130-treated cancer cells and its respective biological effects... 57
xxi
ABBREVIATION LIST
APAF-1 Apoptosis protease activating factor-1
A2780 Ovarian carcinoma cell line
BAX Bcl-2-associated X protein
BCL-2 B-cell lymphoma protein 2
Bid BH3-interacting domain deathagonist
BSA Bovine serum albumin
Caspase Cysteine-aspartic protease
CCR Complete culture medium recipe
CD Circular dichroism
CDKs Cyclin-dependent protein kinases
CKI Cyclin-dependent kinase inhibitor
CT-DNA Calf Thymus-DNA
DCF 2,7-dichloroflurescein
DISC Death inducing signalling complex
DMEM Dulbecco’s Modified Eagle Medium
DMSO Dimethyl Sulfoxide
DNA Deoxyribonucleic acid
DOX Doxorubicin
DTT Dithiothreitol
ECM Extracellular matrix
EC Endothelial cell
ER Endoplasmic reticulum
FADD Fas-associated death domain
FasL Fatty acid synthetase ligand
FBS Fetal Bovine Serum
FITC Fluorescein isothiocyanate
GLOBOCAN International Agency for Research on Cancer
HCT116 Colorectal carcinoma cell line
H2DCF-DA 2,7-dichlorodihydrofluorescein diacetate
HPR Horseradish peroxidase
IEF Isoelectric focusing
IPG Immobilized pH gradient
JC-1 5,5’,6,6’-tetrachloro-1,1’,3,3’- tetraethylbenzimi-dazolyl-carbocyanine iodide
LB Luria–Bertani liquid medium
MDA-MB-453 Breast adenocarcinoma cell line
MDM2 Murine double minute 2
MDR Multidrug resistance
MTS [3-(4,5dimethylthiazol-2-yl)-5-(3-carboxymethoxyphenyl)-2-(4-sulfophenyl)-2H tetrazolium]
OC Ovarian carcinoma
PBS Phosphate Buffered Saline
pDNA Plasmids DNA
PFA Paraformaldehyde
PI Propidium Iodide
PMSF Phenylmethylsulfonyl fluoride
pRB Retinoblastoma protein
RNA Ribonucleic acid
ROS Reactive oxygen species
xxii
SDS Sodium dodecyl sulfate
TP53 p53 protein encoding gene
WHO World Health Organization
Symbol List
[Compound] Compound concentration
[DNA] DNA concentration
ε Molar extinction coefficient of DNA
εa Apparent molar extinction coefficient
εb Bound complex molar extinction coefficient
εf Free molar extinction coefficient
𝓁 Optical path
𝜹 Chemical shifts
ΔΨM Mitochondrial membrane potential
IC50 Half Maximal Inhibitory Concentration
1
1 INTRODUCTION
1.1 Cancer distribution, incidence, and mortality worldwide
Cancer is considered a group of related diseases characterized by the autonomous proliferation of neoplastic cells due to innumerous epigenetic and genetic alterations (Millimouno et al. 2014) with the continuous influence of lifestyle habits (Colditz et al. 2012) and the exposure to several agents i.e., to carcinogens. The carcinogens can include: (i) biological agents, which include virus or bacterial infections; (ii) chemical agents, such as tobacco smoke components and (iii) physical agents like UV radiation (Colditz et al. 2012). Additionally, ageing is another fundamental factor in development of cancer since cellular repair mechanisms tend to be less effective with aging, leading to an accumulation of abnormalities (WHO, 2015). Nevertheless, only 5 to 10% of all cancers are due to an inherited gene defect, being breast and ovarian cancers the most common hereditary tumors (Marchina et al. 2010). For this reason, it is unquestionable that most cancers are due to lifestyle factors, such as dietary habits, smoking, alcohol consumption and infections and not by hereditary factors (Irigaray et al. 2007). As reported by the World Health Organization (WHO), it is possible that by modifying or avoiding these habits, more than 30% of cancer deaths could be prevented (WHO, 2015).
Data from the International Agency for Research on Cancer (GLOBOCAN) in 2012, estimated 14.1 million new cancer cases: 7.4 million (53%) in males and 6.7 million (47%) in females, with 8.2 million cancer deaths (Ferlay et al. 2013). Moreover, WHO projects a rise in cancer deaths to 13.1 million until 2030 (WHO, 2015). The most predominant and deadliest cancers registered worldwide, since 2012, were lung cancer, corresponding to 1.6 million deaths, liver cancer with 745 000 deaths, stomach cancer with 723 000 deaths and colorectal cancer with 694 000 deaths. The risk factors identified by WHO, as the main cause of deaths, were obesity, tobacco and alcohol consumption and sedentary lifestyle (WHO, 2015).
2 1.2 The Molecular Biology of Cancer
1.2.1 Carcinogenesis Hallmarks
Carcinogenesis is a multistep process associated with sequential accumulation of genetic mutations within tissue cells leading to the dysregulation of gene activities involved in cell growth control, programmed cell death regulation and genetic stability maintenance (Ashkenazi et al. 2008).
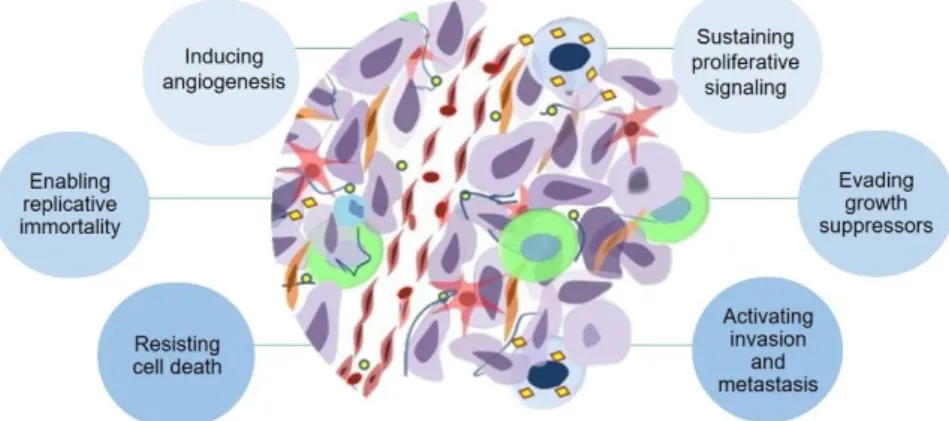
Hanahan & Weinberg have identified six malignancies capabilities responsible for cancer development including unlimited proliferative potential, environmental independence for growth, evasion of cell death, angiogenesis, invasion, and metastasis. Simultaneously to these biological phenomena, genome instability (Hanahan & Weinberg, 2011) and inflammation are also responsible for cell phenotype changes during cancer progression (Huang, 2013). The hallmarks responsible for the cancer development are described in Figure 1.1.
Figure 1.1 - Cancer hallmarks proposed by Hanahan and Weinberg. According to these authors, cancer development comprises features such as, sustaining proliferative signalling, evading growth suppressors, activating invasion and metastasis, resisting cell death, enabling replicative immortality and inducing angiogenesis. Adapted from (Hanahan & Weinberg, 2011).
To promote sustained chronic proliferation, as well as dysregulation of both cell survival and energy metabolism, cancer cells disrupt the control of production and release of growth-promoting signals. For this purpose, cancer cells are capable of producing growth factor ligands leading to an autocrine proliferative stimulation; manipulate the adjacent normal cells to supply them with various growth factors and, finally, cancer cells cause dysregulation and structural alterations of its surface receptors resulting in a hyperresponsivity to otherwise-limiting amounts of factors (Hanahan & Weinberg, 2011).
3
The ‘‘seed and soil’’ theory, proposed by Stephen Paget in 1889, describes the organ-specific pattern of metastasis i.e., the influence of the primary tumor on site specific metastasis. Therefore, the
secondary growth of cancer cells (the ‘‘seed’’) is dependent on the competence of the distal organ (the ‘‘soil’’) i.e., certain cancer cells have specific affinity for certain organs (Paget, 1889). Nowadays, this theory has been approved for various cancer types which metastasize at different and tumor-specific sites (Van Zijl et al. 2011). As mentioned, the microenvironment of the primary tumor is crucial for the metastasis success, because its needs to support tumor cell dissemination, motility, and local invasion into the vasculature, whereas the microenvironment at the secondary site needs to support cell adhesion, proliferation, and neovascularization. In addition, metastatic behavior of tumor cells can be influenced by the tumor microenvironment through (i) changes in the glycoprotein composition of the extracellular matrix (ECM) which, in turn, can influence the cell adhesion, motility, proliferation and apoptotic rates; (ii) alterations in the ECM-degrading proteinase activities within the stroma, facilitating the movement of tumorigenic cells by disrupting stromal barriers; and (iii) the release of bioactive ECM fragments and/or growth factors that can promote or suppress neoplastic progression of both stromal and tumor cells (Schedin & Elias, 2004). Besides the influence of primary tumor in metastasis process, overall, a range of biological, extrinsic chemical barriers, and physiological factors prevents this process. The biological factors are represented by the cellular microenvironment which regulates tumor dissemination by regulatory cytokines, chemokine feedback loops and by secretion of matrix metalloproteinases, while the extrinsic chemical barriers include pH, reactive oxygen species (ROS) or hypoxia, and the physiological factors correspond to intratumoral tensional forces, the composition of the basement membrane and the anatomy of capillary walls i.e., the anatomical structure and the density of lymphatic or blood vessels influencing the cancer cell spreading at distal sites of metastasis (Van Zijl et al. 2011).
4 Figure 1.2 - The metastatic process. Some of the cancer cells from the primary tumor acquire invasive and migratory properties, allowing invasion of surrounding tissues or migration towards neighboring blood vessels. The intravasation of cancer cells i.e. the entry of these into the blood vessels through EC junctions is required for the spread throughout body and, the subsequent extravasation i.e. when cancer cells leave the circulation at potential secondary tumor sites. Then, cancer cells transmigrate through the endothelial barrier, invading the basement membrane that surrounds the blood vessels. At the new metastatic site, cancer cells can enter in a state of dormancy or proliferate. Nonetheless, most cancer cells, that extravasate at the new microenvironment, will undergo cell death. Adapted from (Reymond et al. 2013).
Cells are continually exposed to a variety of cellular stresses, which are responsible for genomic aberrations causing genomic instability. Subsequently, the accumulation of these abnormalities can often result in the development of cancers, therefore it is important the proper stress response, through cell cycle regulation and cell death, to maintain genomic integrity and protect cells from malignant transformation (Ozaki & Nakagawara, 2011). In that sense, in the following subchapters the regulation of cell cycle and cell death will be presented.
1.2.2 Cell Cycle Regulation
The mammalian cell cycle involves various complex and highly regulated cellular events composed by two stages: interphase and mitosis (M), leading to deoxyribonucleic acid (DNA) synthesis and
segregation of replicated chromosomes into two daughter’s cells, respectively. Interphase includes G1 (gap 1), S (synthesis) and G2 (gap 2) phases, whereas mitosis includes prophase, metaphase, anaphase, and telophase stages. In addition, cells can be committed to enter G1 phase, remaining in a quiescent phase i.e., the Go (gap 0), where the cells do not grow and do not multiply (Vermeulen et al. 2003).
5 along signalling pathways related to cell proliferation. When mutated i.e., activated oncogenes, can promote uncontrolled tumor growth due to the dysfunction of proteins that are normally involved in the inhibition of cell cycle progression (Vermeulen et al. 2003).
CDKs belongs to a family of serine/threonine protein kinases and with pRB and p53 pathways (Lim & Kaldis, 2013) act as the central regulators of cell cycle by maintaining the exit and entry cells into the different cell cycle phases (Kitagawa et al. 2013). Furthermore, the CDKs’ catalytic activity is also
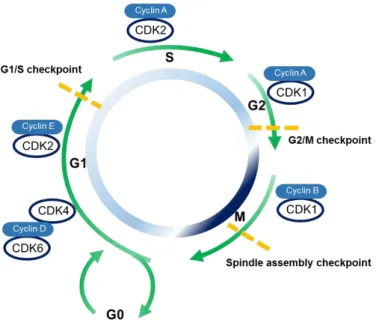
modulated by interactions with cyclins and CKI leading to the orderly progression of cells through the cell cycle (Lim & Kaldis, 2013). Figure 1.3 resume the regulation of cell cycle.
Figure 1.3 - Cell cycle phases and the cyclin-CDK complexes associated with each phase, as well as, the checkpoints involved in cell cycle regulation. The late G1 phase is regulated by cyclin D-CDK4 and cyclin D-CK6 complexes. The G1/S transition is associated with cyclin E-CDK2 complex the G1/S checkpoint also occurs. The complex cyclin A-CDK2 is a regulator of late S phase and before the cells progress to G2 phase, the S checkpoint also occurs. Cyclin A-CDK1 is implicated in the G2/M transition and in the checkpoint G2/M. Mitosis progression is regulated by cyclin B-CDK1 complex. Abbreviations: CDKs - cyclin-dependent protein kinases. Adapted from (Ferenbach & Bonventre, 2015).
Several exogenous and endogenous agents can cause DNA damage e.g., metabolic products, spontaneous nucleotides modifications, and physical and chemical agents. Consequently, the unrepaired DNA can potentially lead to tumor development. According to the literature, in response to DNA damage, three mainly checkpoints (G1/S, G2/M and spindle assembly) are activated to promote the correct DNA replication and growth cells. The restriction point is defined as a point of no return in G1, i.e., cells enter the quiescent phase (Vermeulen et al. 2003).
Ataxia-telangiectasia-mutated and ataxia and rad3 related are protein kinases that recognize DNA damage and, subsequently, phosphorylate the p53 protein leading to cell cycle arrest at the G1/S checkpoint in a p53-dependent manner (Vermeulen et al. 2003). At the molecular level, p53 – the
6 cellular process e.g., cell cycle, DNA repair, cell death, senescence, and angiogenesis (Ribeiro et al. 2016). Upon DNA damage, p53 is stabilized and activated through post-translational modifications with the subsequent accumulation in the cell nucleus. Depending on the damage severity (Ozaki & Nakagawara, 2011), i.e., when the stress levels are low, the p53 can induce a transient G1 cell cycle arrest allowing cells to repair their genome however, when the damages are too severe this protein can leads to the cells’ senescence or death by apoptosis through the activation of genes involved in apoptotic signalling pathway (Ribeiro et al. 2016).
After cell cycle, when cyclins, CDKs and CKIs, complete their functions, they are ubiquitylated by specific E3 ligases and eliminated via the ubiquitin–proteasome pathway (Kitagawa et al. 2013).
1.2.3 Cell Death Signalling Pathways
A broad diversity of regulated cell death phenomena, besides the common cell death mechanisms ─
caspase-dependent apoptosis and necrosis ─ are described in the literature, including necroptosis, autophagic cell death, pyroptosis, mitotic catastrophy, among others (Galluzzi et al. 2012). Notwithstanding, the present study is mainly focused on caspase-dependent apoptosis pathway and autophagy.
1.2.3.1 Caspase-dependent Apoptosis
Programmed cell death or apoptosis is a highly controlled physiological process that involves an energy-dependent cascade that culminate on the elimination of damaged cells. In addition, it is a vital pathway of various molecular processes such as normal cell turnover, embryonic development, tissue homeostasis, among other (Elmore, 2007).
Apoptosis and necrosis are two process that can occur independently, sequentially, as well as, simultaneously (Zeiss, 2003). While necrosis death follows acute cellular injury through an uncontrollable and passive process mediated by the interference with the energy supply of the cell and direct damage to cell membranes (Elmore, 2007), apoptosis is a well-established and highly controlled biochemical process divided into two pathways, namely intrinsic or extrinsic pathways (Adams & Cory, 2009). The extrinsic pathway involves ligand binding to a death receptor and the intrinsic pathway is initiated by cellular stresses resulting in the release of cytochrome-c from mitochondria (Millimouno et al. 2014; Figure 1.4). Both pathways subsequently cause activation of the caspase cascade which then triggers an ordered series of events that leads to death (Elmore, 2007).
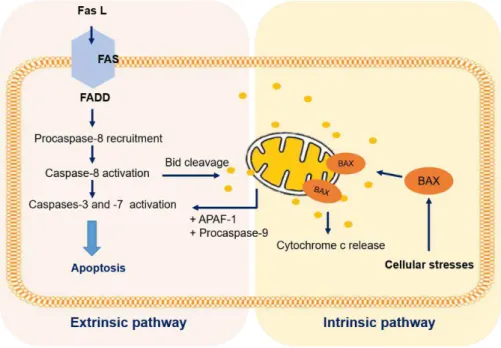
7 cytoplasm enabling the cleavage and activating effectors of caspases such as caspase-3 and -7, initiating the cascade of events in apoptotic cell death (Ranjan et al. 2012). The intrinsic apoptotic pathway is initiated by non-receptor mediated intracellular stimuli such as irreparable DNA damage, hypoxia, temperature, nutrients deprivation, among other (Elmore, 2007). As a result of these stimuli, the p53-regulated genes products enhance the secretion of cytochrome-c from the mitochondria into the cell cytosol (Harris & Levine, 2005). Cytochrome-c binds and activates the apoptotic protease activating factor 1 (APAF-1), also a p53-regulated gene, and the procaspase-9, forming the apoptosome. Then, the apoptosome activates the procaspase-3 into caspase-3 culminating in cleavage of proteins (Galluzzi et al. 2012). The cross-talk between the extrinsic and intrinsic apoptosis pathways occurs through caspase-8 cleavage of Bid (Elmore, 2007). Figure 1.4 describe the two mainly apoptotic pathways.
Figure 1.4 - Extrinsic and intrinsic pathways of apoptosis cell death. The schematic diagram describes the signalling molecules involved in the extrinsic (death receptor) and intrinsic (mitochondrial) apoptosis pathways. Abbreviations: APAF-1 - apoptotic protease activating factor 1; BAX - B-cell lymphoma protein 2 (BCL-2)-associated X protein; Bid - BH3-interacting domain death agonist; Fas L - Fatty acid synthetase ligand; FADD - Fas-associated death domain. Adapted from (Bruin et al. 2008).
8 1.2.3.2 Autophagic Cell Death
In response to nutrient starvation, hypoxia, energy depletion, endoplasmic reticulum (ER) stress and pharmacological agent treatment (Glick et al. 2010; Thost et al. 2015), eukaryotic cells activate a metabolic self-degradative process to digest their own cellular contents by a process referred to as autophagy or macro-autophagy (Thost et al. 2015).
Autophagy is a dynamic multistep process characterized by the lysosomal degradation (Thost et al. 2015) of protein aggregates, lipids, ribosomes and damaged or unnecessary organelles, through dynamic membrane rearrangements (Hamasaki et al. 2013), leading to cellular homeostasis and survival (Thost et al. 2015). Additionally, this cellular mechanism also provides macromolecules and energy (adenosine triphosphate, amino acids, etc.; Hamasaki et al. 2013). The main autophagy hallmark is the formation of double-membrane vesicles ─ autophagosomes ─ at the phagophore assembly site that sequester the subcellular components for posterior degradation. The formation of autophagosomes requires a membrane precursor such as autophagopore (Janku et al. 2011; Thost et al. 2015) derived from the lipid bilayer of ER, trans-Golgi network, mitochondrial outer membrane, or the plasma membrane, which then expands to engulf the intracellular components (Glick et al. 2010). The maturation of autophagosomes involves their fusion with lysosomes ─ autophagolysosomes ─ acquiring acidic hydrolases and leading to degradation of components (Thost et al. 2015). The resulting by-products return to the cytosol, where they can be re-used for metabolism and formation of new macromolecules (see Figure 1.5; Glick et al. 2010). For more information about molecular signalling pathway of autophagy refer to: (Janku et al. 2011; Hamasaki et al. 2013).
Figure 1.5 - Autophagy process. Briefly, the phagopore is formed resulting in an autophagosome which then fuses with the lysosome originating the autophagolysosome. Subsequently, the cargo-containing membrane compartment is lysed and degraded. Adapted from (Janku et al. 2011).
9 1.3 Cancer Therapy
1.3.1 Conventional treatment options for cancer therapy
Cancer treatment decisions include the determination of the benefits of adjuvant (after surgery) or neoadjuvant (before surgery) chemotherapy and radiotherapy according to each patient, since it can lead to increased toxicity; specific quality-of-life implications, and competing health issues. Furthermore, it is necessary to keep the balance between the specific circumstances and individual choices of patients and their families about therapy (Rahal et al. 2014).
Classical cancer treatment options include cytoreductive surgery, radiotherapy and chemotherapy (Vergote et al. 2011) and can be used either alone or in combination to eradicate the total tumor mass and/or diminish the possibility of invasion and metastasis (Shewach & Kuchta, 2009).
Surgery is divided into two strategies: (i) primary cytoreductive which aims to remove as much tumor as possible before the administration of chemotherapy or radiotherapy and (ii) interval cytoreductive surgery which involves the surgery after a brief period of neoadjuvant chemotherapy, usually three cycles of chemotherapy, or radiotherapy leading to the reduction of metastases confining the tumor mass (Vergote et al. 2011). Radiotherapy is a widely-used strategy for the treatment of solid and localized tumors, usually applied after surgery or used as an effective modality of palliative treatment to relieve patients from symptoms caused by the cancer (Baskar et al. 2012). Cancer chemotherapy is based on the intravenous administration of drugs (Crawford, 2013). Nevertheless, cancer cells due to their extensive genomic instability can adapt to chemotherapeutic agents by the activation of alternative pathways or enabling new genetic mutations to overcome the inhibitory effect of the drug, resulting in drug-resistant phenotypes (Mendelsohn, 2013).
10 Figure 1.6 - Therapeutic options and their limitations. Adapted from (Jabir et al. 2012).
Unfortunately, tumor response to traditional therapeutic approaches are usually partial, brief, unpredictable and associated with high resistance (Souhami et al. 2002). To avoid these outcomes, new approaches in cancer treatment, namely immunotherapy, hyperthermia and nanoparticle targeted therapy, increase effectiveness, specificity, and capability of improving the patient's quality of life (Cabral & Baptista, 2014). However, the focus of this project is chemotherapy, which will be discussed in the following sub-chapter. For more information about the therapies mentioned before refer to: (Alderton & Bordon, 2012; Soares et al. 2012; Brannon-Peppas & Blanchette, 2012)
1.3.2 Chemotherapy
11 Table 1.1 - Main classes of chemotherapeutic drugs discriminating their main representatives, modes of action and adverse effects on patient organism.
Agent Class Chemotherapeutic drug Mode of action Adverse Effects
Alkylating agents Cisplatin Crosslinking of DNA
chains
Myelosuppression, immunosuppression,
nephrotoxicity
Antimetabolites 5-Fluorouracil
Inhibition of enzymes Introduction of false substances in DNA
Myelosuppression, cardiotoxicity, alopecia
Anthracyclines Doxorubicin Inhibition of
topoisomerase II
Cardiotoxicity, myelosuppression Mitotic inhibitors Paclitaxel Antimicrotubular agent Peripheral neuropathy
Briefly, the alkylating agents, which include platinum drugs, act through the covalent binding of
hydrocarbons or alkyl groups to cell’s DNA, causing DNA cross-links and strand breaks leading to either apoptosis or necrosis. On the other hand, antimetabolites are agents that compete with physiologic molecules during the formation of cellular macromolecules through their incorporation into macromolecules framework affecting their normal functionality in cells. Most of these chemotherapeutic agents are cell-phase specific because their affect the DNA or ribonucleic acid (RNA) synthesis by either replacing a nucleotide (e.g., 6-mercaptopurine) or repressing nucleotide synthesis (e.g., methotrexate and 5-fluorouracil), resulting in the formation of truncated cellular proteins, and ultimately apoptosis (Mihlon et al. 2010). Anti-tumor antibiotics, which include anthracyclines interfere with enzymes involved in DNA replication (e.g., doxorubicin) whereas, topoisomerase inhibitors, which also include the doxorubicin, are responsible for the inhibition of the action of DNA topoisomerases I or II. Topoisomerases are enzymes that relieves the torque on the double helix of DNA allowing the strand to unwind, and then re-annealing the free ends. Doxorubicin inhibits the re-annealing reaction, and the accumulation of DNA strand breaks, ultimately leading to apoptosis or cell necrosis. Mitotic inhibitors derived from natural products (e.g., paclitaxel) have as cellular target the microtubules which are responsible for the cytoskeletal framework of a cell that allows intracellular transport of cellular components and mitosis during the cell division. Some of these anticancer agents will be discussed in more detail in the following two sub-chapters according to the malignancy in study (ovarian carcinoma; Mihlon et al. 2010).
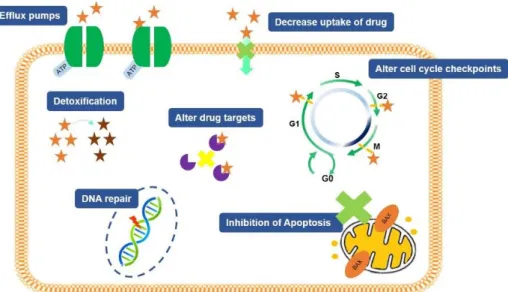
12 efflux from tumor cells, down- or up-regulation of a drug target, existence of cancer stem cells and the influence of tumor microenvironmental components (Figure 1.7; Lovitt et al. 2014).
Figure 1.7 - Multiple mechanisms responsible for chemoresistance in tumor cells. These includes decreasing drug accumulation in tumor cells through efflux pumps, increasing cellular detoxification, altering the cell cycle checkpoints, altering the drug targets, inducing a response anti-apoptotic and, finally, increasing the mechanisms involved in DNA repair. Adapted from: (Chai et al. 2010; Kigawa 2013).
Over the past years, significant efforts have been made to improve both early detection of cancer and new therapies. In spite of that, the mortality rates associated with cancer have not significantly reduced being this malignancy the major health problem worldwide. In addition to the reasons described above, and considering the side effects of current anticancer drugs, is important the development and synthesis of new molecules with more efficiency and efficacy for cancer treatments.
1.3.2.1 Ovarian Cancer: principal features and therapeutic approach
Ovarian carcinoma (OC) is the fifth leading cause of cancer-related mortality in women with more than 40 000 new cases annually in the European Union (Colombo et al. 2010). OC is a deadly and highly metastatic disease with a 30 to 92% of 5-year survival rate depending on the spread of disease at diagnosis (Yap et al. 2009). The high morbidity and mortality associated with OC is related with the late diagnosis which, in turn, is related with not explicit symptoms, where most patients show metastatic spread beyond the ovaries (Goff et al. 2000; Smith et al. 2005; Binaschi et al. 2011).
13 remains uncertain (Jelovac & Armstrong, 2011). Additionally, it is known that genetic factors have the most potent impact i.e., family history plays a very important role in the development of the disease because women with a first-degree relative have more than a twofold increase in risk of OC compared with women with no family history of OC. Additionally, hereditary OC results in the earlier development of the disease, approximately 10 years earlier, than women with non-hereditary ovarian cancer (Ledermann et al. 2013).
Standard treatment for OC include debulking surgery and six cycles of platinum/taxane-based chemotherapy (i.e., the combination of cisplatin or carboplatin and paclitaxel or docetaxel) resulting in a complete clinical remission in most of the patients (Smolle et al. 2013; American Cancer Society, 2016). Platinum-drugs (e.g. cisplatin and carboplatin) forms inter- and intra-strand crosslinks on DNA which are then recognized by the cellular machinery that either repairs the lesion or induces apoptosis. The mechanism by which platinum-drugs lead to apoptosis is through inhibition of transcription i.e., the RNA polymerases stalls at the platinum cross-link, recruiting then the transcription-coupled repair machinery and being unable to repair the lesion, the cell evokes a programmed cell death pathway (Agarwal & Kaye, 2003; Johnstone et al. 2014). Paclitaxel and docetaxel (taxanes) are anti-microtubule agents that irreversibly binds to the protein β-tubulin promoting the microtubule stabilization which results in G2–M arrest and apoptosis, via both p53-dependent and -independent pathways (Agarwal & Kaye, 2003; Jimenez et al. 2011).
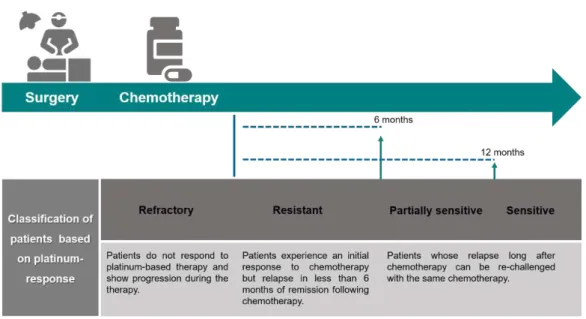
14 Figure 1.8 - Classification of ovarian carcinoma patients according with their platinum-response. Second-line treatment is needed for the most of patients. Platinum sensitivity is a good predictor of response. Platinum refractory disease and platinum-resistant disease has a bad prognosis while platinum sensitive patients have a long interval between diagnosis and recurrence show a better survival. Adapted from (Chien et al. 2013; Smolle et al. 2013).
Considering all outcomes described above it is urgent to develop more effective and targeted therapies, since the biology of OC is very heterogenous, leading to the overall improvement of OC patient’s quality of life (Vergote, 2014). The development of molecular targeted therapies, including small-molecule inhibitors and monoclonal antibodies that target multiple crucial cancer characteristics – angiogenesis, survival, cell growth and metastases have been recently described (Yap et al. 2009; Coward et al. 2015).
1.3.3 Derivatives of spirooxindoles in cancer therapy
Spirooxindoles are important compounds composed by a spiro system fused at the 3-position (C3) a varied of heterocyclic motifs (Figure 1.9), found in many natural products with pharmacological interest (Galliford & Scheidt, 2007). In drug discovery, spirooxindole
scaffold represents a crucial structure for the synthesis of synthetic and natural compounds with biological activity since they incorporate both oxindoles and other heterocyclic moieties simultaneously (Yu et al. 2015).
Figure 1.9 - Spirocyclic oxindoles scaffold. Adapted from (Yu et al. 2015).
(5-bromo-2',4',5'-triphenyl-2',4'-dihydrospiro[indoline-3,3'-15 pyrazol]-2-one (AM130); Monteiro et al. 2014; Ribeiro et al. 2016; Nunes 2016). The overall research development by the team demonstrated that these agents are able to inhibit the growth of cancer cells with high selectivity. Additionally, the loss of cell viability, as a result of these agents’ action, is associated
with the p53 stabilization and transactivation, the induction of apoptosis, as well as the inhibition of the interaction between p53 and MDM2. Considering that the p53 tumor suppressor is the “guardian of the
genome” that plays a significant role in the regulation of several biological processes, restoring its function in cancer cells represents a valuable anticancer approach, that has been immensely study by
Santos’ group. In this sense, the present project arises as a continuation of the study developed by Nunes, 2016.
1.4 Rationale and aims
There is a growing demand for chemotherapeutic agents that can selectively inhibit tumor growth with the subsequent reduction of deleterious effects in healthy tissue and capable to avoid the development of drug resistance profiles (Silva et al. 2014). Considering this, the present study aims to explore the cytotoxic potential and mode of action of a novel anticancer agent, referred as AM130 synthetized for the first time by Santos’ group (Monteiro et al. 2014). To accomplish these aims after compound synthesis, several biological assays were performed as described in Figure 1.10.
17
2 MATERIALS AND METHODS
2.1 Compound characteristics
2.1.1 Synthesis
The 5-bromo-2',4',5'-triphenyl-2',4'-dihydrospiro[indoline-3,3'-pyrazol]-2-one named during this project by AM130 compound was synthesized at Faculdade de Farmácia (Universidade de Lisboa) according to the procedure described by Monteiro et al. 2014.
2.1.1.1 Synthesis of (E)-3-benzylidene-5-bromoindolin-2-one
A solution of 5-bromoindoline-2,3-dione (1.3 x 10⁻³ mol; 300 mg; 1.0 equiv.), ethylene glycol (2.2 mL) and hydrazine monohydrate (3.8 x 10⁻³ mol; 0.15 mL; 2.5 equiv.) was heated under reflux for 4 h under nitrogen atmosphere. The resulting brown solution was filtrated. The resulting 5-bromoindolin-2-one was dissolved in ethanol (11 mL), and then benzaldehyde (1.6 x 10⁻³ mol; 164 µL; 1.6 equiv.) and piperidine (1.5 x 10⁻³ mol; 145 µL; 1.0 equiv.) were added. After 1 h 30 min at reflux, the reaction was placed at -20ºC to obtain a precipitate, which was filtrated and dried in vacuo overnight. The residue was purified by flash column chromatography using ethyl acetate/n-hexane 1:2 as eluent, followed by purification using silica gel preparative chromatography (yield 16.3%; 65.8 mg; Sun et al. 1998).
2.1.1.2 Synthesis of AM130
(E)-3-benzylidene-5-bromoindolin-2-one (2.4 x 10⁻⁴ mol; 36.7 mg; 2.0 equiv.) was dissolved in dry dichloromethane (20 mL) and (Z)-N-phenylbenzohydrazonoyl chloride (5.6 x 10⁻³ mol; 56.4 mg; 2.0 equiv.) and triethylamine (7.3 x 10⁻⁴ mol; 56.8 µL; 3.0 equiv.) were added. The reaction was stirred at room temperature (RT) for 9 h. Then, distillated water (20 mL) was added to the reaction, the phases were then separated and the aqueous phase was extracted three times with ethyl acetate (10 mL). The combined organic phases were dried and concentrated. After flash column chromatography (eluent: ethyl acetate/n-hexane 1:2), the product was washed with diethyl ether resulting in a white solid (yield 18%; 10.8 mg) – 5-bromo-2',4',5'-triphenyl-2',4'-dihydrospiro[indoline-3,3'-pyrazol]-2-one (AM130). The 1H nuclear magnetic resonance spectroscopy of compound were was in accordance, with the one reported (Monteiro et al. 2014).
2.1.2 General preparation of AM130 for biological assays
18 2.1.2.1 Effects of freezing and sonication of an AM130 solution in DMSO
The spectra of AM130 in DMSO was analyzed by UV–Visible spectroscopy (230–600 nm) in an Evolution 300 UV–Vis spectrophotometer (Thermo Fisher Scientific, Madison, USA) using a quartz cuvette of 1 cm path length. Initially, a range of dilutions was made from a stock solution with 100 mM (10; 25; 50; 75; 100 and 200 μM) under two conditions: immediately after its solubilization in DMSO i.e., without freezing the solubilized compound and 1 week after freezing (-20°C). In addition, to verify the effects of sonication (sonicator Elma, D-78224 Singen/Htw, Germany) in compound solubility, AM130 UV-Vis spectra was also analyzed with 100 μM after 72 h of freezing through two conditions: sonicated and not sonicated.
Compound stability was previously performed in phosphate buffered saline (PBS) at 37ºC for 72 h by Nunes, 2016.
2.2 Human cell lines culture
2.2.1 Cell line characteristics
19 Table 2.1 - HCT116, MDA-MB-453 and A2780 cell lines and normal human fibroblast used during this project and
respective typical characteristics namely source, morphology, and growth medium. DMEM - Dulbecco’s Modified
Eagle Medium (Invitrogen, New York, EUA); RPMI - Roswell Park Memorial Institute medium (Invitrogen, New York, EUA); FBS – Fetal Bovine Serum (Invitrogen, New York, EUA); Penicillin/Streptomycin (antibiotic) + Antymicotic (Invitrogen, New York, EUA); MEM non-essential amino acid 100x (Sigma, St. Louis Missouri, EUA). Cells Source: ATCC – The Global Bioresource Center, 2015.
Cell line Source Morphology Growth medium % (v/v)
HCT116 Colorectal carcinoma Epithelial
DMEM FBS 10% Pen/Strep 1%
MEM 1x
MDA-MB-453 Breast adenocarcinoma Epithelial
DMEM FBS 10% Pen/Strep 1%
MEM 1x
A2780 Ovarian carcinoma Epithelial
RPMI FBS 10% Pen/Strep 1%
MEM 1x
Fibroblastsa Human dermis Sindle-shaped/ bipolar and refractile
DMEM FBS 10% Pen/Strep 1%
MEM 1x a Healthy culture
2.2.2 Cell culture maintenance
HCT116 and MDA-MB-453 cell lines were grown in DMEM and A2780 cells in RPMI, supplemented with 10% (v/v) FBS, MEM 100x and 1% (v/v) antibiotic/antimycotic solution (Pen-Strep+antimycotic:
10000 units/mL of penicillin, 10000 μg/mL of streptomycin and 25 μg/mL of Fungizone® Antimycotic), which is named by complete culture medium recipe (CCR; see Table 2.1). Normal human fibroblasts were cultivated in the same growth conditions of HCT116 and MDA-MB-453 cell lines. HCT116 and A2780 cell lines were maintained in 75 cm2 vented cell culture flasks and MDA-MB-453 cells and normal human fibroblast in 25 cm2 vented cell culture flasks (SPL Life Sciences, Korea) in an incubator (SANYO CO2 Incubator, Electric Biomedical Co., Osaka, Japan) with controlled atmosphere (5% (v/v) CO2 and 99% (v/v) humidity) at 37°C.
20 Cells were counted using the trypan blue exclusion method in an hemocytometer (Hirschmann, Eberstadt, Germany) from a mixture of 350 μL of CCR medium, 100 μL of 0.2% (v/v) trypan blue (Sigma, St. Louis, EUA) and 50 μL of cellular suspension obtained during the subculturing process. Trypan blue is known to dye to cells with loss of membrane permeability thus, excluding unviable cells from count. The cells were observed using Olympus CXX41 inverted microscope, Tokyo, Japan. The final assessment of cell density (in cells/mL) is obtained by multiplying the number of total cells counted, the volume of the hemocytometer (104 mL-1) chamber and the dilution factor (10) divided by the number of squares counted, as represented in the following Equation (1):
𝐓𝐨𝐭𝐚𝐥 𝐜𝐞𝐥𝐥𝐬/𝐦𝐋 = 𝐓𝐨𝐭𝐚𝐥 𝐜𝐞𝐥𝐥 𝐜𝐨𝐮𝐧𝐭𝐞𝐝 𝐱 𝟏𝟎 𝐱 𝟏𝟎𝐍𝐮𝐦𝐛𝐞𝐫 𝐨𝐟 𝐬𝐪𝐮𝐚𝐫𝐞𝐬 𝟒
Equation 1
Applying the Equation (1), it was possible to estimate the appropriate volume of the cell suspension to add in a new 75 and 25 cm2 vented cell culture flasks with 13 mL and 5 mL, respectively, of fresh CCR medium. Cells were incubated at 37°C in a controlled atmosphere of 5% (v/v) CO2 and 99% (v/v) humidity.
2.3 In vitro cytotoxicity assessment
Cell viability assay was performed in HCT116, MDA-MB-453 and A2780 cell lines as well as in healthy cells using a homogeneous, colorimetric method applied to determine the number of viable cells in proliferation ─ CellTiter 96 Aqueous Non-Radioactive Cell Proliferation Assay (Promega, Madison, USA; Silva et al. 2012). The CellTiter 96® AQueous Assay is composed by two solutions: [3-(4,5-dimethylthiazol-2-yl)-5-(3-carboxymethoxyphenyl)-2-(4-sulfophenyl)-2Htetrazolium], inner salt (MTS) and phenazinemethosulfate, an electron coupling reagent (Promega, 2012).
A control experiment to study the interference of the compound with the MTS reagent was performed. Additionally, the cytotoxic potential of common chemotherapeutic agents, such as cisplatin and doxorubicin (Sigma, St. Louis, EUA), was also assessed.
2.3.1 Cell culture
For the dose-response curves, the cell density (in cells/mL), determined by the exclusion method (Section 2.2.2; Equation 1), was diluted to 0.75 x 10⁵ cells/mL using the appropriated CCR medium and seeded in a 96-well plate (SPL Life Sciences, Korea). After 24 h of incubation at 37°C in a 5% CO2 (v/v) and 99% (v/v) humidity atmosphere, the cells plated were observed using the inverted microscope and their adherence were confirmed.
2.3.2 Compound exposure
21 incubated under the same conditions during 48 h. A total of three biological experiments with technical duplicates were performed for each condition.
2.3.3 Cell Viability assay
After 48 h of cell incubation in the presence or absence of compound, cell viability was evaluated through CellTiter 96® AQueous Non-Radioactive Cell Proliferation Assay. Briefly, the medium was removed and 100 μL of a solution mixture of fresh CCR medium and MTS reagent(20 µL reagent to 100 µL of CCR medium) was added to each well. Then 96-well plates were incubated during, approximately, 45 min under the same conditions described above. Afterwards, the absorbance at 490 nm was measured with Tecan Infinite F200 Microplate Reader (Tecan, Männedorf, Switzerland). Obtained data were normalized relatively to control samples (DMSO) to obtain cell viability for each concentration with Equation (2):
𝐂𝐞𝐥𝐥 𝐕𝐢𝐚𝐛𝐢𝐥𝐢𝐭𝐲 (%) = 𝐒𝐚𝐦𝐩𝐥𝐞𝐬 𝐚𝐛𝐬𝐨𝐫𝐯𝐚𝐧𝐜𝐞 (𝟒𝟗𝟎 𝐧𝐦)𝐂𝐨𝐧𝐭𝐫𝐨𝐥 𝐚𝐛𝐬𝐨𝐫𝐯𝐚𝐧𝐜𝐞 (𝟒𝟗𝟎 𝐧𝐦) 𝐱 𝟏𝟎𝟎
Equation 2
Results are expressed as relative IC50 values, determined using the GraphPadPrism 6 software (Graph Pad Software Inc., San Diego, Ca, USA). Relative IC50 corresponds to the halfway point from maximum viability plateau and minimum viability plateau from an inhibition curve, not always corresponds to a 50% of cell viability, being the accepted concept for the study. However, the absolute IC50 value corresponds to a compound concentration that causes 50% of cell metabolic inhibition (Neubig et al. 2003).
2.4 Assessment to cell death
2.4.1 Cells staining with Hoechst 33258 – Propidium Iodide
A2780 cells treated with AM130 compound were evaluated by nucleic acid staining with Phenol, 4-[5-(4-methyl-1-piperazinyl) [2,5'-bi-1H-benzimidazol]-2'-yl]-, trihydrochloride 23491-45-4 (Hoechst 33258) and propidium iodide (PI; Sigma, St. Louis Missouri, EUA). Hoechst 33258 and PI staining methods, with the analysis of apoptotic and necrotic cells, respectively, through fluorescence microscopy, constitutes a preliminary assay to evaluate viability loss due to compound’ action. Briefly, cells were collected by the procedure described in Section 2.2.2 and plated in 2-well cells culture slide (SPL Life Sciences, Korea) at 0.75 x10⁵cells per mL diluted in fresh CCR medium and incubated in a humidified atmosphere at 37°C. After 24 h of incubation, depleted CCR medium was replaced by AM130 compound with IC50 concentration (8.5 μM) or 0.1% (v/v) DMSO (vehicle control) diluted in fresh CCR medium. Following 48 h of incubation at the same conditions described previously, medium was discarded once more and cells were washed twice with PBS 10x (Invitrogen, New York, EUA) supplemented with 5% (v/v) FBS. Afterwards, cells were readily fixed to microscope slides with 4% (v/v) paraformaldehyde (PFA; Invitrogen, New York, EUA), at RT in the absence of light for 20 min. For cell staining, PFA was removed and cells were washed three times with PBS 10x supplemented. For nuclei detection, 400 μL
22 PBS 10x supplemented and incubated in the absence of light, at RT, for 15 min, followed by three times washing with PBS 10x supplemented. Before lamellae preparation with a droplet of glycerol, cells were washed again with PBS 1X.
Fluorescent nuclei were analyzed based on the chromatin condensation degree and characteristics. Normal nuclei showed non-condensed chromatin uniformly distributed over the entire nucleus, whereas apoptotic nuclei showed condensate or fragmented chromatin with a bright non-homogenous blue fluorescence. In addition, some cells formed apoptotic bodies. On the other hand, nuclei of necrotic cells showed a bright pink fluorescence. The samples were photographed in an Olympus BX51 fluorescent microscope with an attached Olympus DP50 (Olympus) camera and the photographs were acquired with Infarview software, and three random microscopic fields per sample with ca. 50 nuclei were counted. Mean values were expressed as the percentage of apoptotic nuclei.
2.4.2 Annexin V-FITC and PI double-staining assay
The annexin V-binding assay using flow cytometry is considered one of the most sensitive and reliable technique to detect and distinguish between early apoptosis and late apoptosis, as well as necrosis (Henry et al. 2013). However, due to the staining difficulties of A2780 cells, we performed the assay with the HCT116 cell line (also with a low IC50) instead of the A2780 cell line.
To quantify AM130-induced cell death in HCT116 cells a double-staining with fluorescein isothiocyanate (FITC) label and annexin V and PI was performed. HCT116 cells were seeded in 35 mm culture dishes (VWR, Europe) at 1x10⁵ cells/mL and incubated in the conditions described in section 2.2.2. Culture medium was removed after 24 h and replaced with 1 mL of fresh CCR medium containing either IC50 compound concentration or 0.1% (v/v) DMSO (vehicle control). Cells were incubated for 48 h, collected by trypsinization and centrifuged at 1000 x g for 5 min at RT. The obtained pellet was rinsed twice with 1 mL of cold PBS 1x intercalated with 5 min of centrifugations at 1000 x g. Following centrifugations,
100 μL of annexin binding buffer 1x, 5 μL of annexin V-FITC and 2 μL of PI (Annexin V-FITC Apoptosis Detection Kit; Invitrogen, USA) was added to all samples and incubated for 15 min at RT, in the absence of light. Afterwards, to these cellular suspensions were added 400 μL of annexin binding buffer 1x and 500 μL of cold PBS 1x. The analysis and quantification of apoptotic events and necrosis were performed by flow cytometry on Attune® Acoustic Focusing Flow Cytometer (Life Technologies, Carlsbad, California) using an Attune® Cytometric software (Life Technologies), with the acquisition of at least 10 000 events per sample. Data presented here are from two independent experiments.
2.4.3 Measurement of mitochondrial membrane potential (∆𝜳𝑴)
23 A2780 cell lines were seeded into 8-well cells culture slide (SPL Life Sciences, Korea) at 0.75 × 10⁵ cells/well density and incubated during 24 h in the same conditions described in Section 2.2.2. After incubation, A2780 cells were treated with 8.5 μM of AM130 compound or 0.06% (v/v) DMSO (vehicle control) diluted in CCR fresh medium and incubated for 48 h. For the measurement of the fluorescence intensity, cells were stained with JC-1 staining solution for 20 min at 37°C in dark condition, followed by their visualisation with Olympus Bx51 microscope equipped with Olympus DP50 camera using the same exposition time for all samples. By ImageJ software (National Institutes of Health (NIH), Bethesda, MD, USA), green to red fluorescence ratio of each sample was determined. Experiments were repeated two times using two independent biological experiments.
2.4.4 Analysis of AM130-regulated apoptotic proteins by Western Blot
2.4.4.1 Sample Preparation
For whole protein extraction, A2780 cells were seeded in 75 cm2 vented cell culture flasks at a cell density of 4 x 10⁶ cells, in the same conditions mentioned in section 2.2. After 24 h, depleted medium was removed and fresh CCR medium was added with the IC50 corresponding compound concentration (8.5 μM) or with 0.1% (v/v) DMSO (vehicle control). After 48 h, cell samples were washed twice with PBS 1x and collected with a scrapper to a microtube on ice. All samples were centrifuged at 500 x g, for 5 min at 4ºC, and the supernatant discarded. Then, the pellets were washed one more time with PBS 1x and centrifuged at 900 x g for 5 min at 4ºC, and to ensure that all PBS was removed to not dilute cell lysis solution, a final spin was performed. Additionally, samples were resuspended in 100 μL of cell lysis solution containing NaCl-Tris-EDTA buffer (150 mM NaCl; 50 mM Tris, pH=8; 5 mM EDTA), phosphatase inhibitors 1x (PhosStop, Roche), protease inhibitors 1x (complete ULTRA Tablets, Mini, EASYpack, Roche, Switzerland), 0.1% (w/v) dithiothreitol (DTT; AMRESCO, USA), 1 mM of phenylmethylsulfonyl fluoride (PMSF; Sigma, St. Louis, EUA), and 2% (w/v) Nonidet P-40 (Thermo Scientific, MA, EUA) and samples were stored at -80ºC, until further processing. After thawing, all samples were submitted to 2 min 30 s of continue pulses at ultrasonicate bath in ice and maintained on ice for 1 min to overcome protein loss and overheating. Cell lysates were centrifuged 8000 x g for 10 min at 4ºC and supernatants were recovered.
For total protein quantification, Pierce Protein Assay kit (Thermo Scientific, MA, USA) was used. Initially,
a calibration curve was established with several standard BSA solutions from 0 to 1000 μg/mL (Thermo
Scientific, MA, USA) and the protein extracts were diluted in 1:10 proportion in ultrapure water (18.2
24 2.4.4.2 SDS-PAGE and transfer to nitrocellulose membrane
A SDS-PAGE gel was prepared, and ran at 120 V and 50 mA during 1 h. After the SDS-PAGE was complete, electrotransfer to a nitrocellulose membrane was performed. For that, a sandwich was prepared with the gel in contact with the membrane, between a pair of filter paper sheets and sponges. The wet transfer was set up, and the tin was filled with cold 1x transfer buffer (25 mM Tris, 192 mM Glycine, 20% (v/v) methanol, pH ~8.3) until the sandwich was fully covered. The transfer process occurred overnight at 40 V at 4ºC and, to finish the process, 1 h at 100 V.
2.4.4.3 Primary and secondary antibody incubation
The membrane was incubated for 1 h with fresh 5% non-fat milk in 1x TBST buffer (50 mM Tris, 150 mM NaCl and 0,1% (v/v) Tween 20, pH ~7.5) to block non-specific protein bidding. Then, each nitrocellulose membrane was exposed to different primary antibody in 5% non-fat milk in TBST, namely anti-Bax (1:5000; Abcam, United Kingdom), anti Bcl-2 (1:1000; Sigma, St. Louis, EUA) and anti-PARP (1:500; Thermo Scientific, MA, USA) and was left to incubate for 1 h at RT, with constant agitation. Concluded this incubation, the membrane was washed three times with 1x TBST buffer with agitation for 5 min at RT. The same procedure above was also employed to the membrane incubation with the secondary antibody (1:3000, Anti-mouse IgG, horseradish peroxidase (HPR)-linked Antibody or 1:2000, Anti-rabbit IgG, HPR-linked Antibody; Cell Signalling Technology, USA). All membranes were stripped with stripping buffer (0.1M glycine, 20 mM magnesium acetate and 50 mM potassium chloride) and, then, re-incubated with anti-ß actin (1:5000; Sigma, St. Louis, EUA) as a control for further normalization of the results.
To detect the protein bands on the membrane, a WesternBright ECL subtract (Advansta, USA) was prepared. ECL is an enhanced chemiluminescent substrate for detection of HRP activity from secondary antibodies. The membrane was then totally covered in substrate and incubated for 5 min. Sequentially, the film was exposed to the membrane, on a dark room. The quantification of proteins was determinate by densitometry using Image J software. BAX and BCL-2 data are from two independent experiments whereas PARP cleavage is from one assay.
2.4.5 Measurement of production of intracellular reactive oxygen species
25 three times with PBS 1x and stained with 100 mM of H2DCF-dA in a pre-warmed PBS 1x and incubated for 20 min at 37°C, protected from light. The unbound H2DCF-dA was removed by washing the cells three times with PBS 1x and, then, fixed with 4% (v/v) PFA and incubated at RT during 20 min. The fluorescence of DCF was visualized and images were captured using the fluorescence microscopy (Olympus BX51 fluorescent microscope). Mean fluorescence intensity (MFI), an index of the amount of ROS produced in A2780 cells, was analyzed by ImageJ software. Measurements were from two independent experiments.
2.4.6 Assessment to autophagic potential
The CYTO-ID® Autophagy Detection Kit (Enzo Life Sciences, UK) was used for the detection of autophagy in A2780 cells by fluorescence microscopy. Before seeding A2780 cells, the lamellae (VWR, Europe) were dipped in 70% (v/v) ethanol and dried, followed by PBS 1x wash. Cancer cell line were plated in lamellae in 24-well plates (VWR, Europe) at a density of 75.000 cells/well diluted in 500 μL of
fresh CCR medium. They were allowed to adhere for 24 h at 37°C in an incubator with 5% (v/v) CO2 and 99% (v/v) humidity atmosphere. After incubation, the culture medium was removed and cells were treated with the previously-determined IC50 concentration (8.5 μM) or 0.1% (v/v) DMSO as a negative control, and incubated at the same conditions described previously. After 12 h, an autophagy inductor i.e., rapamycin (50 mM), was added to the corresponding well. Following 48 h of incubation, the supernatant was removed and the cells were washed twice with 200 μL of PBS 10x supplemented with
5% (v/v) FBS and stained with an autophagy staining solution which consists of Hoechst 33342 (1 mg/L), Cyto-ID® Green (Enzo Life Sciences, USA) and PBS 10x supplemented. The staining solution was removed after 30 min of incubation at 37˚C in a humidified incubator and cells were washed again with 200 μL of PBS 10x supplemented three times. For the cells fixation to lamellae it was used 4% (v/v)
PFA, at RT in the absence of light for 20 min, followed by three times wash with 200 μL of PBS 10x
supplemented. Before microscope slide preparation with a droplet of glycerol, cells were washed with PBS 1X and then visualized and photographed in an Olympus BX51 fluorescent microscope with an attached Olympus DP50 (Olympus) camera. Photographs were acquired with Infarview software. The autophagic activity of AM130 was measure through counting the cells with autophagosomes or autophagolysosomes from two independent experiments.
2.5 Cell cycle Progression Assay

![Figure 3.1 - Synthesis of 5-bromo-2',4',5'-triphenyl-2',4'-dihydrospiro[indoline-3,3'-pyrazol]-2-one 5 (AM130) by 1,3- 1,3-dipolar cycloaddition reaction](https://thumb-eu.123doks.com/thumbv2/123dok_br/16679987.743121/53.892.126.767.568.879/figure-synthesis-triphenyl-dihydrospiro-indoline-pyrazol-cycloaddition-reaction.webp)


