Investment in Innovation and its Influence on Net Sales:
An Analysis Based on PINTEC Data
Tatielle Menolli Longhini †
Universidade Federal de Minas Gerais, Belo Horizonte, MG, Brazil Joyce Mariella Medeiros Cavalcanti Ω
Universidade Federal de Minas Gerais, Belo Horizonte, MG, Brazil Sergio Louro Borges ¥
Universidade Federal de Juiz de Fora, Juiz de Fora, MG, Brazil Bruno Pérez Ferreira *
Universidade Federal de Minas Gerais, Belo Horizonte, MG, Brazil
1. INTRODUCTION
In the contemporary context, innovation is an important driver of development, with different political, social and economic coverage levels. The incorporation of new technologies fosters new markets and productive chains, both for companies, sectors and/or nations. In this sense, the role of government, as the motivator of the innovation process, is fundamental, either through the financial and/or political incentives.
Given this line of reasoning, the great nations have responded to the recommendations of the Oslo Manual by investing in innovation. Brazil, for example, has adhered to a system of innovation performance measurement by means of the Technological Innovation Research (PINTEC) implementation at the end of the 90’s. In 2015, PINTEC data was published in 2000, 2003, 2005, 2008 and 2011.
In line with the Oslo Manual, PINTEC allows the comparability of results achieved with other countries (KANNEBLEY, DE NEGRI, 2008). Thus, also for these authors, the research developed by PINTEC is important, especially for explaining the innovative conditions of
This article has a Creative Commons License - Attribution 3.0 Not Adapted.
Corresponding author:
† Universidade Federal de Minas Gerais, Belo
Horizonte, MG, Brazil.
E-mail: tatielle.longhini@gmail.com
Ω Universidade Federal de Minas Gerais, Belo
Horizonte, MG, Brazil.
E-mail: joyce_mariella@yahoo.com.br
¥ Universidade Federal de Juiz de Fora, Juiz de
Fora, MG, Brazil.
E-mail: sergiolb@hotmail.com.br
* Universidade Federal de Minas Gerais, Belo Horizonte, MG, Brazil.
E-mail: brunoperez.bh@gmail.com
Received: 12/31/2015. Revised: 05/18/2016. Accepted: 06/23/2016. Published Online: 08/01/2017.
DOI: http://dx.doi.org/10.15728/bbr.2018.15.1.1 ABSTRACT
The aim of this research is to analyze the influence of innovation investments on net sales from major national sectors. The data was collected from the free access to the Technological Innovation Research (PINTEC) database. To proceed the analysis, we collected the PINTEC data from the years 2000, 2003, 2005, 2008 and 2011, consolidating them in a specific way. The analysis were developed through regressions of panel data with fixed effects, according to Hausman test, and the definition of large scale sectors was based on the median of net sales. The results suggest that, on average, for the large scale sectors the acquisition of machinery & equipment and industrial projects & other technical improvements are statistically relevant variables to increase the net sales.
Keywords: Innovation investment; Net sales; PINTEC; Large scale sectors.
BBR
15,1
2
Brazil by identifying the circumstances of the productive process, the strategies of the organizations as well as the destination of the investments. Consequently, those factors combined could pre-determine the process of innovation in the Brazilian context.
The monitoring of these factors allows the analysis of the innovation market in Brazil, as well as evaluating national and regional innovation policies. Therefore, PINTEC aims at the development of sectoral, regional and national indicators that foster the technological innovation presented by national industries. Thus, in order to analyze the influence of investment in innovation based on financial statement accounts, such as the net sales of companies and/or sectors, it can be important in the extent to which is possible to assess the link between investments in innovation and the sales obtained by domestic industries.
In particular for innovative activities, we note that economic sectors are developed in a heterogeneous way, and in considering this condition it allows us to better analyze our data and results. In this respect, Pavitt (1984) points out that the heterogeneity directly impacts the innovation activity, assuming, additionally, that there is a relation between the size of the companies (or sectors) and the capacity for innovation.
In light of the above, the aim of this paper is to analyze the relationship between net sales and investments in innovation of the major national sectors in Brazil, using a specific consolidation of the database provided by PINTEC for the years of 2000, 2003, 2005, 2008 and 2011. We collected free access data available on PINTEC website and our consolidation strategy is an innovative methodology in relation to the previous studies. Thus, one can consider as investments in innovation the expenditures related to: Acquisitions of machinery & equipment, internal R&D, external R&D, acquisition of software, acquisition of external knowledge, training, industrial projects and the insertion of technological innovations in the market (VIEIRA, 2008).
In addition to this introduction, this paper is organized as follows: 2) literature review; 3) methodology; 4) results and discussions; 5) robustness testing; and 6) conclusions.
2. LITERATURE REVIEW
2.1. INNOVATION
The New Economy is one of the denominations applied to the 21st Century due to a new form of value creation developed by companies, economic sectors and nations, such as intangible assets and, among them, innovation (LEV, 2001). In the literature, it is possible to find several definitions, however, in general, innovation is considered as a cumulative and dynamic knowledge system that leads to the transfer and diffusion of ideas, knowledge, learning and economic development through the flexibilization of the productive processes of diverse organizational areas (SCHUMPETER, 1934; LUNDVALL, 1992; LACERDA, 2001).
In view of the importance of the worldwide innovation movement, methodologies were developed so that the countries could adopt them in order to consolidate the guidelines for data collection and interpretation with the intention to compare these data. The possibility of developing and collecting even complex and differentiated data on innovation was presented in the first Oslo Manual of 1992 (OECD, 2005).
BBR
15,1
3
On these activities, there are some classifications and types of innovation that occur in different organizational environments. These characteristics can be divided into four types: (i) organizational: new organizational methods of business practice; (ii) of processes: new or significantly improved production or delivery method, including significant changes in techniques, equipment, technology and software; (iii) of product: new or significantly improved good or service by the characteristics and uses for which they are intended; (iv) of marketing: a method that implements the positioning, promotion, price and market place of the product (OECD, 2005).
Besides these, radical innovations are considered, consolidating deep ruptures, and incremental innovations that represent the continuity of the process of change by presenting improvements to the existing one (REIS, 2004; SCHUMPETER, 1934). The OECD (2005) reveals that, in terms of innovation, it is possible to differentiate the relevance of the innovation activities among the analyzed companies, consisting either of a significant change or a set of incremental changes, and may be classified as novelty for the company, for the market or for the world.
As a result, organizational structures, whether large or small, simple or complex, are determined to adapt to changes in technology and the environment (CASSIOLATO, LASTRES, 2000; LAM, 2005). Additionally, March and Sutton (1997) state that the act of innovating considers the strategic content of the business with which the objective is to enter new markets or to allow productive and competitive repositioning in its value chain.
2.2. INNOVATION IN COMPANIES AND SECTORS OF
DIFFERENT SIZES
Defining those who innovate more among small and large companies and sectors is the object of extensive empirical research. On the one hand, Arrow (1983) and Holmstrom (1989) state that polarizing innovation structures according to company size can create stereotypes, assigning activities that would be appropriate for small or large companies. On the other hand, Pavitt (1984), Bell and Pavitt (1993) and Rizzoni (1994) presented significant differences between heterogeneous sectors in order to generate innovation with specific patterns being established.
In this respect, Acs and Audretsch (1990) emphasize that both large and small companies adapt to the operating environment in order to drive the innovation process. These authors also revealed that there is an important participation of small and medium-sized companies for the development of innovations. According to Scherer (1980), there is a misguided focus on the ideal size of a company for the development of innovation.
In this sense, we consider that companies and economic sectors seek to develop and implement innovations, but the extent to which they develop them can vary according to their size. Based on the discussion about sector heterogeneity and innovation development, some taxonomies were developed as presented in Table 1.
BBR
15,1
4
Table 1. Approaches to the development of the innovation process for companies and sectors
Approach Information Authors
Industry Lifecycle
The different stages of the industry's life cycle impact on the innovation process. Small businesses have advantages in the early stages, while large
enterprises dominate subsequent stages.
Abernathy and Utterback (1978).
Neo-Schumpeterian
The big company is defined as the driver of technological development and innovation. This is because, in general, large companies have greater R&D investment capacity and greater accumulation of internal knowledge,
which directly influence technological performance.
Nelson and Winter (1982); Dosi (1988);
Pavitt (1990); Pavitt (1984); Rizzoni (1994).
Territorial
The innovation activity of certain companies is related to the geographical location, because it allows an extensive interrelation between the companies
that are there. It is assumed that small firms that are concentrated have superior competitive capacity, due to the possibility of adopting new information technology to address to the calls of variation in market needs.
Pavitt (1984); Rizzoni (1994).
Dynamic complement and division of innovation work of
small and large companies
Companies of different sizes complement the dynamics of the innovation process. Due to the gradual change of technological knowledge, innovative work, loses the peculiarity of a company and can be transferable between
organizations and sectors.
Rothwell (1989); Rizzoni (1994); Pavitt
(1984).
Network
The organizations with the greatest innovation capacities are not necessarily the larger ones, but rather those that develop relationships within the
company itself, sharing knowledge and information internally. Thus, competence and strategic direction are paramount, which is a directly organizational implication and provides new visions for the company.
Pavitt (1984); Rizzoni (1994).
Sectoral The difference between sectors contributes to the divergence of the innovation process between small and large companies.
Pavitt (1984); Nelson and Winter (1982); Dosi
(1988); Rizzoni (1994).
Source: Elaborated by the authors
Table 2. Taxonomy of innovation pattern of large firms.
Firms dominated by suppliers
Pattern of innovation identified in traditional sectors demonstrates diffusion of knowledge by learning and presents low appropriability.
Firms intensive in production
Ientified in scale production industries, the innovation pattern is due to process technologies with the contribution of suppliers and internal learning. The appropriability of technology is given by patents and
industrial secrets.
Equipment and instrument suppliers
To generate innovative products for use by other sectors, companies employ their own technology processes through the interaction of knowledge between users and producers. The appropriability of the technology
is local in nature.
Science-based firms
Scientific developments are accompanied by research from universities and research centers, and generally these are large companies whose main technological source is internal R&D. Such firms seek to diversify through conglomerates and the innovation pattern is highly appropriable through opportunities, patents, industrial secrets and learning curve. Importantly, even with the domain of large companies, smaller
companies have originated academic spin-off.
Source: Elaborated by the authors based on Pavitt (1984)
Based on the study proceeded by Pavitt (1984), Rizzoni (1994) developed an analysis of small innovation firms by separating them into six categories, as shown in Table 3.
BBR
15,1
5
2.3. EMPIRICAL EVIDENCE
The research about the relationship between innovation and performance has been investigated in several empirical studies. The complexity of the analysis is due to the difficulty of defining metrics for innovation and performance. In this respect, March and Sutton (1997) emphasize that the relevance of the study lies in the capacity of innovation to contribute for the growth of profitability of the companies. Furthermore, Cho and Pucik (2005) explained that innovation and growth have a direct link, while profitability is indirect and it is defined as a function of quality.
In addition to promoting technological developments, innovation also promotes productivity. Thus, companies with greater growth potentials demonstrate greater capacity for innovation (MOTOHASHI, 1998; MANSFIELD, 1962). In the Brazilian context, Andreassi (1999) analyzed the national sectors and did not identify as significant the relation between investment in R&D and profitability as well as the relation between patents and profitability, with both analyzes being conducted in subsequent periods. By contrast, when these authors analyzed at two-year intervals, the links were positive and significant statistically.
The promotion of innovation activities has diverse impacts among companies of different sizes. In addition, it should be noted that sector heterogeneity influences the technology and innovation process, and some studies have addressed to this matter, as it can be seen in Tables 1, 2 and 3.
In this respect, Syrneonidis (1996) carried out a theoretical review on the economic industry, and his results suggest that the variables related to innovation, firm size and market share have interference in economic performance and in market structure. In investigating the differences between small, medium and large companies, Vaona and Pianta (2008) identified performance idiosyncrasies regarding to the introduction and complementarity of processes and products, as well as for applied strategies to motivate innovation.
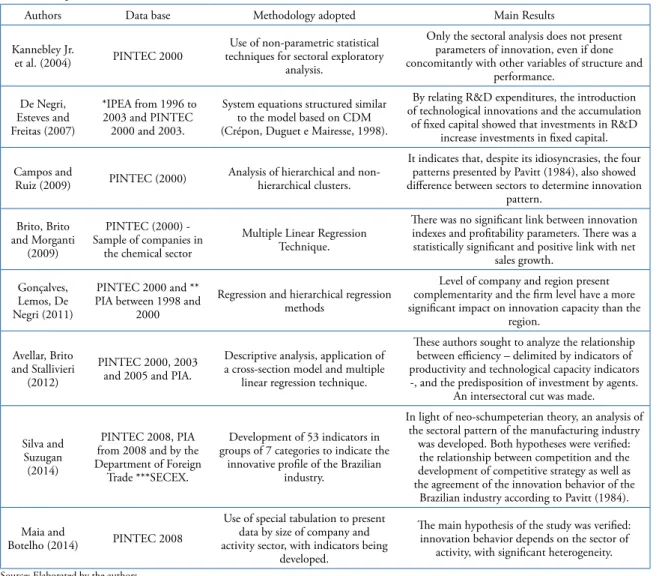
Therefore, the main counterpoints of the innovation process between units of different sizes were emphasized and some peculiarities were consolidated. Regarding the Brazilian context, there are empirical evidence focused on sector diversities and its consequences on companies of different sizes. Whilst these studies are incipient due to database limitations, one can cite that one of the best sources of information related to this topic is structured by PINTEC. In 2015, PINTEC database was available during the time window from 2000, 2003, 2005, 2008 and 2011. As seen in Table 4, the compilation of empirical studies are presented based on the Brazilian context, and the analysis focused on industry and sector levels.
Table 3. Innovation standard for small enterprises
Enterprises Definition
Static
These are not companies focused on innovation, as they survive only in traditional sectors. The technology in use is simple and there is the use of unqualified labor in the productive process. The company does not generate strategies, because it is based on intuitive actions for decision making where growth does not prevail. The capacity for innovation
is based on the acquisition of machinery & equipment. It aims at short-term survival, and usually involves family members in firm management.
Traditional
They are companies that belong to sectors with maturity and make non-intensive use of capital. They emphasize markets with demand for differentiation and discontinuity and, in terms of management, present structure close to the first classification. The technological evolution is determined by its suppliers, and the contact with the customer allows
the “learn by doing”. Generally, the introduction of innovations is given by the design proposition.
Dominated The production is destined to large companies since they are sectors with barriers for the entrance of products.
Imitative Due to the incipience of internal research, companies adopt imitation as a strategy to innovate and they are dependent on external technological advances and spillovers.
Based on
technology Acting in sectors with innovation opportunities and enabling fast growth.
Based on new technology
Companies that work at the frontier of innovation, providing technological evolutions for science and innovation. They are also characterized by the high technical-scientific capacity, dynamism with participative management and well-established organizational structure. Generally, they work in networks, they are located close to research centers and they are sensitive to technological evolution and scientific knowledge. They have similar characteristics to those firms
based in science by Pavitt (1984).
BBR
15,1
6
The analysis presented in Table 4 indicate an increase of the empirical investigation related to the evolution and the composition of innovation in Brazil. Based on such findings, it is possible to note an advance of these empirical evidences are twofold: 1) there are relations of innovation and productivity and 2) there are relation between innovative effort and productive investments. Alves and Luporini (2007), in turn, focused on the analysis of investment against the macroeconomic context and the sectorial characteristics.
2.4. TECHNOLOGICAL INNOVATION RESEARCH (PINTEC)
In order to collect data about innovation in the Brazilian context, we use the consolidated database provided by PINTEC, which is developed according to the concepts and methodologies described in the Oslo Manual, prepared by the OECD, and it is also in line with the model proposed by EUROSTAT - Statistical Office of the European Community (IBGE, 2013). This approach ensures two aspects: 1) the quality of information and comparability with international results; and 2) it enables the understanding of the procedure that generates, diffuses and incorporates technological innovations through the productive capacity (IBGE, 2013).
The research proceeded by PINTEC is carried out every three years for continuous updating of the information collected. By following the span of time between 2009 to 2011, Pintec 2011 gives continuity to the series started with Pintec 2000, which gathered
Table 4. Empirical evidence from national studies
Authors Data base Methodology adopted Main Results
Kannebley Jr.
et al. (2004) PINTEC 2000
Use of non-parametric statistical techniques for sectoral exploratory
analysis.
Only the sectoral analysis does not present parameters of innovation, even if done concomitantly with other variables of structure and
performance.
De Negri, Esteves and Freitas (2007)
*IPEA from 1996 to 2003 and PINTEC
2000 and 2003.
System equations structured similar to the model based on CDM (Crépon, Duguet e Mairesse, 1998).
By relating R&D expenditures, the introduction of technological innovations and the accumulation
of fixed capital showed that investments in R&D increase investments in fixed capital.
Campos and
Ruiz (2009) PINTEC (2000)
Analysis of hierarchical and non-hierarchical clusters.
It indicates that, despite its idiosyncrasies, the four patterns presented by Pavitt (1984), also showed difference between sectors to determine innovation
pattern.
Brito, Brito and Morganti
(2009)
PINTEC (2000) - Sample of companies in
the chemical sector
Multiple Linear Regression Technique.
There was no significant link between innovation indexes and profitability parameters. There was a statistically significant and positive link with net
sales growth.
Gonçalves, Lemos, De Negri (2011)
PINTEC 2000 and ** PIA between 1998 and
2000
Regression and hierarchical regression methods
Level of company and region present complementarity and the firm level have a more significant impact on innovation capacity than the
region.
Avellar, Brito and Stallivieri
(2012)
PINTEC 2000, 2003 and 2005 and PIA.
Descriptive analysis, application of a cross-section model and multiple
linear regression technique.
These authors sought to analyze the relationship between efficiency – delimited by indicators of productivity and technological capacity indicators -, and the predisposition of investment by agents.
An intersectoral cut was made.
Silva and Suzugan (2014)
PINTEC 2008, PIA from 2008 and by the Department of Foreign
Trade ***SECEX.
Development of 53 indicators in groups of 7 categories to indicate the
innovative profile of the Brazilian industry.
In light of neo-schumpeterian theory, an analysis of the sectoral pattern of the manufacturing industry
was developed. Both hypotheses were verified: the relationship between competition and the development of competitive strategy as well as the agreement of the innovation behavior of the
Brazilian industry according to Pavitt (1984).
Maia and
Botelho (2014) PINTEC 2008
Use of special tabulation to present data by size of company and activity sector, with indicators being
developed.
The main hypothesis of the study was verified: innovation behavior depends on the sector of
activity, with significant heterogeneity.
Source: Elaborated by the authors
BBR
15,1
7
information related to the triennium in 1998-2000, followed by Pintec 2003 (triennium 2001-2003), by Pintec 2005 (triennium 2003-2005), and by Pintec 2008 (triennium 2006-2008). Such research is made in partnership with the Brazilian Institute of Geography and Statistics (IBGE), which aims to develop indicators based on the sectors of the CNAE (National Classification of Economic Activities). Therefore, that study classify and stratify information by sector, which also allows the comparative analysis and the intrinsic changes over time (PINTEC, 2013). Through this data, information related to innovation activities expenses, sources of funding, impact of innovations on business performance, cooperative arrangements and difficulties in fostering innovation are available to the public (PINTEC, 2002; PINTEC, 2005; PINTEC, 2006; PINTEC, 2010; PINTEC, 2013).
The content of the aforementioned research is focused on product and innovation process in order to shed light on the data related to company activities, as well as the impacts and motivating factors for innovation (PINTEC, 2002; PINTEC, 2005; PINTEC, 2006; PINTEC, 2010; PINTEC, 2013). The definition of national investment patterns in innovation is fundamental to understanding their impact on the development of innovative practices in the industrial sector.
3. METHODOLOGY
The source of the database was the free access information of all the editions of PINTEC, i.e., years of 2000, 2003, 2005, 2008 and 2011. The data was extracted through the tables labeled as “Companies, total and net sales, with an indication of the amount of expenses related to the innovative activities developed, according to the selected industry and service activities – Brazil”, which are available on its website. The consolidation of this base was carried out by means of a specific tabulation developed for the present research (see Table 9 - Appendix 1).
Based on the information provided by PINTEC, the value of net sales was considered as a dependent variable, while the independent variables were investments in innovation, and its definitions are presented in Table 5.
It should be emphasized that during PINTEC editions in 2000 and 2003, investment in “Acquisition of Software” was included in “Acquisition of Other External Knowledge”, but it was analyzed in a unique way from PINTEC 2005 due to the evolution of software and hardware in the market and the importance of analyzing this aspect individually. Over the years, the data collected by the surveys have undergone changes, either by the inclusion of new metrics or by the adaptation of its denominations.
Thus, it was necessary to carry out an adjustment and homogenization of the database to proceed with the analysis. We identified the evolution of 23 classifications for the Manufacturing Industry sector in PINTEC 2000 to 25 in PINTEC 2011, also taking in consideration the sectors of Electricity and Gas & Services. In order to organize the adjustments in the database, the changes implemented are shown in Table 9 (Appendix 1).
Finally, in order to consolidate the entire database, the lines referring to the sum of the sectors were excluded, resulting in a total of 31 sectors analyzed over five periods: 2000, 2003, 2005, 2008 and 2011. Due to the discontinuity of some information, resulting from the consolidation criteria specific to the PINTEC database, which we adopted in this research, the data panel was unbalanced. In order to homogenize this information, the natural logarithm was applied to the nine analyzed variables that were previously collected in Brazilian Reais currency (BRL) (thousand). In order to proceed with the data analysis, regressions were estimated by panel data. The general notation, without tests and validations, is represented in equation 1.
(1)
( ) ( & ) ( & ) ( ) ( )
( & ) ( )
ln ln int ln ln ln
ln ln ln ln
NetRev R D R D ext AcqExt AcqSoft
M E Train Market Preptec
, , , , ,
, , , ,
i t i t i t i t i t
i t i t i t i t it
0 1 2 3 4
5 6 7 8
b b b b b
b b b b f
= + + + +
+ + + + +
-
BBR
15,1
8
Table 5. Explanatory variables of the model and its definitions according to PINTEC
Acronyms Definition
R&D (int)
Internal research and development activities - Expenses for the development of creativity, increase of knowledge and applications in technological advances. One can mention the steps of designing, constructing and testing prototypes and
pilot plants as examples. As long as there is technological and scientific advancement, the development of software as internal R & D is also included.
R&D (ext) External Acquisition of Research and Development - Corresponds to the value of services contracted for R&D developed by another organization, company or institution.
AcqExt
Acquisition of other external knowledge - Intended for technology transfer agreements - such as the acquisition of license rights for the exploitation of patents and the use of trademarks and know-how. Other forms of technical-scientific
knowledge are also considered, except for software acquisition.
AcqSoft
Software acquisition - Purchase of external software – designing, engineering, processing and transmission of data, voice, graphics, video, process automation, and others. That is, they are acquired for the conduction of new products or
processes or for technological improvement.
M&E Acquisition of machinery & equipment - Acquisition of machines, equipment and hardware for the implementation of processes or products or technologically improved.
Train
Training - Expenditure directly related to training for the development of new technology products or processes with significant improvements. Related to the company's innovation actions, such as the acquisition of specialized technical
external services.
Market Introduction of technological innovations in the market - Expenditure related to the launching of a technologically new or improved product, such as research activity and market and advertising test.
Preptec
Industrial design and other technical preparations - Expenditure on procedures and technical conditions for implementing product or process innovations - such as plans and drawings for redefinition of procedures, technical specifications and
operational characteristics.
Source: Elaborated by the authors based on Pintec (2002), Pintec (2005), Pintec (2006), Pintec (2010), and Pintec (2013)
Where: NetRev represents net sales; R&D_int are the internal activities of research and development; R&D_ext is the external acquisition of research and development; M&E is the acquisition of machinery & equipment; AcqExt is the acquisition of other external knowledge; Train is Training; Market refers to the introduction of technological innovations in the market; AcqSoft Software acquisition; Preptec are industrial projects and other technical preparations; β are the independent estimators of each variable; ε is the random error term; ln refers to the natural logarithm employed in the variables; and, lastly, the subscript i refers to sectors and the subscript t to the five periods under analysis.
The definition of large sectors was based on the net sales median. That is, when the median divides the distribution of the sample data into its half, we defined that above the median are the values referring to the denomination of large sectors, whereas below the median it was considered as the small sectors. The objective of this procedure is to capture the heterogeneities of the sectors. As a consequence of the restricted number of observations for the small-scale sectors, it was decided to emphasize the analysis and discussion of our results only in the large sectors.
4. RESULTS AND DISCUSSIONS
The descriptive statistics of the data are reported in Table 6. Such information is presented in level, that is, in Brazilian Reais BRL (thousand), in order to facilitate interpretation.
According to Table 6, we note that the values of the mean and the standard deviation of the analyzed variables can indicate data heterogeneity and, consequently, of the analyzed sectors. In addition, it is possible to identify that the number of observations present variations, showing a discontinuity of some information during the period covered.
BBR
15,1
9
Table 6. Descriptive Statistics
VARIABLES MEAN STANDARD DEVIATION MINIMUM MAXIMUM OBSERVATIONS
NetRev 5.54e+07 7.03e+07 165989.9 4.44e+08 124
R&D_int 436907.5 684109.6 8126.428 3378604 121
R&D_ext 63247.89 119701.8 125.2189 724575.4 114
M&E 725900.5 916940.6 1373.766 6712366 124
AcqExt 67368.88 114334.1 127.6079 728068.3 115
Train 28607.34 29663.25 130.6134 184106.3 123
Market 97525.92 144054.8 277.5694 745490.7 120
AcqSoft 83366.33 177109.5 2399.955 1021649 76
Preptec 157692.7 193166.7 502.5275 865932.1 120
Source: Elaborated by the authors based on research data. Values in Brazilian Reais (BRL) (thousand)
After the initial investigation of the descriptive statistics of the sample under analysis, three regressions were estimated, with each one of them being represented in panels A, B and C of Table 7. In Panel A, the Chow test rejected the null hypothesis for the pooled model, while the Hausman test rejected the null hypothesis of random effects. Therefore, the regression of panel data presents fixed effects. For simplicity, the fixed effects model was adopted for the other panels. At the end of Table 7, some footnotes related to assumptions tests were specified in order to validate our model.
In panel A, we note that all variables presented positive coefficients, except the variable training. However, only five were statistically significant: in addition to the constant, there are internal investments in R&D (lnR&D_int); Software acquisition (LnAcqSoft); acquisition of machinery & equipment (LnM&E) and; technical preparation and industrial projects (LnPrectec). These links indicate that, on average, a 1% increase in net sales implies an increase of about 13%, 11%, 41% and 15% in these variables, respectively. These results are consistent with the findings of Cho and Pucik (2005) if we consider that net sales could be considered as a proxy for growth.
This analysis, however, refers to the sectors analyzed jointly. For Pavitt (1984), Bell and Pavitt (1993) and Rizzoni (1994), there are sector heterogeneities that require specific analyzes. For this, we performed two more estimates, with panel B showing only the results found for sectors considered as large, whereas panel C presents a dummy that assumes the value of 1 when the net sales is equal to or higher than its median, and presents the value 0 otherwise. In short, the procedures adopted for panels B and C have the objective of verifying separately the relations found only for large sectors, reported in Panel B, as well as the relationships found among all sectors, emphasizing the large sectors, which are reported in Panel C.
According to the estimated values for panels B and C, some peculiarities were identified for the large sectors. Panel B presented consistent results for Panel A, except for software acquisition, which is not statistically significant. Furthermore, in Table 7 we observe that the number of observations for large sectors represents more than half of the observations analyzed for all the sectors together. This may indicate that, according to the classification adopted in the present research, the mean values of the general estimation tend to represent the large sectors.
BBR
15,1
10
Table 7. Results of estimates of the research
Variables
PANEL A - General PANEL B - Major Sector PAINEL C - Dummy
Coefficient Coefficient Coefficient
(Standard Error) (Standard Error) (Standard Error)
LnR&D_int 0.132** 0.199** 0.0880
(0.0636) (0.0926) (0.0601)
LnR&D_ext 0.0420 0.0946 0.0373
(0.0499) (0.0654) (0.0443)
LnAcqExt 0.0158 -0.0121 0.0224
(0.0517) (0.0448) (0.0445)
LnAcqSoft 0.115* -0.0286 0.111*
(0.0697) (0.0647) (0.0609)
LnM&E 0.410*** 0.579*** 0.298***
(0.0715) (0.0818) (0.0668)
LnTrain -0.0817 -0.0464 -0.0404
(0.0751) (0.0794) (0.0651)
LnMarket 0.0841 0.0106 0.0729
(0.0614) (0.0516) (0.0537)
LnPrepTec 0.151*** 0.111** 0.114**
(0.0543) (0.0527) (0.0472)
Constant 6.920*** 6.107*** 8.769***
(0.962) (0.957) (0.983)
D_large - - 0.536***
(0.134)
Observations 64 42 64
N of sectors 23 16 23
Pseudo R² 84.72% 82.7% 86.1%
Source: Elaborated by the authors based on the research data
Notes: The variables were calculated in natural logarithm. Asterisks *, ** and *** refer to significance levels of 10%, 5% and 1%. In panel A, the Wooldridge test identified autocorrelation, so that the correction required that the regression be estimated by GLS (generalized least squares), assuming that the error follows an AR(1). After this procedure, we did not identify issues related to heteroscedasticity through the likelihood test. The variance inflation factor (VIF) did not present multicollinearity. For simplification, we also adopted the GLS estimator and the AR (1) in panels B and C. In panel B, a regression is estimated only for sectors considered as large, where the analysis is developed from the median net sales. In panel C, the variable d_large is a dummy that is equal to 1 for values above the median of net sales and 0 otherwise. As a consequence of the discontinuity of the data in some sectors during the analyzed periods of the PINTEC, the number of observations and, consequently, of sectors were reduced in the estimations of the regressions
In this respect, we can observe that, for panels B and C, the large sectors have in common as investments in innovations, which vary positively with net sales, acquisitions of machinery & equipment and technical preparations and development of industrial projects. These results suggest that, for the large sectors, investments in fixed assets, such as machinery & equipment, and the development of technical knowledge, such as technical preparations and the development of industrial projects, are the main investments in innovation that contribute to increase sales. In revisiting the empirical evidence reported in Table 4, we observe that innovation patterns may vary according to the size and/or type of the industrial sector of performance, as an example of the findings found by De Negri, Esteves and Freitas (2007). In this sense, Campos and Ruiz (2009) explain that the way innovation develops is important for understanding the reality and characteristics of the Brazilian industrial sectors.
BBR
15,1
11
as the acquisition of machinery & equipment; and 2) creation of technical preparations and the development of industrial projects, which is required to hiring and, consequently, to remunerate trained staff. In analyzing panels A and B specifically, another investment in innovation that requires higher financial investment is internal research and development activities, i.e., internal R&D. Consequently, we observe that such expenditures require a greater financial contribution from the company, in which the latter, in turn, is captured in the present research by means of the median net sales.
5. ROBUSTNESS TESTING
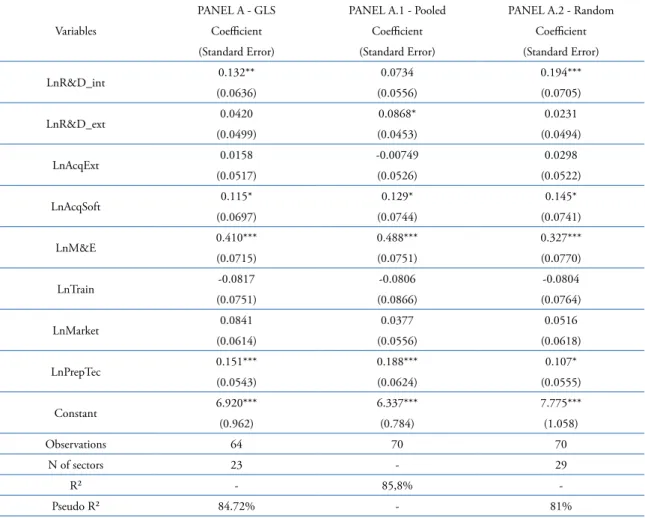
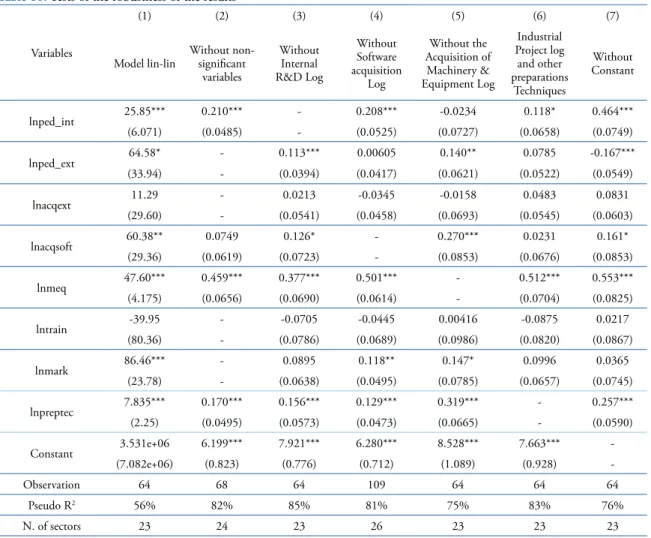
To verify the robustness of the results, two tables are presented: Table 8 and Table 10 (see appendix 2). In Table 8 we maintain the functional form and the set of explanatory variables of the main model (see Table 7), with only the type of model being modified, in which we estimate: 1) a regression by the main model itself (column 1 – Panel A), by OLS (pooled, column 2 – Panel A.1); and 2) a panel with Random Effect (column 3 – Panel A.2). In Table 10 we maintain the estimated model type (main-panel model for GLS with autocorrelation corrected), and both the functional form and the set of explanatory variables are modified.
Table 8. Robustness Tests
Variables
PANEL A - GLS PANEL A.1 - Pooled PANEL A.2 - Random
Coefficient Coefficient Coefficient
(Standard Error) (Standard Error) (Standard Error)
LnR&D_int 0.132** 0.0734 0.194***
(0.0636) (0.0556) (0.0705)
LnR&D_ext 0.0420 0.0868* 0.0231
(0.0499) (0.0453) (0.0494)
LnAcqExt 0.0158 -0.00749 0.0298
(0.0517) (0.0526) (0.0522)
LnAcqSoft 0.115* 0.129* 0.145*
(0.0697) (0.0744) (0.0741)
LnM&E 0.410*** 0.488*** 0.327***
(0.0715) (0.0751) (0.0770)
LnTrain -0.0817 -0.0806 -0.0804
(0.0751) (0.0866) (0.0764)
LnMarket 0.0841 0.0377 0.0516
(0.0614) (0.0556) (0.0618)
LnPrepTec 0.151*** 0.188*** 0.107*
(0.0543) (0.0624) (0.0555)
Constant 6.920*** 6.337*** 7.775***
(0.962) (0.784) (1.058)
Observations 64 70 70
N of sectors 23 - 29
R² - 85,8%
-Pseudo R² 84.72% - 81%
Source: Elaborated by the authors based on the research data.
BBR
15,1
12
As a way to verify the robustness of the results, Table 8 shows that the statistically significant variables in Panel A of Tables 7 and 8 remained statistically significant and positive after panel regression estimation by the pooled model and the random effects model. This demonstrates the robustness of the results. In Appendix 2, Table 10 presents other robustness procedures.
We observe, according to Table 10, strong evidence that the results discussed in this paper are robust and consistent. This is because, regardless of the functional form used and the variables omitted in the model, the variables lnped_int, lnacqsoft, lnmeq and lnpreptec are almost always statistically significant. It is also worth noting the importance of the variable related to industrial projects and other technical preparations (lnpreptec) and the acquisition of machinery & equipment (lnmeq), since it is statistically significant at 1% in all the estimated regressions, confirming the interpretations obtained by panels B and C of Table 7.
Thus, the results presented by Tables 8 and 10 indicate that the results do not change much, even modifying the type of model used, functional form and set of explanatory variables. In general terms, we still note strong evidence after the robustness testing.
6. CONCLUSIONS
The objective of this paper is to analyze the influence of investments in innovation in the net sales of the national large sectors based on the information freely available by PINTEC for the years 2000, 2003, 2005, 2008 and 2011. The data consolidation took place in a specific way and the method used to analyze them was panel data with fixed effects through the GLS estimator, as pointed out by the Hausman test and the violation of the assumption of absence of autocorrelation in the residues. The definition of large and small sectors was based on the median net sales.
The motivation to focus on large national sectors was based on the literature review. For Pavitt (1984), Bell and Pavitt (1993) and Rizzoni (1994), economic sectors present significant differences, demonstrating that they are heterogeneous with respect to the development of innovation and its impact on corporate and economic results.
In this sense, the results estimated in our research suggest that the major sectors present idiosyncrasies. In general, the investments in innovation that positively influence the net sales of these sectors have been the acquisitions of machinery & equipment, as well as technical preparations and development of industrial projects. Thus, these characteristics demonstrate that the large scale sectors tend to invest in tangible assets, such as machinery & equipment, as well as investing in the creation of technical preparations and the development of industrial projects. These two characteristics present in common the need for greater financial contribution for investment.
The main limitations of this research are the availability of data, which restricted the analysis, as well as the way in which it was consolidated and the definition of large scale sectors. For future research, we suggest expanding the database and the application of new methodologies can lead to improved results.
7. REFERENCES
ABERNATHY W. J.; UTTERBACK J.M. Patterns of industrial innovation. Technology Review, v. 80, n. 7, p. 40-47, 1978.
ACS, Z.; AUDRETSCH, D. Innovation and small firms. Cambridge: MIT Press, 1990.
ALVES, J.; LUPORINI, V. Determinantes do investimento privado no Brasil: uma análise de painel setorial. In: ENCONTRO NACIONAL DE ECONOMIA, 35, Anpec, Recife, 2007. Anais... Recife: ANPEC, 2007. ANDREASSI, T. Estudo das relações entre indicadores de P&D e indicadores de resultado empresarial em
BBR
15,1
13
ARROW, K. J. Innovation in Large and Small Firms. In: RONEN, J. (ed.), Entrepreneurship, Lexington Books: Toronto, 1983.
AVELLAR, A. P.; BRITO, J.; STALLIVIERI, F. Capacitação inovativa, investimento e produtividade na
indústria brasileira: evidências da diversidade intersetorial. Economia e Sociedade, Campinas, v. 21, n. 2, p.301-343, 2012.
BELL, M.; PAVITT, K. Technological accumulation and industrial growth: contrasts between developed and developing countries. Industrial and Corporate Change, v. 2, n. 1, p. 157-210, 1993.
BRITO, E. P. Z.; BRITO, L. A. L.; MORGANTI, F. Inovação e o desempenho empresarial: lucro ou crescimento? RAE-eletrônica, v. 8, n. 1, p. 1-25, 2009.
CAMPOS, B.; RUIZ, A. U. Padrões setoriais de inovação na indústria brasileira. Revista Brasileira de
Inovação, v. 8, n. 1, p. 167-210, 2009.
CASSIOLATO, J. E.; LASTRES, M. H. M. Sistemas de inovação: políticas e perspectivas. In: Carlos
Henrique Cardim (editor). Parcerias Estratégicas, 1ed, Brasília, Ministério da Ciência e Tecnologia- Centro de Estudos Estratégicos: 2000, p. 237-255.
CHO, H.J.; PUCIK, V. Relationship between innovativeness, quality, growth, profitability, and market value. Strategic Management Journal, v. 26, n. 6, p. 555-575, 2005.
CRÉPON B.; DUGUET E.; MAIRESSE J. Research, innovation and productivity: an econometric analysis at the firmlevel. Economics of innovation and new technology,v. 7, n. 2, p. 115-158, 1998.
DE NEGRI, L. A.; ESTEVES, L.; FREITAS, F. Knowledge production and firm growth in Brazil. WP, IPEA, 21p., 2007.
DOSI, G. Sources, procedures, and microeconomic effects of innovation. Journal of Economic Literature, v. 26, n. 3, p. 1120-1171, 1988.
GONÇALVES, E.; LEMOS, M. B.; DE NEGRI, J. A. The role of firm and territory in innovative activities in
brazilian post-opening economy. Economia Aplicada, v. 15, n. 1, p. 103-130, 2011.
HOLMSTROM B., Agency Costs and Innovation. Journal of Economic Behavior and Organization, v. 12, n. 3, p.305-327, 1989.
IBGE - INSTITUTO BRASILEIRO DE GEOGRAFIA E ESTATÍSTICA. Pesquisa Industrial de Inovação Tecnológica. Rio de Janeiro: IBGE, 2013.
KANNEBLEY JÚNIOR, S.; PORTO, G. S.; PAZELLO, E. T. Inovação na indústria brasileira: uma análise exploratória a partir da Pintec. Revista Brasileira de Inovação, v. 3, n. 1, p. 87-128, 2004.
KANNEBLEY JÚNIOR, S.; DE NEGRI, J.A. Atividade inovativa na América Latina: uma comparação entre indústrias de baixa e alta intensidade tecnológica. Texto para discussão n.05. FEARP: Série Economia,
2008.
LACERDA, A. C. et al. Tecnologia: estratégia para a competitividade. São Paulo: Nobel, 2001. LAM, A. Organizational Innovation. Oxford: Oxford University Press, 2005.
LEV, B. Intangibles: Management, Measurement and Reporting. Washington, DC: Brookings Institution
Press, 2001.
LUNDVALL, B. National Systems of Innovation: Towards a Theory of Innovation and Interactive Learning.
London: Pinter Publishers, 1992.
MAIA, A. F. S.; BOTELHO, M. R. A. Diferenças setoriais da atividade inovativa das pequenas empresas industriais brasileiras. Revista Brasileira de Inovação, Campinas, v.13, n.2, p. 371-404, 2014.
MANSFIELD, E. Entry, Gibrat’s law, innovation, and the growth of firms. American Economic Review, v. 52, n. 5, p. 1023-1051, 1962.
MARCH, J. G.; SUTTON, R. I. Organizational performance as a dependent variable. Organization Science, v. 8, n. 6, p. 698-706, 1997.
MOTOHASHI, K. Innovation strategy and business performance of Japanese manufacturing firms. Economics of Innovation and New Technology, v. 7, n. 1, p. 27-52, 1998.
NELSON R.R.; WINTER S.G. An evolutionary theory of economic change. The Belknap of Harvard University Press: Cambridge Mass, 1982.
OCDE - Organização para a Cooperação e Desenvolvimento Econômico. Manual de Oslo: Proposta de Diretrizes para Coleta e Interpretação de Dados sobre Inovação Tecnológica. 3.ed. Paris: OCDE, 2005. PAVITT, K. Some foundations for a theory of the large innovating firms. Brighton: Science Policy Research
Unit, 1990.
BBR
15,1
14
PINTEC. Pesquisa Industrial Inovação Tecnológica 2000. Instituto Brasileiro de Geografia e Estatística -IBGE, Rio de Janeiro, 2002. Disponível em: <http://www.pintec.ibge.gov.br/downloads/PUBLICACAO/ Publicacao%20PINTEC%202000.pdf>. Acesso em: 11 nov. 2015.
______. 2003. Instituto Brasileiro de Geografia e Estatística - IBGE, Rio de Janeiro, 2005. Disponível em:
<http://www.pintec.ibge.gov.br/downloads/PUBLICACAO/Publicacao%20PINTEC%202003.pdf> .
Acesso em: 11 nov. 2015.
______. 2005. Instituto Brasileiro de Geografia e Estatística - IBGE, Rio de Janeiro, 2006. Disponível em: <http://www.pintec.ibge.gov.br/downloads/PUBLICACAO/Publicacao%20PINTEC%202005.pdf>.
Acesso em: 11 nov. 2015.
______. 2008. Instituto Brasileiro de Geografia e Estatística - IBGE, Rio de Janeiro, 2010. Disponível em: <http://www.pintec.ibge.gov.br/downloads/PUBLICACAO/Publicacao%20PINTEC%202008.pdf>.
Acesso em: 11 nov. 2015.
______. 2011. Instituto Brasileiro de Geografia e Estatística - IBGE, Rio de Janeiro, 2013. Disponível em: <http://www.pintec.ibge.gov.br/downloads/pintec2011%20publicacao%20completa.pdf>. Acesso em: 11
nov. 2015.
REIS, D. R. Gestão da inovação tecnológica. Barueri: Manole, 2004.
RIZZONI, A. Technology and organisation in small firms: an interpretative framework. Revue D’Économie Industriell, n. 67, p. 135-155, 1994.
ROTHWELL, R. Small firms, innovation and industrial change. Small Business Economics, v. 1, n. 1, p. 51-64, 1989.
SCHERER F. M. Industrial market structure and economic performance. Chicago: Rand McNally, 2.ed, 1980. SBRAGIA, R.; KRUGLIANSKAS, I.; ARANGO-ALZATE, T. Empresas inovadoras no Brasil: uma
proposição de tipologia e características associadas. FEA/USP: Série Working Papers, n.1/3, 2002. SCHUMPETER, J. The Theory of Economic Development. Cambridge, Massachusetts: Harvard University
Press, 1934.
SILVA, C. F.; SUZIGAN, W. Padrões Setoriais de Inovação da Indústria de Transformação Brasileira.Estud.
Econ., São Paulo, v. 44, n.2, p.277-321, 2014.
SYRNEONIDIS, G. Innovation, firm size and market structure: schumpeterlan hypotheses and some new
themes.OECDEconomic Studies, v. 2, n. 27, p. 35-70, 1996.
VAONA, A.; PIANTA, M. Firm Size and Innovation in European Manufacturing. Small Business Economics,
v. 30, n. 3, p.283–299, 2008.
BBR
15,1
15
APPENDIX 1
Table 9. Homogenization of the database for Pintec 2000 up to Pintec 2011
Classifications Pintec 2000 Pintec 2003 Pintec 2005 Pintec 2008 Pintec 2011
Extractive
Industry (x) (x) (x) (x) (x)
Manufacturing Industry
Synthesizing account “FMVARC” with summing of accounts “FACUCO”,
“FCCRRM” and “FPAV”.
Name change from “Metallurgy” to “Basic Metallurgy”
Name change from "FMEEI" to "FEIPEO".
The classifications were not considered "FMEAEC", "FMID”,
“R”, “FPD” and “MRIME”.
Inserted cell "FPAB" with summing of accounts “FPA” and
“FB”.
Synthesizing account “FMID” with summing of accounts “FAM” and “FPD”.
Synthesizing account “FEIPEO” with summing of accounts “FCE”, “FEIP”, “FEC”
and “FOPEO”.
Synthesizing account “FEIPEO” with summing of accounts “FCE”,
“FEIP”, “FEC”, “FAEEEI” and “FOPEO”.
Ratings were not considered “FPD” and “MRIME”.
Synthesizing account “FMAME” with summing of accounts “FGTEDEE”, “FE” and “FPLOAE”.
Synthesizing account “FME” with summing of accounts “MBCET”, “MEA”, “MEC” e “OME”.
Synthesizing account “FACUCO” with summing of accounts “FCCRRM” and “FPAV”.
Synthesizing account “FPD” with summing of accounts “FIMUMOAO” and “OPD”.
There are no accounts “FMEAEC”, “FMID” and “R”.
Electricity and
Gas (-) (-) (-) (-) Sector considered
Services (-) (-)
Composed of ratings “T”, “AISR”, “R&D”.
Classifications considered: “T - Telecommunications”,
“ASTI”, “R&D”, “EGEM”, “TDHIOAR”.
Classifications considered: “T ”, “ASTI”, “P&D”, “EGEM”, “TDHIOAR” and "SAETAT".
Synthesizing account “AISRI” with summing of account
“SC - Software Consulting”,
“OAISR”.
Synthesizing account “ASTI” with summing
of accounts “DLPC” and “OSTI”.
Synthesizing account “ASTI” with summing of accounts “DSE”, “DSC”, “DSñC” and “OSTI”
Source: Elaborated by the authors based on Pintec (2002), Pintec (2005), Pintec (2006), Pintec (2010), and Pintec (2013).
BBR
15,1
16
APPENDIX 2
Two sets of robustness tests were performed, in which the first one makes a change in the functional form of the regression, and in the second group the set of explanatory variables is changed. The result of the first robustness test group is reported in column (1) of Table 4, while the second group is represented by columns from (2) to (7) of the referred table. The difference between columns (2) and (7) are the variables omitted from the model: column (2) omits all non-significant variables (R&D external to company – lnped_ext, acquisition of other external knowledge – lnarext, Training - lntrain, and Market – lnmark). The columns from (3) to (4) omit statistically significant variables to the model, such as R&D internal to the company – lnped_int (column 3), Software acquisition - lnacqsoft (column 4), Acquisition of machinery & equipment - lnmeq (column 5), Industrial projects and other technical preparations – lnpreptec (column 6) and, finally, the constant of the model (column 7).
Table 10. Tests of the robustness of the results
Variables
(1) (2) (3) (4) (5) (6) (7)
Model lin-lin
Without non-significant
variables
Without Internal R&D Log
Without Software acquisition
Log
Without the Acquisition of Machinery & Equipment Log
Industrial Project log and other preparations
Techniques
Without Constant
lnped_int 25.85*** 0.210*** - 0.208*** -0.0234 0.118* 0.464***
(6.071) (0.0485) - (0.0525) (0.0727) (0.0658) (0.0749)
lnped_ext 64.58* - 0.113*** 0.00605 0.140** 0.0785 -0.167***
(33.94) - (0.0394) (0.0417) (0.0621) (0.0522) (0.0549)
lnacqext 11.29 - 0.0213 -0.0345 -0.0158 0.0483 0.0831
(29.60) - (0.0541) (0.0458) (0.0693) (0.0545) (0.0603)
lnacqsoft 60.38** 0.0749 0.126* - 0.270*** 0.0231 0.161*
(29.36) (0.0619) (0.0723) - (0.0853) (0.0676) (0.0853)
lnmeq 47.60*** 0.459*** 0.377*** 0.501*** - 0.512*** 0.553***
(4.175) (0.0656) (0.0690) (0.0614) - (0.0704) (0.0825)
lntrain -39.95 - -0.0705 -0.0445 0.00416 -0.0875 0.0217
(80.36) - (0.0786) (0.0689) (0.0986) (0.0820) (0.0867)
lnmark 86.46*** - 0.0895 0.118** 0.147* 0.0996 0.0365
(23.78) - (0.0638) (0.0495) (0.0785) (0.0657) (0.0745)
lnpreptec 7.835*** 0.170*** 0.156*** 0.129*** 0.319*** - 0.257***
(2.25) (0.0495) (0.0573) (0.0473) (0.0665) - (0.0590)
Constant 3.531e+06 6.199*** 7.921*** 6.280*** 8.528*** 7.663***
-(7.082e+06) (0.823) (0.776) (0.712) (1.089) (0.928)
-Observation 64 68 64 109 64 64 64
Pseudo R2 56% 82% 85% 81% 75% 83% 76%
N. of sectors 23 24 23 26 23 23 23
Source: Elaborated by the authors based on research data