The fiscal management of the state of Rio de Janeiro: An
analysis in light of the fiscal responsibility law and debt
sustainability in the period from 2001 to 2017
Alethéia Ferreira da Cruz1 Bruno Lobão Lopes2 Daiana Paula Pimenta1 Gustavo Fernandes Soares2
1 Universidade Federal de Goiás / Programa de Mestrado Profissional em Administração Pública e Programa de Pós-Graduação
em Ciências Contábeis, Goiânia / Goiás — Brazil
2 Universidade Federal de Goiás / Programa de Mestrado Profissional em Administração Pública, Goiânia / Goiás — Brazil
The aim of this research is to verify the role of the fiscal responsibility law (FRL) in the dynamics of the fiscal management of Rio de Janeiro, and in the sustainability of the state’s public debt in the period from 2001 to 2017. It was observed that Legislation limits were extrapolated, and concomitantly, the decrease in GDP, the rise in interest rates and the continuous primary deficits from 2012, triggered a serious mismatch of public accounts. It is concluded that, although the FRL played a disciplinary role in the management of the state of Rio de Janeiro’s finances until mid-2012, the legislation did not limit the mismanagement of resources and was not enough to avoid the fiscal unsustainability installed in the state from 2014.
Keywords: Rio de Janeiro; fiscal responsibility law; tax management.
A gestão fiscal do estado do Rio de Janeiro: uma análise à luz da LRF e da sustentabilidade da dívida no período de 2001 a 2017
O objetivo desta pesquisa é verificar o papel da LRF na dinâmica da gestão fiscal do Rio de Janeiro e na sustentabi-lidade da dívida pública estadual no período de 2001 a 2017. Observou-se que os limites permitidos pela legislação foram extrapolados, e, de forma concomitante, o decréscimo do PIB, a elevação das taxas de juros e os contínuos déficits primários a partir de 2012 desencadearam um grave descompasso das contas públicas. Conclui-se que, embora a LRF tenha desempenhado um papel disciplinador na gestão das finanças do estado do Rio de Janeiro até meados de 2012, a legislação não limitou a má gestão dos recursos e não foi suficiente para evitar a insusten-tabilidade fiscal instalada no estado a partir de 2014.
Palavras-chave: Rio de Janeiro; Lei de Responsabilidade Fiscal; gestão fiscal.
La gestión fiscal del estado de Rio de Janeiro: un análisis a la luz de la LRF y la sostenibilidad de la deuda 2001-2017
El objetivo de esta investigación es verificar el papel de la LRF en la dinámica de la gestión fiscal de Río de Janeiro y en la sostenibilidad de la deuda pública estadual en el período de 2001 a 2017. Se observó que los límites permitidos por la legislación fueron extrapolados y, de forma concomitante, el descenso del PIB, la elevación de las tasas de interés y los continuos déficit primarios a partir de 2012 desencadenaron un grave desajuste de las cuentas públicas. Se concluye que, aunque la LRF desempeñó un papel disciplinario en la gestión de las finanzas del estado de Río de Janeiro hasta mediados de 2012, la legislación no limitó la mala gestión de los recursos y no fue suficiente para evitar la insostenibilidad fiscal instalada en el estado a partir de 2014.
Palabras clave: Rio de Janeiro; Ley de Responsabilidad Fiscal; gestión fiscal.
DOI: http://dx.doi.org/10.1590/0034-7612174116
Article received on January 4, 2017 and accepted on April 27, 2018.
1. INTRODUCTION
Public debt is the main instrument, alongside taxes, for financing state government spending. In a virtuous cycle, public debt promotes development, increases revenue collecting capacity, and diminishes the importance of intertemporal restrictions that managers sometimes face (Mora, 2016).
In this context, the development of principles and norms for the fiscal management of public finances plays an important role in controlling public spending and keeping public debt on a sustainable trajectory. In order to monitor public debt in Brazilian states, distinct pieces of legislation have been created and implemented, but part of this legislation has erred in proposed restructuring and fiscal adjustments without eliminating the sources of financial instability in public administration.
The Fiscal Responsibility Law (FRL) — Complementary Law No 101/2000 — emerged as a
mechanism for more rigorous planning and control, and includes expected limits and penalties, designed to preserve the fiscal situation that exists between subnational entities, safeguard financial health through the correct application of public resources, and provide future public managers with an inheritance of sustainable administration (Nascimento and Debus, 2002).
Even though the FRL played a crucial role in decreasing the debt of these states during the first decade of this century, a reduction in the growth of net revenues and the continuing growth of current expenses, associated with growing state debt and the fiscal weakening of the FRL, have resulted in a worsening of the fiscal crisis in many federal entities, especially the state of Rio de Janeiro (SRJ) (Mora, 2016).
In order to achieve the fundamental aims of the FRL and reach acceptable levels of personnel and retirement expenses and debt, the SRJ has adopted unpopular austerity measures, such as increasing taxes, laying off commissioned staff and civil servants, requiring larger retirement contributions for civil servants, changing the rules for retirees and pensioners, and ending social assistance programs such as low income restaurants.
However, the government of the SRJ has made continuous requests to renegotiate its debt with the federal government, and has exceeded the public spending limits permitted by the FRL without the associated revenues, exposing the SRJ to an unsustainable fiscal situation (Mora, 2016; Caldeira et al., 2016; Santos, 2015).
In this regard, this article seeks to answer: what is the role of the FRL in the dynamics of fiscal management and the sustainability of public debt in the SRJ? Thus, the overall goal of this study is to verify the role of the FRL within the dynamics of fiscal management in the SRJ and the sustainability of state public debt during the period from 2001 to 2017.
2. LIMITS IMPOSED BY THE FISCAL RESPONSIBILITY LAW AND THE SUSTAINABILITY OF PUBLIC DEBT
Various institutional frameworks support the legal apparatus that accompanies and controls state public finances. In terms of underlying legal principles, the Federal Constitution of 1988 determines the general principles and parameters of the construction of the legal regime that applies to state debt (Mora, 2016). Law No 9,496/1997, which deals with the renegotiation of state debt, seeks to support
fiscal restructuring and adjustments for the states (Caldeira et al., 2016).
The FRL, created by Complementary Law No 101/2000, reinforces the fiscal environment
instituted by Law No 9,496/1997, which covers the concepts of consolidated debt, real estate debts,
credit operations, the concession of guarantees and the refinancing of real estate debt (Santos, 2015). The Senate resolutions, especially Resolutions No 40/2001 which governs global limits for state
public consolidated and real estate debts, and No 43/2001 which normalizes the limits of internal
and external state credit operations, complementing the legal guidelines for the fiscal management of Brazilian states (Mora, 2016).
Among the pieces of legislation applied to Brazilian states, the FRL is considered to be a fundamental piece of this institutional framework, given that it seeks to guarantee the intertemporal equilibrium of public finances, the transparency of fiscal management and the establishment of rules in the state public debt process (Mora, 2016).
The FRL stipulates that the evaluation of the performance of public managers be performed using the ratio between Personnel Expenses and Net Revenues and the ratio between the Consolidated Net Debt and Net Revenues, based on predetermined limits (Dalmonech, Teixeira and Sant’Anna, 2011).
Net revenues, which corresponds to total current revenue minus the federal entity’s legal deductions, is used as the denominator in these ratios to try to translate the effective capacity of the government entity’s revenue collection and eliminate the double counting of transactions between public entities within the same government (Toledo Júnior, 2012).
The FRL also pays special attention to personnel expenses, mandating that the payroll cannot exceed 60% of net revenues. In this way, if some state surpasses limits that are predetermined to be prudent, the State Accounting Tribunal (SAT) will emit alerts and can implement spending limits according to Article 22 of the law (Brazil, 2000).
In terms of public debt, the FRL establishes the parameters for controlling debt, credit operations, concessions of guarantees, and the financing of real estate debt. In addition to stipulating these limits, the FRL reinforces the relevance of the primary balance and maintaining public debt at sustainable levels (Lima, Sampaio and Gaglianone, 2008; Borges et al.,2013).
These challenges have led to various studies about the potential inconsistency between the debt control and fiscal sustainability mechanisms, which are based only on net revenues, precisely because it is impossible to forecast them in state governments (Sodré, 2002). In addition, there has been an increase in debt in foreign currency associated with a new cycle of debt due to the Subprime crisis that began in 2008 (Pessoa and Santos, 2016; Mora, 2016; Fontenele, 2015).
Even though the mechanisms proposed by the FRL are oriented towards obtaining primary surpluses, intertemporal budgetary consistency also depends on other macroeconomic factors, such as the GDP, interest rates and inflation, and the behavior of these factors is characterized by volatility and uncertainty (Forslund et al., 2011). This, in turn, makes the construction of forecasts that anticipate the behavior of net revenues, within a scenario of foreign exchange risk and foreign currency debt, more difficult, and does not guarantee that an evaluation of these possibilities will be sufficient to establish the desired Debt/GDP ratio (Pessoa and Santos, 2016; Sodré, 2002).
3. METHODOLOGY
To achieve this study’s objectives, we will use a quantitative approach based on an analysis of the SRJ’s budgetary reports, which are available through the state transparency portal, the information published on the State Center for Statistics, Research and the Education of Civil Servants (Ceperj) website, and the macroeconomic indicators and state debt figures that appear on the website of the Brazilian Central Bank (Bacen).
After the data collection, we constructed indicators in tables and graphs for horizontal and vertical analyses of government expenses, debt indices (CND/NR), personnel expenses (PE/NR) and debt sustainability (CND/GDP) from the point of view of the FRL parameters, comparing the values encountered with the primary balance, GDP growth, interest rates and debt servicing for the SRJ from 2001 to 2017.
4. RESULTS AND ANALYSES
In this section, the data will be presented and analyzed in terms of the FRL in order to identify the role of this law in the fiscal management and sustainability of the SRJ from 2001 to 2017.
4.1 NET REVENUES, GDP AND PERSONNEL EXPENSES
The FRL emphasizes that government revenues are essential requisites for the fiscal management of public entities, and in Article 13 it prescribes the measurements adopted for the revenue collection of all of the taxes established by the subnational government (Brazil, 2000).
In the same manner, the imposition of a limit of 60% of net revenues for personnel spending is an important pillar of the FRL, given that it signals the manager that the public sector has to maintain the resources that are essential to its functioning as well as meet the demands of social investments in the present as well as the future.
and state taxes on the Fifa World Cup and the 2016 Olympic Games, and a new decrease in revenues took place from 2014 to 2017 (a decrease of 2.2% in 2013-2014 and 9.8% in 2015-2016) due to the country’s economic and political crisis.
TABLE 1 TOTAL AND NET REVENUES, GDP, TOTAL AND PERSONNEL EXPENSES, THE NR/GDP INDEX,
AND THE PE/NR RATIO OF THE STATE OF RIO DE JANEIRO FROM 2001 TO 2017
Year TR NR %NR* GDP %GDP*
NR/
GDP TE PE % PE PE/TE
PE/ NR
2001 17,757,911 13,608,848 – 148,033,000 – 9.2% 17,923,786 5,994,650 – 33.4% 44.0%
2002 19,166,412 15,100,326 11.0% 184,311,000 24.5% 8.2% 20,360,535 7,039,997 17.4% 39.3% 46.6%
2003 24,428,243 19,168,781 26.9% 202,641,000 9.9% 9.5% 24,366,464 9,375,603 33.2% 46.0% 48.9%
2004 27,647,996 21,009,274 9.6% 241,207,000 19.0% 8.7% 27,502,839 8,735,130 -6.8% 35.8% 41.6%
2005 30,274,363 23,094,091 9.9% 269,830,061 11.9% 8.6% 30,209,983 9,772,335 11.9% 35.5% 42.3%
2006 34,196,364 26,132,742 13.2% 299,738,183 11.1% 8.7% 34,088,412 9,731,293 -0.4% 32.2% 37.2%
2007 36,429,692 26,849,822 2.7% 323,698,286 8.0% 8.3% 35,648,437 9,766,904 0.4% 28.7% 36.4%
2008 42,950,931 31,830,883 18.6% 378,285,800 16.9% 8.4% 40,802,306 10,449,628 7.0% 29.3% 32.8%
2009 43,497,939 28,976,688 -9.0% 391,650,854 3.5% 7.4% 45,615,831 10,839,234 3.7% 26.6% 37.4%
2010 50,814,141 34,534,906 19.2% 449,858,101 14.9% 7.7% 51,002,384 12,510,136 15.4% 27.4% 36.2%
2011 57,454,091 39,268,345 13.7% 512,767,905 14.0% 7.7% 56,553,049 13,867,242 10.8% 27.2% 35.3%
2012 63,590,465 40,613,415 3.4% 574,884,973 12.1% 7.1% 63,819,247 15,847,965 14.3% 28.0% 39.0%
2013 71,192,474 47,064,197 15.9% 628,226,069 9.3% 7.5% 71,663,151 18,063,168 14.0% 28.3% 38.4%
2014 75,790,988 46,045,518 -2.2% 671,076,844 6.8% 6.9% 75,704,295 19,936,477 10.4% 27.8% 43.3%
2015 61,654,166 51,224,317 11.2% 659,137,000 -1.8% 7.8% 65,978,035 22,098,512 10.8% 29.2% 43.1%
2016 50,685,309 46,228,984 -9.8% 638,095,000 -3.2% 7.2% 60,832,044 33,426,454 51.3% 50.7% 72.3%
2017 62,274,062 50,194,045 8.6% 623,856,000 -2.2% 8.0% 67,965,549 33,637,141 0.6% 55.3% 67.0%
Source: Elaborated by the authors based on data from the Rio de Janeiro transparency portal, Ceperj and Bacen (2017). Nominal values. Legend:
* Calculated variation between the current year and the previous year ** Values in R$ 1,000.00
The NR represents, on average, 8% of state GDP per year. The periods of growth and deceleration of NR coincided with the behavior of state GDP, signaling the difficulty that federal entities experience in forecasting revenues during times of economic recession.
Even though there was difficulty in constructing adequate expectations of NR given the uncertainties of state GDP, the FRL established that the execution of these programmed expenses should be consistent with the revenues collected and that the insertion of any increase in expenses be accompanied by its budgetary counterpart (Brazil, 2000).
The average growth of NR from 2001 to 2017 was 8.9%, while total expenses and personnel expenses grew on average 9% and 12.1% per year respectively. This, in turn, already indicates the discrepancy between public revenues and spending. It should be noted that due to natural population, personnel spending in the SRJ grew in a continual manner, especially the incremental values determined by law for civil servants in terms of periodic raises, salary adjustments and year-end bonuses beginning in 2014.
The relationship between personnel expenses and NR displayed a tendency to grow beginning in 2011, but remained within acceptable levels until the end of 2015 (below 54% of NR). However, the PE/NR index reached 72.3% and 67% in 2016 and 2017 respectively, exhibiting growth above the historical average and exceeding the maximum legal limit of 60% as determined by the FRL.
In addition, comparing the accumulated values between 2001 and 2017, while NR grew 268.8%, PE grew 461.12%, which reinforces the effect of the denominator (the fall in NR) on the PE/NR index, as well as this public entity’s lack of control in terms of personnel expenses, especially during a time of deep economic recession.
Santos (2015) also emphasizes that the states have not properly interpreted Article 19 §1 of the FRL, which determines the exclusion of inactive employees and pensioners in terms of the associated resources. In the case of the SRJ, the author finds that 28.5% of the corresponding expenses of the NR are not computed, and if summed with the 43.2% of the expense considered and published by the state government, this yields a value of 71.7% for 2014, thus already exceeding the limit permitted by the FRL and harming debt service payments and the making of investments, as effectively occurred beginning in 2015.
4.2 CONSOLIDATED NET DEBT, MACROECONOMIC FACTORS AND THE SUSTAINABILITY OF STATE DEBT
The instrument to control the limits of public debt established by the FRL considers that the value of the consolidated net debt (CND), which is defined as the consolidated public debt minus available cash, financial applications and other financial obligations, can be at most twice the value of NR and should be verified every quarter (Brazil, 2001). If the public administration exceeds these limits, the FRL imposes sanctions such as the inability of the state to take out loans (credit operations) or receive voluntary transfers (Brazil, 2000).
TABLE 2 PROGRESSION OF THE CND, CND/NR, CREDIT OPERATIONS, AMORTIZATION, INTEREST AND CHARGES FROM 2001 TO 2017 FOR THE STATE OF RIO DE JANEIRO
Year NR CND %CND* CND/NR CO Amort Int & Chg AIC/NR
2001 13,608,848 25,840,552 – 190% 328,558 387,367 1,188,098 11.58%
2002 15,100,326 35,449,514 37,2% 235% 420,814 508,943 1,489,941 13.24%
2003 19,168,781 38,957,303 9,9% 203% 189,331 472,653 1,804,216 11.88%
2004 21,009,274 42,929,196 10,2% 204% 260,894 849,983 1,673,602 12.01%
2005 23,094,091 43,901,530 2,3% 190% 280,750 712,696 1,997,551 11.74%
2006 26,132,742 45,072,844 2,7% 172% 352,734 728,646 2,167,339 11.08%
2007 26,849,822 46,575,259 3,3% 173% 163,674 840,568 2,373,213 11.97%
2008 31,830,883 51,041,606 9,6% 160% 175,610 883,068 2,511,144 10.66%
2009 28,976,688 47,204,512 -7,5% 163% 274,809 1,222,952 2,293,140 12.13%
2010 34,534,906 53,952,732 14,3% 156% 1,295,237 1,227,768 2,334,211 10.31%
2011 39,268,345 57,378,214 6,3% 146% 1,271,501 1,630,549 2,469,236 10.44%
2012 40,613,415 67,094,118 16,9% 165% 4,755,173 2,225,819 2,633,461 11.96%
2013 47,064,197 72,380,974 7,9% 154% 5,030,290 2,832,809 2,931,170 12.25%
2014 46,045,518 82,054,789 13,4% 178% 4,879,411 3,449,712 3,232,685 14.51%
2015 51,224,317 101,175,146 23,3% 198% 4,994,873 3,450,713 3,834,759 14.22%
2016 46,228,984 108,103,232 6,8% 234% 1,047,452 1,986,946 2,729,723 10.20%
2017 50,194,045 135,393,365 25,2% 270% 2,313,611 700,424 1,108,368 3.60%
Source: Elaborated by the authors based on data from Ceperj and Bacen (2017). Legend:
* Calculated variation between the current year and the previous year ** Values in R$ 1,000.00
NR = Net revenues
CND = Consolidated net debt CO = Credit operations
Amort = Values paid for the amortization of public debt Int. and Chg = Values paid for debt interest and charges
AIC/NR = Ratio of values paid for amortization, interest and charges, over the state’s net revenues
Concomitant with the growth of the CND/NR index, the cost of servicing the debt, represented by the values paid for the amortization, interest, and charges related to the state public debt as well as credit operations also displayed a growing trend during the period from 2009 to 2015. Senate Resolution No 43/2001 declares that the annual debt service cost, including values for current and
It may be noted that the debt service amounted to 11.4% of NR on average from 2001 to 2017, and exceeded the limits permitted by the legislation from 2012 to 2016. Even so, the SRJ continued realizing credit operations paying R$ 42,294,445,000.00 for amortization, interest and charges from 2009 to 2017, 105.42% above the sum paid from 2001 to 2008.
The increase in debt service costs was due to state debt which grew massively due to an increase in credit operations and the non-payment of the full total of the state’s obligations, especially after 2012 (graph 1). Thus, the remainder of the payments added to the balance of the debt, including charges for interest and inflation adjustments, and made it impossible to reduce the debt, which further aggravated the financial sustainability of the SRJ.
GRAPH 1 CREDIT OPERATIONS AND DEBT SERVICING FOR THE STATE OF RIO DE JANEIRO FROM
2001 TO 2017
Source: Bacen (2017).
The analysis of the sustainability of public debt, considering the primary balance, the CND/GDP ratio, real GDP growth and real interest rates, has been a topic of discussion in various articles and has been used to accompany the fiscal sustainability of governments (Almeida and Salto, 2016; Greiner and Fincke, 2015; Burger and Marinkov, 2012).
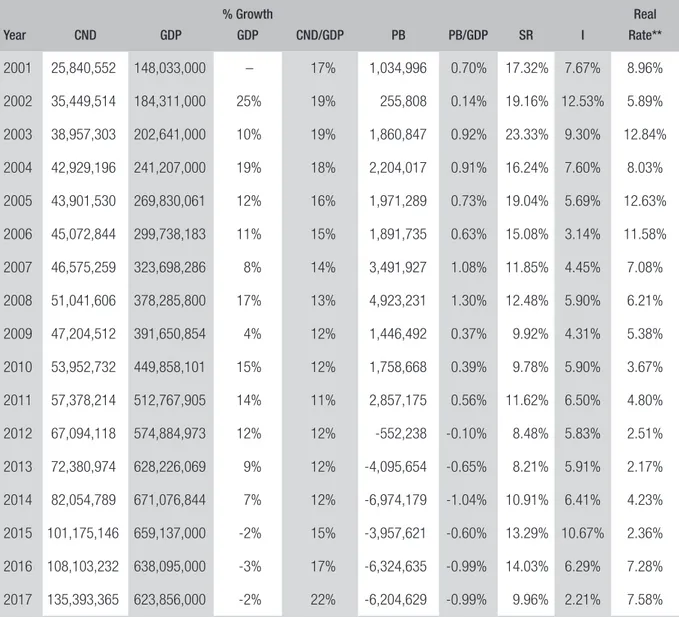
in 2015, and the generation of successive primary deficits beginning in 2012, which affected the government’s ability to pay for the servicing of the debt and, as a result, the sustainability of the trajectory observed up until 2011 (table 3).
TABLE 3 TRAJECTORY OF THE CND, GDP, CND/GDP, PRIMARY BALANCE AND REAL INTEREST RATES
FROM 2001 TO 2017 FOR THE STATE OF RIO DE JANEIRO
Year CND GDP
% Growth
GDP CND/GDP PB PB/GDP SR I
Real Rate**
2001 25,840,552 148,033,000 – 17% 1,034,996 0.70% 17.32% 7.67% 8.96%
2002 35,449,514 184,311,000 25% 19% 255,808 0.14% 19.16% 12.53% 5.89%
2003 38,957,303 202,641,000 10% 19% 1,860,847 0.92% 23.33% 9.30% 12.84%
2004 42,929,196 241,207,000 19% 18% 2,204,017 0.91% 16.24% 7.60% 8.03%
2005 43,901,530 269,830,061 12% 16% 1,971,289 0.73% 19.04% 5.69% 12.63%
2006 45,072,844 299,738,183 11% 15% 1,891,735 0.63% 15.08% 3.14% 11.58%
2007 46,575,259 323,698,286 8% 14% 3,491,927 1.08% 11.85% 4.45% 7.08%
2008 51,041,606 378,285,800 17% 13% 4,923,231 1.30% 12.48% 5.90% 6.21%
2009 47,204,512 391,650,854 4% 12% 1,446,492 0.37% 9.92% 4.31% 5.38%
2010 53,952,732 449,858,101 15% 12% 1,758,668 0.39% 9.78% 5.90% 3.67%
2011 57,378,214 512,767,905 14% 11% 2,857,175 0.56% 11.62% 6.50% 4.80%
2012 67,094,118 574,884,973 12% 12% -552,238 -0.10% 8.48% 5.83% 2.51%
2013 72,380,974 628,226,069 9% 12% -4,095,654 -0.65% 8.21% 5.91% 2.17%
2014 82,054,789 671,076,844 7% 12% -6,974,179 -1.04% 10.91% 6.41% 4.23%
2015 101,175,146 659,137,000 -2% 15% -3,957,621 -0.60% 13.29% 10.67% 2.36%
2016 108,103,232 638,095,000 -3% 17% -6,324,635 -0.99% 14.03% 6.29% 7.28%
2017 135,393,365 623,856,000 -2% 22% -6,204,629 -0.99% 9.96% 2.21% 7.58%
Source: Elaborated by the authors based on data from Ceperj and Bacen (2017). Nominal values in R$ 1,000.00. Legend:
CND = Consolidated net debt GDP = Gross domestic product SR = Selic rate
I = Inflation as measured by the IPCA PB = Primary balance
We can also perceive that the intertemporal sustainability of the state debt has been aggravated by the readjustments to the internal financing with the federal government and its external financing in US dollars, as well as the decrease in NR due to the country’s internal crisis. The unsustainability of the SRJ’s debt was pointed out by the SAT (2017) due to the unsustainable growth of CND from 2008 to 2017, the application of long-term resources raised by credit operations for short-term projects that fall outside of those which are legally authorized, and a lack of dissemination of the facts involving the real situation of the state’s debt.
It may be observed that the deterioration of the SRJ’s fiscal management is recognized by Law No
7,483 of November 8, 2016 which declared a state of disaster in regard to the financial administration of the state until December 2017, followed in January 2017 by the reaching of an agreement with the federal government to implement a fiscal recovery plan for 2017 to 2019 (TCE-RJ, 2017).
We would like to emphasize that Law No 7,483 suspended the timeframe for adjustments that fulfill
the limits established by the FRL and the federal government agreed to suspend state debt payments for three periods, without prohibiting the state from obtaining new loans.
From this point of view, it should be remembered that the FRL establishes clear norms for state fiscal responsibility and envisions sanctions and punishments for the government administrator when the imposed limits are exceeded, and the countless exclusions made by these managers, the constant charges imposed by the federal government on this state debt, the lack of condemnation of the managers involved, and the absence of the creation of a law that would create a fiscal board as prescribed in Article 67 of the FRL, all weakened the adequate fulfillment of the law, and the disciplinary role of the FRL in terms of state fiscal management.
5. FINAL CONSIDERATIONS
This work analyzes the dynamics of the SRJ’s fiscal management during the period from 2001 to 2017 from the point of view of the parameters established by the FRL and the influence of the primary balance and macroeconomic factors on the sustainability of the trajectory of state public debt.
It may be observed that the limits permitted by the legislation in relation to the PE/NR, CND/ NR, and debt service ratios were all exceeded, and this together with a decrease in GDP, an increase in interest rates and continuous primary deficits beginning in 2012 revealed the fiscal instability of the SRJ and led to a severe fiscal crisis in 2017.
We conclude that even though the FRL performed a disciplinary role on the management of the SRJ’s finances until the middle of 2012, this legislation did not limit the poor management of resources and was not sufficient to avoid the fiscal unsustainability that affected the state beginning in 2014.
REFERENCES
ALMEIDA, Mansueto; SALTO, Felipe. Finanças
públicas: da contabilidade criativa ao resgate da
credibilidade. Rio de Janeiro: Record, 2016.
BORGES, Guilherme de F. et al. Endividamento dos estados brasileiros após uma década da Lei de Responsabilidade Fiscal: uma análise sobre a ótica da estatística multivariada. Revista FSA, Teresina, v. 10, n. 4, p. 20-43, Oct./Dec. 2013.
BACEN. Banco Central do Brasil. 2018.
BURGER, Philippe; MARINKOV, Marina. Fiscal rules and regime-dependent fiscal reaction functions: the South African case. OECD Journal on Budgeting, Paris, v. 12, n. 1, p. 1D, 2012.
BRAZIL. Lei Complementar no 101, de 04 de maio de
2000, Lei de Responsabilidade Fiscal.
BRAZIL. Senado Federal. Resolução no 40, 20 de
dezembro de 2001.
CALDEIRA, Alessandro A. et al. Sustentabilidade da dívida estadual brasileira: uma análise da relação
dívida líquida e resultado primário. Rev. Adm.
Pública, Rio de Janeiro, v. 50, n. 2, p. 285-306, Mar./ Apr. 2016.
CEPERJ. Centro Estadual de Estatística, Pesquisas e Formação de Servidores Públicos do Rio de Janeiro. 2017.
DALMONECH, Luiz Fernando; TEIXEIRA, Arilton; SANT’ANNA, José Mario B. O impacto ex post da Lei de Responsabilidade Fiscal. Rev. Adm. Pública, Rio de Janeiro, v. 45, n. 4, p. 1173-1196, July/Aug. 2011.
FONTENELE, Ana Lúcia et al. Sustentabilidade da dívida pública dos estados brasileiros (Public debt sustainability of brazilian states). Revista Ciências Administrativas, Fortaleza, v. 21, n. 2, p. 621-638, July/Dec. 2015.
FORSLUND, Kristine; LIMA, Lycia; PANIZZA, Ugo. The determinants of the composition of public debt in developing and emerging market countries.
Review of Development Finance, v. 1, p. 207-222,
2011.
GOVERNO DO ESTADO RIO DE JANEIRO. Portal
da transparência do Estado do Rio de Janeiro. 2017.
GREINER, Alfred; FINCKE, Bettina. Public debt,
sustainability and economic growth: theory and
empirics. Berlin: Springer Science, 2015.
LIMA, Luiz; SAMPAIO, Raquel; GAGLIANONE, Wagner. Debt ceiling and fiscal sustainability in Brazil: a quantile autoregression approach. Journal of Development Economics, v. 86, p. 313-335, 2008.
MELLO, Gilmar R. de; SLOMSKI, Valmor; CORRAR, Luiz João. Estudo dos reflexos da lei de responsabilidade fiscal no endividamento dos
estados brasileiros. Revista Contabilidade, Gestão
e Governança, Brasília, v. 8, n. 1, p. 41-60, Jan./July 2005.
MORA, Mônica. Evolução recente da dívida estadual. Rio de Janeiro: Ipea, 2016. (Texto para Discussão, n. 2185). Available at: <www.ipea.gov.br/portal/ images/stories/PDFs/TDs/td_2185.pdf>. Accessed on: 28 Mar. 2018.
NASCIMENTO, Edson Ronaldo; DEBUS, Ilvo. Lei
complementar no 101/2000: entendendo a Lei de
Responsabilidade Fiscal. 2. ed. Brasília: Ministério da Fazenda, Secretaria do Tesouro Nacional, 2002.
PESSOA, Mônica M. Y. A. C. S.; SANTOS, Francisco
Eduardo D. L. E. A. Limites ao endividamento e
sustentabilidade fiscal: o caso dos governos estaduais. Rio de Janeiro: Ipea, 2016. (Texto para Discussão, n. 2232). Available at: <www.ipea.gov.br/portal/ images/stories/PDFs/TDs/04102016td_2232.pdf>. Accessed on: 28 Mar. 2018.
SANTOS, Darcy F. C. Situação financeira dos estados após quinze anos da Lei de Responsabilidade Fiscal.
Estudos e trabalhos sobre finanças públicas. Porto Alegre: s.n., 2015. Available at: <www.bcq.usp.br/ fotos/manual_referencias.pdf>. Accessed on: 28 Mar. 2018.
SODRÉ, Antônio Carlos D. A. Lei de Responsabilidade Fiscal: condição insuficiente para o ajuste fiscal.
Revista de Administração de Empresas, São Paulo,
v. 1, n. 2, p. 1-15, July/Dec. 2002.
TCE-RJ. Tribunal de Contas do Estado do Rio de Janeiro. Relatório de auditoria governamental. Processo n. 108.167-8/16. 2017.
TOLEDO JÚNIOR, Flávio C. de. Receita corrente líquida: limites da despesa de pessoal e dívida pública, precatórios e parcelamentos previdenciários.
Revista Jus Navigandi, Teresina, a. 17, n. 3467,
Alethéia Ferreira da Cruz
PhD in Administration and Adjunct Professor in the Faculty of Administration and Accounting and Economic Sciences at the Federal University of Goiás (UFG). E-mail: aletheiacruz@yahoo.com.br.
Bruno Lobão Lopes
Masters in Public Administration from the Federal University of Goiás (UFG). E-mail: brunolobaolopes@hotmail.com.
Daiana Paula Pimenta
PhD in Administration and Adjunct Professor in the Faculty of Administration and Accounting and Economic Sciences at the Federal University of Goiás (UFG). E-mail: daiana-pimenta@hotmail.com.
Gustavo Fernandes Soares