Manuel Carlos dos Santos Sousa
Intelligent Forecasting of Electricity
Consumption in Buildings, for Application
in the Iberian Market of Electricity Bidding
Manuel Carlos dos Santos Sousa
Intelligent Forecasting of Electricity
Consumption in Buildings, for Application
in the Iberian Market of Electricity Bidding
Masters in Electronics and Telecommunications Engineering
Supervisors:
António Ruano
Rui Santana
i
Intelligent Forecasting of Electricity Consumption in
Buildings, for Application in the Iberian Market of Electricity
Bidding
Declaração de autoria de trabalho
Declaro ser o autor deste trabalho, que é original e inédito. Autores e trabalhos consultados estão devidamente citados no texto e constam da listagem de referências incluida.
________________________________________________________________ (Manuel Carlos dos Santos Sousa)
Copyright ©
A Universidade do Algarve reserva para si o direito, em conformidade com o disposto no Código do Direito de Autor e dos Direitos Conexos, de arquivar, reproduzir e publicar a obra, independentemente do meio utilizado, bem como de a divulgar através de repositórios científicos e de admitir a sua cópia e distribuição para fins meramente educacionais ou de investigação e não comerciais, conquanto seja dado o devido crédito ao autor e editor respetivos.
ii
Acknowledgments
I would like to express my gratitude to Professor Doctor António Ruano, for guidance, support, helping with me with opinions, critical view, clarifications and corrections, without them this report wouldn’t be possible.
I would like to thank Sérgio Silva of Easysensing, for is availability and constant enthusiasm when introducing me to important contents and assisting me in several occasions during this work.
I would like to show my gratitude to all those in Rolear Group who in one way or another contributed to the accomplishment of this work. Particularly, Engº António Parreira Afonso, for giving me the opportunity of an internship in Rolear Group company, and Rui Santana, for is patience, teachings and introducing me to the company and working sector.
I would like to thank my girlfriend, Patricia Santos, for all her love, support and for always being by my side.
Lastly, I would to thank my parents, Manuel Sousa and Olga Sousa, who contributed to this work by showing patience and encouragement, providing me a proper education and values since the beginning.
iii
Resumo
O governo português, numa iniciativa conjunta com o governo espanhol, formou o Mercado Ibérico de Eletricidade ou MIBEL, que possibilita a qualquer consumidor do espaço ibérico, adquirir energia elétrica num regime de livre concorrência, a qualquer produtor ou comercializador de energia elétrica que atue em Portugal ou Espanha. Criou-se assim um mercado de energia muito competitivo, onde a energia elétrica é comprada e vendida ao preço do mercado. Como consequência, o risco assumido pelas empresas que produzem, vendem ou compram energia elétrica aumentou substancialmente, tornando-se difícil gerir uma empresa deste sector sem fazer qualquer tipo de análise estatística ou sem implementar técnicas e métodos de previsão. Daí a necessidade de estudar e desenvolver modelos de previsão para o consumo da energia elétrica.
Numa perspetiva de otimização das ofertas de compra de energia, em mercados organizados, atendendo às previsões das necessidades dos clientes e volatilidade dos contratos, o processo de compra revela-se uma atividade crucial. O trabalho desenvolvido presente neste relatório vem no seguimento desta necessidade identificada durante o periodo de estágio na empresa do Grupo Rolear, no departamento Rolear Viva responsável pela comercialização de electricidade e gás natural no mercado livre. Depois de um período de estudo aprofundado do funcionamento do setor, foram utilizados modelos de redes neuronais de função de base radial (RBFNN), em que a sua estrutura foi otimizada através do algoritmo genético multi-objectivo (MOGA). Os modelos foram idealizados para um horizonte de previsão de 24 e 48 horas, assentes em abordagens de consumos energéticos sazonais e anual, bem como utilizando variáveis exógenas que reflitam os hábitos diários e contributos atmosféricos no consumo de energia.
Palavras-chave: Redes Neuronais Artificiais, Função Base Radial, Previsão de
iv
Abstract
The Portuguese government, in a joint initiative with the Spanish government, formed the Iberian Electricity Market or MIBEL, which enables any Iberian consumer to acquire electricity in a free competition regime, to any producer in Portugal or Spain. This has created a very competitive energy market, where electricity is purchased and sold at the market price. Consequently, the risk assumed by the companies that produce, sell or purchase electric energy has increased substantially, making it difficult to manage a company in this sector without any statistical analysis or without implementing forecasting techniques and methods. Hence the need to study and develop forecast models for the consumption of electricity.
In a perspective of optimizing energy purchase offers, in organized markets, considering the prediction of consumers needs and contract volatility, the purchasing process proves to be a crucial activity. The work developed in this report is a possible answer to this need identified during the internship period at the Rolear Group company, in the Rolear Viva department responsible for the commercialization of electricity and natural gas in the free market. After a period of in-depth study of the sector's operation, radial basis function neural network models (RBFNN) were used, optimized through the multi-objective genetic algorithm (MOGA). The models were designed for a prediction horizon of 24 and 48 hours, based on seasonal and annual energy consumption approaches, as well as using exogenous variables that reflect the daily habits and atmospheric contributions in energy consumption.
Keywords: Artificial Neural Networks, Radial Basis Function, Energy Consumption
v
List of Contents
Declaração de autoria de trabalho ... i
Acknowledgments ... ii
Resumo ... iii
Abstract ... iv
List of Contents ... v
List of Figures ... vii
List of Tables ... viii
List of Abbreviations ... ix
1. Introduction ... - 1 -
1.1 Internship motivations and goals ... - 1 -
1.2 Report scope ... - 2 -
2. Rolear Internship ... - 3 -
2.1 The Rolear group ... - 3 -
2.2 Rolear.ON Internship ... - 5 -
2.3 Rolear Viva Internship ... - 6 -
3. National Electric System ... - 8 -
3.1 Background ... - 8 -
3.2 NES value chain ... - 10 -
3.2.1 Production ... - 11 -
3.2.2 Transportation ... - 11 -
3.2.3 Distribution ... - 11 -
3.2.4 Commercialization ... - 12 -
3.2.5 Final consumer ... - 13 -
4. Iberian Electricity Market ... - 15 -
4.1 Liberalized market ... - 15 - 4.2 MIBEL operation ... - 16 - 4.2.1 Daily market ... - 18 - 4.2.2 Intraday market ... - 20 - 4.2.3 Forward market ... - 21 - 5. Data Availability ... - 23 - 5.1 Information flow... - 23 -
5.1.1 Individual data by delivery point (DPC) ... - 24 -
5.1.2 Data aggregated data by client portfolio ... - 25 -
vi
6. ANN Theoretical Background ... - 29 -
6.1 Artificial Neural Network Concepts ... - 29 -
6.2 Radial Basis Function Neural Network ... - 32 -
6.3 RBFNN Training Schemes ... - 34 -
6.3.1 Fixed centers selected at random ... - 34 -
6.3.2 Self-organized selection of centers ... - 35 -
6.3.3 Supervised selection of RBFNN parameters ... - 36 -
6.3.4 Stopping criteria ... - 39 -
6.4 Multi Objective Genetic Algorithms ... - 40 -
7. Methodology Applied ... - 43 -
7.1 Early work development overview ... - 43 -
7.2 Data set ... - 45 -
7.3 Patterns of consumption ... - 46 -
7.3.1 Characteristic days patterns ... - 47 -
7.3.2 Temperature influences ... - 48 -
7.4 Data approaches ... - 48 -
7.4.1 Seasonal data approach... - 50 -
7.4.2 Yearly data approach ... - 51 -
7.5 RBFNN model design using MOGA ... - 52 -
7.5.1 RBFNN Training ... - 52 -
7.5.2 MOGA model optimization ... - 53 -
7.5.3 Model design cycle ... - 54 -
7.5.4 Dataset preparation ... - 56 -
7.5.5 Models design ... - 57 -
8. Results ... - 60 -
8.1 Early experimental work ... - 60 -
8.2 RBFNN model design using MOGA optimization ... - 61 -
8.2.1 Prediction horizon 24 steps ahead ... - 61 -
8.2.2 Prediction horizon 48 steps ahead ... - 69 -
8.3 Models final comparison ... - 78 -
9. Conclusions and Future work ... - 82 -
9.1 Conclusions ... - 82 -
9.2 Future Work ... - 83 -
vii
List of Figures
Figure 2.1 – Rolear group logo. [1] ... - 3 -
Figure 3.1 – National electric system structure in the early days. [2][3] ... - 9 -
Figure 3.2 – Restructuration of the national electric system. [4] ... - 10 -
Figure 3.3 – National electric system value chain. [5] ... - 10 -
Figure 3.4 – Different voltage levels assigned to the customers. ... - 13 -
Figure 4.1 – Overall structure of the different Iberian electricity markets. ... - 17 -
Figure 4.2 – The crossing of purchase and sale offers originates the market price of electricity. This method is based on the Euphemia algorithm. [16] ... - 18 -
Figure 4.3 – Market splitting procedure. [16] ... - 19 -
Figure 5.1 – Periodicity of the availability of data. ... - 24 -
Figure 5.2 – Periodicity and content type of the data made available by delivery point. ... - 25 -
Figure 5.3 - Periodicity and content type of the data made available for the complete client portfolio. .. - 26 - Figure 5.4 – The smart meter, e-box, being installed by the EDP Distribuição. [21] ... - 28 -
Figure 6.1 – Biological neuron. [24] ... - 30 -
Figure 6.2 – Example of a neural network with xm inputs, one neuron and one output. [26] ... - 30 -
Figure 6.3 - Example of a RBF neural network with xm inputs and N neurons. [26] ... - 33 -
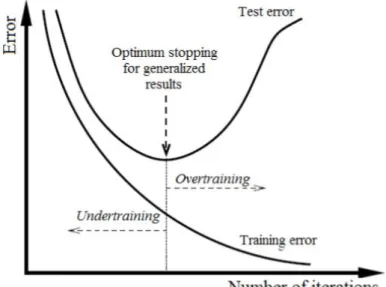
Figure 6.4 – Optimum stopping avoiding overtraining and undertraining in order to achieve a satisfied generalization. [27] ... - 40 -
Figure 6.5 - Concept of Pareto optimality. [31] ... - 41 -
Figure 6.6 – MOGA procedure diagram. [32] ... - 41 -
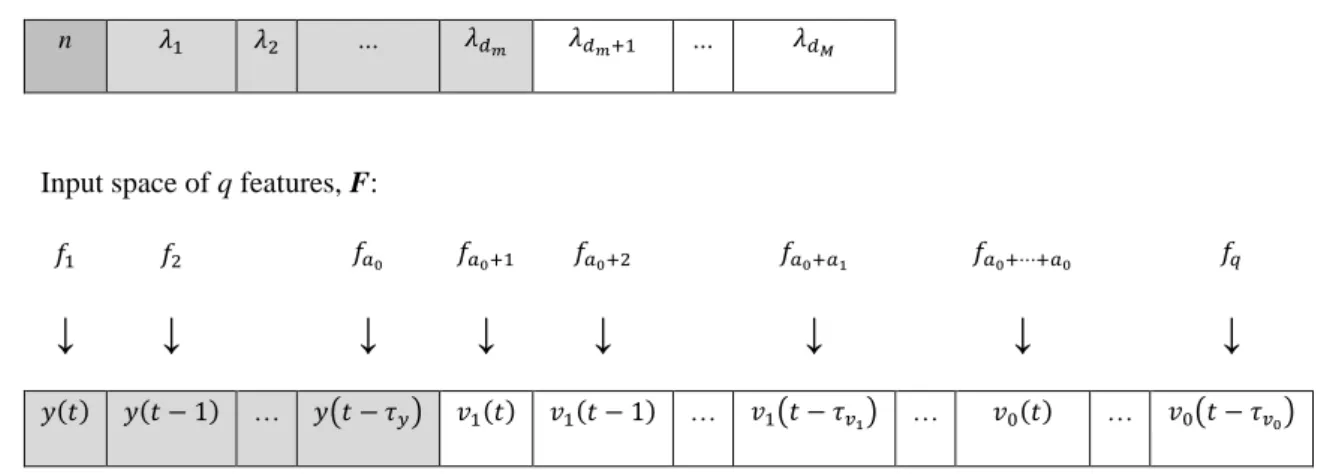
Figure 6.7 – Chromosome composition and representation of the input equation of a neural network. [32] ... - 42 -
Figure 7.1 – Early work development during this project. ... - 44 -
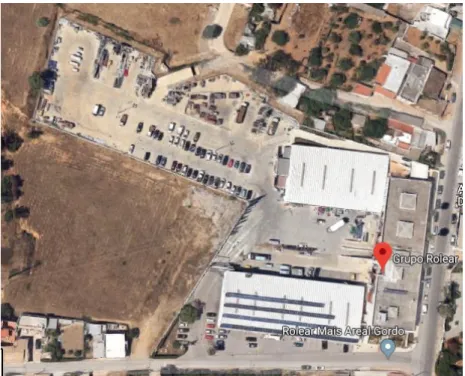
Figure 7.2 – Google maps screenshot of the Rolear group headquarters. coordinates: 37°02'26.5"N 7°53'49.0"W. ... - 45 -
Figure 7.3 – Comparison of the energy consumption between 5 days distinct days. ... - 47 -
Figure 7.4 – Comparison of the energy consumption at every 11h00 of the data set. ... - 48 -
Figure 7.5 – Developed models according to each data approach. ... - 49 -
Figure 7.6 – Energy consumption in each seasonal data set. ... - 50 -
Figure 7.7 - Energy consumption in the entire data set corresponding to a year. ... - 51 -
Figure 7.8 – MOGA design cycle. [35] ... - 55 -
Figure 8.1 – Performance of the models chosen for each seasonal approach, for the forecasting error of 24 steps ahead. ... - 64 -
Figure 8.2 - Performance of the models chosen for the yearly approach, for the forecasting error of 24 steps ahead. ... - 66 -
Figure 8.3 - Performance of the best models for 24 steps ahead prediction horizon. ... - 68 -
Figure 8.4 - Performance of the models chosen for each seasonal approach, for the forecasting error of 48 steps ahead. ... - 72 -
Figure 8.5 - Performance of the models chosen for the yearly approach, for the forecasting error of 48 steps ahead. ... - 74 -
Figure 8.6 - Performance of the best models for 48 steps ahead prediction horizon. ... - 77 -
Figure 8.7 - Comparison of the performance of the models designed with RBFNN using MOGA optimization. ... 80
-viii
List of Tables
Table 4.1 – The different sessions available in the intraday market. [19] ... - 20 -
Table 6.1 – Most common activation functions. [23][25] ... - 32 -
Table 7.1 – Code assigned to each day. [33] ... - 46 -
Table 7.2 – Overview of the complete data set. ... - 46 -
Table 7.3 – Overall information of the seasonal data sets. ... - 50 -
Table 7.4 - Overall information of the yearly data sets. ... - 51 -
Table 7.5 - Models input lags combinations. ... - 56 -
Table 7.6 – MOGA parameters used in the first cycle. ... - 57 -
Table 7.7 – Restriction/objectives applied in the second cycle of MOGA design for the models of 24 steps ahead prediction horizon. ... - 58 -
Table 7.8 – Restriction/objectives applied in the second cycle of MOGA design for the models of 48 steps ahead prediction horizon. ... - 59 -
Table 8.1 – Network evaluations of the models generated using MATLAB NN Time Series Toolbox. . - 61 - Table 8.2 – NAR and NARX models of the selected network models of each seasonal approach, for a 24 step ahead prediction horizon. ... - 63 -
Table 8.3 – Network evaluation of the best models generated using MOGA optimization for each seasonal approach. ... - 63 -
Table 8.4 – 1 step ahead, 24 steps ahead and sum of the forecasting error for the models of each seasonal approach. ... - 65 -
Table 8.5 - NAR and NARX models of the selected network models of the yearly approach, for a 24 step ahead prediction horizon. ... - 65 -
Table 8.6 - Network evaluation of the best models generated using MOGA optimization for the yearly approach. ... - 66 -
Table 8.7 – 1 step ahead, 24 steps ahead and sum of the forecasting error for the models of the yearly approach. ... - 67 -
Table 8.8 - Best models of each approach. ... - 68 -
Table 8.9 – 1 step ahead, 24 steps ahead and sum of the forecasting error for the best models of each approach, for 24 steps ahead prediction horizon. ... - 69 -
Table 8.10 - NAR and NARX models of the selected network models of each seasonal approach, for a 48 step ahead prediction horizon. ... - 71 -
Table 8.11 – Network evaluation of the best models generated using MOGA optimization for each seasonal approach. ... - 71 -
Table 8.12 –1 step ahead, 48 steps ahead and sum of the forecasting error for the models of each seasonal approach. ... - 73 -
Table 8.13 - NAR and NARX models of the selected network models of the yearly approach for a 48 step ahead prediction horizon. ... - 73 -
Table 8.14 - Network evaluation of the best models generated using MOGA optimization for the yearly approach. ... - 74 -
Table 8.15 – 1 step ahead, 48 steps ahead and sum of the forecasting error for the models of the yearly approach. ... - 75 -
Table 8.16 - Best models of each approach. ... - 76 -
Table 8.17 – 1 step ahead, 48 steps ahead and sum of the forecasting error for the best models of each approach, for 48 steps ahead prediction horizon. ... - 77 -
Table 8.18 – Comparison of the NAR and NARX models performances of the different model design methods used in this work, from an early experimental phase to an optimization phase. ... - 79 -
Table 8.19 - 1 step ahead, 24 steps ahead and sum of the forecasting error for the models designed with RBFNN using MOGA. ... 81
-ix
List of Abbreviations
MIBEL Iberian electricity market
XBID Cross-border intraday market project EDP Energias de Portugal
CEO Chief executive officer NES National Electric System ORP Ordinary regime production SRP Special regime production NTN National transmission network NDN National distribution network VHV Very high voltage
HV High voltage
MH Medium voltage
SLV Special low voltage NLV Normal low voltage
ERSE Energy services regulatory authority REN Redes Energéticas Nacionais
LRES Last resort energy supplier
DGEG Directorate general for energy and geology IMO Iberian market operator
OMIP Operator of the Iberian energy market (Portuguese pole) OMIE Operator of the Iberian energy market (Spanish pole) DPC Delivery point code
DNO Distribution network operator TNO Transmission network operator
EB Energy box
HAN Home area network ANN Artificial neural network RBF Radial basis function
x
MOGA Multi-objective genetic algorithm
GA Genetic algorithm
NAR Nonlinear autoregressive
NARX Nonlinear autoregressive exogenous PH Prediction horizon
- 1 -
Chapter 1
1.
Introduction
1.1 Internship motivations and goals
After a long academic journey that trained me with a solid scientific and technical knowledge in the field of electronics and telecommunications engineering, through the learning of methodologies and tools for solving problems in engineering, I decided to test myself, going out of the comfort zone of university environment, and approach a new experience in the field, by undergoing on an internship that could improve my capacities as a new professional in the business and grow as person.
This initiative had several main goals, that constantly motivated me to challenge myself. One of the main goals, and of course, the one that gives purpose to this work, is to complete my academic course, more specifically, to conclude the integrated master’s degree in electronics and telecommunications engineering in the Faculty of Science and Technology of University of Algarve, but also, to seize the opportunity and make the most of my time in the company that embraced me. By taking advantage of the opportunity of an internship, it would be a great chance of being introduced to the field and to the job market, as well as, gain experience by working with direct contact with professionals, being a good test to my skills and to acquire new abilities that could serve me in the future.
Chapter 1 - Introduction
- 2 -
In the scope of the report main topic, another motive that also captivated my curiosity, was the fact of being able to explore emerging fields related to artificial intelligent, such as machine learning, prediction algorithms or artificial neural networks and their methodologies. Having these subjects, such an increasing relevant role in nowadays different working areas, this could be an useful skill to possess, serving as preparation for what my professional future may bring.
The project developed during the internship was idealized with the purpose to fill a need, namely in the support of a task which reveals particularly relevant in the business of commercialization of electricity. This task, more specifically, is the process of purchasing electricity in the different Iberian electricity markets, where a good forecast in a short period of time proves to be a fundamental support for a favourable participation in the markets. With this aim in mind, a familiarization with the Iberian electricity markets and the National electricity system was carried out, in order to explore the use of methods based on artificial neural networks for different forecast periods and different consumption patterns during a year. The work developed furthermore is characterized by the capacity to be executed on the current state of the electrical system, but also able to adapt to the innovations that are currently being implemented in this sector.
1.2 Report scope
In chapter 2, a report of my experiences during the internship and how the work developed in this thesis fits in the needs of the company department is performed. In chapter 3, the constitution and hierarchy of the national electrical system structure is presented. In chapter 4, the different Iberian electricity markets and their specificities are explained. In chapter 5, is explained how the data availability flow is operated between the different agents in the national electrical system and the innovations in the sector. In chapter 6, is theoretically introduced the artificial neural networks concept, the training schemes applied and MOGA implementation. In chapter 7, the methodology, design and implementation used in the forecasting model using artificial neural networks is explained. In chapter 8, the results of the tests are presented and elaborated. In chapter 9, conclusions and future work are given.
- 3 -
Chapter 2
2.
Rolear Internship
At the end of July of 2017, with the intention of completing the master's degree in electronic engineering and telecommunications and simultaneously acquire professional experience, I carried out an internship at the company Rolear, SA. This period was fruitful in learning and acquired skills, and this chapter reports in detail my experience during the internship.
2.1 The Rolear group
In May 1979, Rolear S.A. was founded in a small shop in Faro. This first company settled the foundations of what is now a major group of companies, all focused in different fields specializations, but at the same time working together in harmony, as a team and still characterized by the same values that marked the early beginnings since its foundation.
Chapter 2 – Rolear Internship
- 4 -
In his early days, Rolear, S.A focused in the job market with innovative offers in customized engineering solutions, commercialization of electrical and electromechanical equipment, as well as technical assistance. The success of this first project, having its most impact mainly in Algarve, with leading pioneer investments in the representation of renowned brands, or in automation solutions for hydraulic oil systems, electricity and compressed air, dictated the continuous growth that enabled the constitution of Rolear Group. This resulted in the expansion of new business areas through creating and adding several specialized companies and brands, capable of keeping the same ability to be in edge of progress offering a wider range of solutions not only in Algarve region, but to all Portugal regions.
Currently the Rolear Group has his headquarters in Sitio do Areal Gordo, Faro, and is composed by 5 major branches:
• Rolear Mais, experts in the market of electrical, mechanical and electromechanical products and equipment for public and private spaces, as well as, representing several Portuguese and international leading brands. Also having 11 more shops spread throughout continental Portugal.
• Rolear.ON, is a company dedicated to both installation and maintenance services in industrial facilities, construction works infrastructures and landscaping.
• Rolegás, responsible for the supply of propane gas, installation projects and maintenance of gas grids.
• Academia Rolear, is a company focused on the training and teaching in technical and management areas.
• Rolear Viva, the most recent branch, created with purpose of providing natural gas and electricity in the liberalised energy market.
Having several departments specialized in such specific areas, makes Rolear Group present in the market in different ways, offering a wide range of solutions from product and equipment supply, to piped gas distribution, commercialization of natural gas and electricity, construction, infrastructures and landscaping to all sorts of technical installations, maintenance, technical support and training. All of this being supported by quality of products, but most of
Chapter 2 – Rolear Internship
- 5 -
all, the know-how of a dynamic team of approximately 230 employees and the tradition of accurate working ethics for almost 40 years. [1]
2.2 Rolear.ON Internship
In the end of July 2017, the internship in Rolear Group officially started. The company in which the internship started was Rolear.ON, more especially, in the department of electricity and electrical panels, responsible for engineer and assemble electric panels, give assistance and maintenance to electrical systems and complete execution of electrical projects.
In this period, I was engaged in several works, that went from electric panels alarm modules programming and configuration, project external protection to air conditioner, luminaires control systems configuration, maintenance and assistance, implementation of cctv security systems, project security lock system for transformer substation, electrical surveys and orders, dimension or quantify electric cables and rails for different electrical systems, as well as, minimal maintenance works. It should also be noted the close monitoring of some works, that enabled a learning experience and captivated an interest such as in automation systems programming and assistance, electric panels assemble, complete projection of electrical systems and AutoCAD use for design, dimensioning and projection.
Alongside to this numerous works, I was involved in a main project which was the main subject of my master thesis. This project was a collaboration between Rolear.On and EasySensing – Intelligent Systems, Lda, a spin-off company of University of Algarve dedicated to intelligent control systems. The idea behind the partnership consisted in a concept for energy efficiency in buildings, namely hotel buildings, focused on energy monitoring using internet of things techniques and computational intelligence, for determination of the electricity consumption profile, and visualization of the relevant parameters. The optimization process would also involve a survey of habits and environment characteristics, that directly or indirectly, affect the energy consumption, finally resulting in proposals to optimize the consumption of those same behaviours, by ending or changing habits, or other relevant modifications.
Although the project had a promising start on an initial phase, slowly the process begin to gain some inertia in its development and failed to pass to the execution stage. Unexpectedly and not related to the project constraints, in the end of October 2017, an invitation appeared to
Chapter 2 – Rolear Internship
- 6 -
enter the Rolear Viva department, ending my time at Rolear.ON. Despite having been such a short period of time, it was, above all, a rewarding period of professional relations, acquired experience and new knowledges, that in a way, prepared me for what was coming next.
2.3 Rolear Viva Internship
In the end of October 2017, due to the invitation of Group Rolear CEO, Engº António Parreira Afonso and the Rolear Viva chief department, Rui Santana, the internship proceeded at Rolear Viva department. The Rolear Viva department is the Rolear Group, most recent sector, responsible for the commercialization of electricity and natural gas in the liberalized energy market. In the scope of this business unit of Rolear, there is multiple and distinct operations essential to the activity functioning, from the participation in energy markets for supply, management of the operations of energy transportation and delivery, balance sheets and other direct activities with the final customers – contracting, management and billing.
During my internship period in this department, I dedicated myself to the knowledge of the energy commercialization activity - electricity and natural gas, familiarization of the energy markets and all its organization and procedures, as well as, the knowledge of the activities already existing in the company associated with the energy purchase forecast for the elaboration of offers. In a point of view of familiarization with the field and to follow the evolutions of the sector, I accompanied the chief department and my company guide, Rui Santana, at numerous meetings organized by EDP Distribuição, in which issues related to the electricity comerciali- zation activity are presented and discussed, and also, an informative session organized by the OMIE, on a new intraday cross-border market (XBID), about to be implemented.
Following the change of department, became essential to reformulate the original concept of the thesis, that could adapt to the area of activity and that, in a way, could fill the existing needs. In this sense, the process of electrical energy purchase, that reveals a crucial process in the activity, became the main focus in the developing of this thesis. In a perspective of optimizing and technically assisting the procedure of energy purchase, in organized markets or by bilateral contracts, attending to the forecasts of the needs and characteristics of clients consumptions, a work was developed according to the guidance of Professor António Ruano.
This work is based on the application of algorithms of artificial neural networks for the consumption forecast of the clients list, defined by the specifications of the data availability
Chapter 2 – Rolear Internship
- 7 -
flow, between the different identities belonging to the national electricity sector. The concept of this work not only meets the possibilities of application in the present state of the sector, as well as, to follow the modernization trends of electrical smart grids and smart meters. This developed work can thus be seen as, a support tool for the participation on the Iberian market of electricity, or MIBEL, being that, from the forecasts of consumption of each client, it is possible to quantify the necessary purchasing energy to supply the entire client portfolio, reflecting in the minimum deviations and losses possible.
It was on the basis of this ideology that the work for the thesis in question was developed. The following chapters will describe in detail the hierarchy of the electricity sector, how the method of data availability is conceived in an energy supplier point of view, and how organized electricity markets works. The algorithms of neural networks are sustained in the functioning of this activity, in the present, and looking at the innovations to be implemented in a near future. The methodology applied will also be explained in the following chapters.
In addition, during this period, on my own initiative, I took a training course at the Rolear Academy on "Photovoltaic systems - Selfcomsuption ", besides that, I acquired several skills at the level of Web applications development. This acquired knowledges, that arise as personal interests, soon became possibilities to explore, for the future development of the work exposed in the present thesis.
- 8 -
Chapter 3
3.
National Electric System
In this chapter, a brief overview is made about the National electric sector, all its constituents and main parties involved, so that the reader can briefly understand the origin and evolution of the system, implemented hierarchy and the sequence of events from the production of the energy to its final customer consumption.
3.1 Background
Over the last 30 years, the national electric system (NES) has undergone a remarkable evolution from a structural, regulatory point of view and at the level of the properties of the assets involved. Previously, the national electric system had a vertically integrated structure in which a company, namely Electricidade de Portugal, EDP, encompassed all the different sectors from production to the relationship with the final customer. This type of vertical structure conditioned the electricity market, in the sense that there was no competition whatsoever in the business, acting based on a monopoly regime. In this business model, one company could own a set of captive clients who were limited in options, since they only had to stick to a single energy supplier and the services it provided.
Chapter 3 – National Electric System
- 9 -
Figure 3.1 – National electric system structure in the early days. [2][3]
Over the years, inevitably, the structure of this sector has undergone deep changes. Currently, the national electricity system is based on a set of activities performed by different entities, ranging from the relations with the suppliers cycles of production and selling, until the final distribution phase and commercialization to the consumers. The changes led to the establishment of a more competitive electricity market once a liberalized regime has been implemented in detriment of a monopolistic regime. This restructuring is due to the progressive implementation of a liberalized market with the beginning of the XXI century, namely in the creation of a common market of electricity between Portugal and Spain, or MIBEL – Iberian Electricity Market, which began to be established in November 2001 and started its full activity in July 2007 [8][9].
The emergence of the MIBEL and its liberalized regime, culminated in the need to dismantle the vertical structure of the national electricity system, being in the genesis of the emergence of several new agents in different sectors, with the most notable cases being the production and commercialization sectors, this way reflecting in an increase of competition and giving consumers a more active role taking in count the possibility to select the service provider entity. As a consequence, the liberalization of the electricity market and the emergence of new agents in different crucial sectors, there was simultaneously, a growing clear need to regulate the various activities – quality service, for example. All these alterations made the national electricity system and the electricity market a business subject to regulation and therefore, more transparent, with better services and with a more balanced sectorial organization. [3]
Chapter 3 – National Electric System
- 10 -
Figure 3.2 – Restructuration of the national electric system. [4]
3.2 NES value chain
The National Electricity System (NES) can now be synthesized through a value chain that integrates production, transportation, distribution, commercialization and in the end the final client, in which the production and commercialization activities practice their activities in an open competition regime, subject to obtaining the necessary licenses and approvals, while transportation and distribution activities operate by means of public concessions. All the different activities from the production to the commercialization in the value chain are subject to a regulation by a responsible entity, the Electricity Services Regulatory Entity (ERSE).
Figure 3.3 – National electric system value chain. [5]
Production • Ordinary Regime (ORP) • Special Regime (SRP) Transportation • National Transportation Network (NTN) Distribution • National Distribution Network (NDN) Commercialization • Regulated Market • Liberalized Market Final client • VHV • HV • MV • SLV • NLV
Chapter 3 – National Electric System
- 11 -
3.2.1 Production
The production of electricity is a fully liberalized activity that operates on a market-based logic and under free competition regime, through the granting of a license. The electricity production is carried out under an ordinary regime (ORP) or under a special regime (SRP). The production in ordinary regime, relies on hydroelectric power plants or power plants that use non-renewable energy sources, mainly coal and natural gas. The production in special regime is based on production using renewable energy sources or cogeneration (combined production of electricity and steam). [6]
3.2.2 Transportation
The activity of transporting electricity, in very high voltage (150, 220 and 400 kV), is carried out through the National Transport Network (NTN), by means of a concession granted by the Portuguese State, under a public service regime and of exclusivity to REN, Redes
Energéticas Nacionais. The concession includes the planning, construction, operation and
maintenance of the NTN, also covering the planning and global technical management of the national electricity system to ensure the harmonized operation of the infrastructures that integrate it, as well as, the continuity of service and security of the electricity supply. The NTN is interconnected with the Spanish grid in several places, allowing electricity exchanges with Spain, either for security or for supply reasons. These links improve the security and stability of the grid and supply of electricity, as well as, facilitate the commercial exchanges of electrical energy between both national systems, contributing to the integration of markets.
3.2.3 Distribution
The distribution of electric energy is based on the National Distribution Network (NDN), which allows a regulated activity that consists of routing through the distribution networks of electricity between the National Transmission Network (NTN) substations and the end points consumption. NDN, like the NTN, is operated through an exclusive concession granted by the Portuguese State to the subsidiary of the EDP group, EDP Distribuição. In the case of low voltage networks, the activity is carried out under concession contracts signed through public tenders launched by the municipalities, which are attributed almost entirely to EDP Distribuição, with the exception of a few local companies.
Chapter 3 – National Electric System
- 12 -
3.2.4 Commercialization
The activity of commercialization of electricity is free but is subject to the attribution of a license by the competent administrative entity, Directorate General for Energy and Geology, DGEG, which clarifies the list of rights and duties in the perspective of a transparent exercise of the activity. In the course of their business, energy suppliers agents can freely purchase and sell electricity, with the right of access to the transmission and distribution networks, however, by paying regulated tariffs in order to have the right of access to the transmission and distribution networks. In Portugal, consumers can, under market conditions, freely choose their energy supplier with no additional costs. There are two types of energy supplier agents to operate in the national electricity market: energy suppliers in the regulated market and energy suppliers in the liberalized market. Regulated market energy supplier agents, also called last resort energy suppliers (LRES), aim to ensure the supply of electricity to all consumers with low voltage installations with contracted power equal to or less than 41.4kW (NLV), being subject to a system of regulated tariffs and prices and are usually the only ones to offer prices subject to the tariff regime fixed by ERSE, namely transitional tariffs. In continental Portugal, the commercialization of last resort in electricity is ensured by EDP Serviço Universal and by a group of small distributors that act locally.
Energy suppliers in the liberalized market, share a competition regime in the electricity market, where they are free to set their own energy prices according to the competition rules and the ERSE regulatory entity. Due to the healthy competitive environment created by this method of free competition, the liberalized energy market allows consumers to choose their electricity supplier, opting for a solution that is more appropriate to their needs. In the liberalized marketing market, several companies, including Rolear Viva, compete with each other to attract the largest number of clients.
The fact that an energy supplier agent belongs to the liberalized market does not necessarily mean that it practices prices lower than those of the regulated market. The difference in the two is that in the regulated market, the energy supplier is obliged to charge prices according to the tariffs defined by ERSE, while in the liberalized market the energy suppliers are free to choose their prices, as long as the regulated tariffs for access to electrical networks are covered [7]. The choice of energy supplier is at the discretion of the consumer who may opt for the free market or regulated market. According to the directive n.º 348/2017, published in November 2017 by the government, until 2020, a consumer is free to choose between the
Chapter 3 – National Electric System
- 13 -
regulated market or liberalized market, but it is expected that from that date on, the regulated market will be extinguished and only the liberalized market will be implemented.
3.2.5 Final consumer
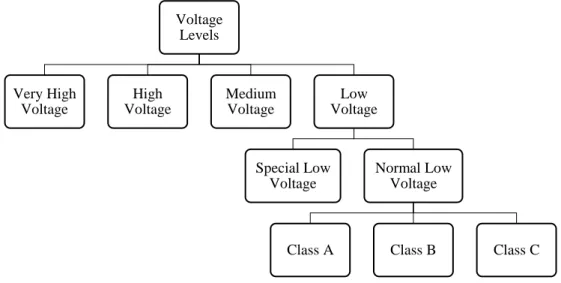
Depending on the needs and characteristics of the consumer type, a voltage level is assigned to them, in order to respond to their needs and match their dimensions. The following diagram shows the arrangement of the different voltage levels per customer:
Figure 3.4 – Different voltage levels assigned to the customers.
• Very High Voltage (VHV): Facilities such as the automobile, railway, pulp and mining industries. Voltage between phases greater than 110kV;
• High Voltage (HV): Steel industry, large hospitals, pulp industry, plastics industry, fertilizer industry, energy services, etc. Voltage between phases greater than 45kV and equal to or greater than 110kV;
• Medium Voltage (MV): Automotive components, metallurgy, molds, vitrification, large hotel industry, etc. Voltage between phases greater than 1kV and equal to or less than 45kV; Voltage Levels Very High Voltage High Voltage Medium Voltage Low Voltage Special Low Voltage Normal Low Voltage
Chapter 3 – National Electric System
- 14 -
• Low Voltage (LV): Residential customers, shops, offices and small businesses. Voltage between phases equal to or less than 1kV;
o Special Low Voltage (SLV): Supply in LV with power superior to 41.4kW;
o Normal Low Voltage (NLV): Supply in LV with power equal to or less than 41.4kW.
Clients of NLV level are further profiled according to consumption characteristics, based on contracted power and consumption of the previous twelve months. According to these characteristics three profiles are applied:
• Profile Class A for clients with contracted power exceeding 13.8kVA;
• Profile Class B for clients with contracted power equal to or less than 13.8kVA and annual consumption of the twelve months preceding the date greater than 7140kWh;
• Profile Class C for clients with contracted power equal to or less than 13.8kVA and annual consumption of the twelve months prior to the date equal to or less than 7140kWh.
- 15 -
Chapter 4
4.
Iberian Electricity Market
In the previous chapter the National electric system, the different sectors and the main agents were introduced. In this chapter, we intend to explain the concept of the liberalized market, as well as to demonstrate and describe the operation and structure of the Iberian market of electricity, or MIBEL.
4.1 Liberalized market
As described in the previous chapter, what we now know as the electricity market is due to an accumulation of changes, made over a vast period of years. From this gradual evolution, the concept of liberalized market emerged. According to ERSE document [10], the liberalized market can be defined as follows:
"The market is considered liberalized when several operators can compete freely in prices and commercial conditions, observing the rules of competition, the general law and the applicable regulations. The transport and distribution - as natural monopolies - remain activities carried out under a public and exclusive service regime, being guaranteed the access of third parties to the networks in conditions of transparency and non-discrimination."
Chapter 4 – Iberian Electricity Market
- 16 -
Based on this characterization and the ideals of a free market, the understanding between the governments of Portugal and Spain arose so that in a cooperation process, they could create a common market of electricity. The result of this joint effort was the Iberian Electricity Market, or MIBEL. The MIBEL was created with the purpose of promoting the integration of the electric systems of the two countries, in which, electrical energy transactions are carried out and financial instruments are traded that refer to this same energy. [11] For all the parties involved, the MIBEL still had several benefits as objectives in its formation, and the following should be highlighted: [12]
• Benefit consumers of electricity from both countries; • Structure the functioning of the liberalized market;
• Build a single reference price for the entire Iberian Peninsula;
• Provide free access to the market, in conditions of equality, transparency and objectivity;
• Favour the economic efficiency of companies in the electricity sector; • Promote free competition between them.
With the formation of this common market between the two countries of the Iberian Peninsula, it became possible for any energy supplier to purchase electricity in a regime of free competition.
4.2 MIBEL operation
The organized markets of MIBEL operate based on an Iberian exchange market of electricity settled on a single market operator, the Iberian Market Operator (IMO), held in equal shares by entities of both signatory states, with two poles:
• OMIP - Operator of the Iberian Energy Market (Portuguese Pole): which is responsible of managing the forward markets;
• OMIE - Operator of the Iberian Energy Market (Spanish Pole): which is responsible for managing the daily and intraday markets.
The liberalization of the electricity sector added the existence of organized markets, which are constituted as negotiation platforms tendentially independent of the traditional agents
Chapter 4 – Iberian Electricity Market
- 17 -
that operate in the activities of production and commercialization of electricity. The energy suppliers can purchase electrical energy from various forms of contracting:
• Next day trading market (daily market), which is subdivided into two types, daily and intraday markets. It is in these markets that the various proposals of sale (production) and purchase (commercialization) of electricity for the day after the negotiation are presented;
• Futures market (forward market), where futures commitments for production and purchase of electricity are stipulated. The forward market may carry out physical liquidation (sale of energy) or financial liquidation.
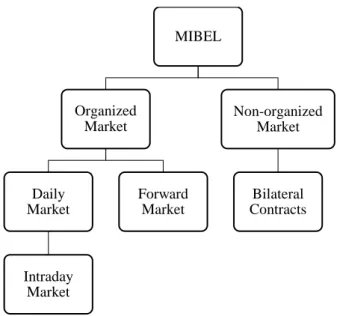
Within this segment of electricity contracts, but in another branch of MIBEL, there is also the non-organized market, characterized by the model of bilateral contracts. Bilateral contracts are a rigid model that guarantees the security of the price of electricity, since it is established by a physical contract and for a certain period. These types of contracts are permitted between all types of producers and other qualified agents and established the conditions under which energy suppliers and producers may sell energy previously acquired to other producers or external agents. One of the advantages of this model is the elimination of the risk associated with the price volatility in the stock market. [13][14]
MIBEL Organized Market Daily Market Intraday Market Forward Market Non-organized Market Bilateral Contracts
Chapter 4 – Iberian Electricity Market
- 18 -
4.2.1 Daily market
The daily market of MIBEL is the platform where electricity is transacted for delivery on the day after the negotiation. This market is priced for each of the 24 hours of each day (it can still be 23 or 25 hours for the particular case of the summer time change or winter time change) and for each one of the 365 or 366 days of each year. Every day the daily market platform is active until 12:00, when, at the close of the session, electricity prices are presented for the following day. Before this deadline, the energy proposals of purchase and sale are made, which will be in the origin of the value of the prices of electricity for each hour. The participation in the market is performed through a simple computer system that uses the internet, which enables the simultaneous participation of a large group of agents and the management of a large number of offers for the purchase and sale of electricity in a short period of time, as well as the preparation of economic settlements. [15]
This market operates through the crossing of offers - of purchase and sale - by the various agents registered to operate in that market, each offer indicating the day and time to which it relates, the price and the corresponding amount of energy. The market price of electricity for each hour is found through a process, in which the price offers of sale (supply curve) are ordered in an increasing way, and the price offers of purchase (demand curve) are ordered in a decreasing way. The market price will correspond to the intersection of the supply and demand curves, resulting in the lowest price that ensures that the supply satisfies the demand. This process is based on an algorithm approved for all European markets, the EUPHEMIA algorithm. [15]
Figure 4.2 – The crossing of purchase and sale offers originates the market price of electricity. This method is based on the Euphemia algorithm. [16]
Chapter 4 – Iberian Electricity Market
- 19 -
Regardless of the agents participating in the markets being in Spain or Portugal, the operation of the daily market implies that all buyers pay the same price and all sellers receive the same price, in what is called a single marginal price model. The operating rules of this organized market are specific to the market operator, OMIE.
In addition, since it is an Iberian market, constituted by Portugal and Spain, there may be circumstances where commercially available interconnection capacities between the two countries do not allow the cross-border flows of energy that cross-market offers would dictate. In case this occurs, the current market rules determine that the two market areas corresponding to Portugal and Spain are separated and that specific prices for each of the mentioned areas are found. The EUPHEMIA algorithm is then executed separately, in such a way that, a different price is defined for both countries. This mechanism is called market splitting or market separation. [15]
Chapter 4 – Iberian Electricity Market
- 20 -
4.2.2 Intraday market
Complementary to the daily market, there is the intraday market (sometimes called the adjustment market), which daily, through several sessions, allows to make adjustments in the quantities transacted in the daily market. The intraday market is structured in six daily trading sessions, with an operating base similar to that described in the daily market, where the volume of energy and price per hour are determined by the intersection between supply and demand. The distribution of times per session is as follows [17][19]:
• The first intraday session defines prices for the last 3 hours of the trading day and for the 24 hours of the day following the trading day;
• The second intraday session defines prices for the 24 hours the day after trading day;
• The third intraday session defines prices for the 20 hours between the hour 5 and the hour 24 of the day following the trading day;
• The fourth intraday session defines prices for the 17 hours between the hour 8 and the hour 24 of the day following the trading day;
• The fifth intraday session defines prices for the 13 hours between hour 12 and the hour 24 of the day following the trading day;
1st Session 2nd Session 3rd Session 4th Session 5th Session 6th Session Session opening 17:00 21:00 01:00 04:00 08:00 12:00 Session ending 18:45 21:45 01:45 04:45 08:45 12:45 Prices publication 20:45 23:45 03:45 06:45 10:45 14:45 Schedule horizon (time
periods) 27 hours (21-24) 24 hours (0-24) 20 hours (5-24) 17 hours (8-24) 13 hours (12-24) 9 hours (16-24)
Chapter 4 – Iberian Electricity Market
- 21 -
• The sixth intraday session defines prices for the 9 hours between hour 16 and the hour 24 of the day following the trading day.
The intraday market shares with the daily market the method of operation, based on the submission of offers, purchases and sales, by the various agents registered to act in the daily market, indicating each offer per session the day and hour, the corresponding price and quantity of energy. This type of market therefore gives a great versatility to the operation of the agents, allowing a very considerable degree of optimization, according to the needs of each agent, in a variety of time horizons and with the same guarantees in terms of transparency and possibilities of supervision which characterize the daily market.
4.2.3 Forward market
The forward market is a trading platform, which shares the same operating characteristics of MIBEL in daily markets but is distinguished by the establishment of electric energy purchase and sale contracts for a certain maturity in the future (week, month, trimester or year). In the scope of MIBEL and the agreements established for this market, the entity responsible for the management of the futures market is OMIP. In this way, OMIP offers the following instruments for the establishment of contracts [18]:
• Future Contracts: contract for the purchase or sale of energy for a certain time horizon, in which the buyer agrees to purchase electricity during the delivery period and the seller agrees to place the same electricity, at a price determined at the time of the transaction. Gains and losses resulting from price fluctuations during the negotiation phase in this type of contract are liquidated on a daily basis. According to OMIP, the most traded products in the futures market are Futures contracts.
• Forward contracts: a contract for the purchase or sale of energy for a certain time horizon, in which the buyer commits to purchase electricity during the delivery period and the seller agrees to place the same electricity, at a price determined at the time of the transaction. Contrary to the future contracts, in a Forward contract the
Chapter 4 – Iberian Electricity Market
- 22 -
gains and losses resulting from price fluctuations during the negotiation phase in this type of contract are liquidated on the days of physical or financial delivery.
• SWAP contracts: a contract in which a variable price position is exchanged for a fixed price position, or vice versa, depending on the direction of the exchange. Their function is to manage or take financial risk, not verifying the physical delivery of the product to which they refer, but only the liquidation of the corresponding margins.
- 23 -
Chapter 5
5.
Data Availability
In this chapter, it is described how data availability and information flow is accomplished between the different agents of the sectors and the energy supplier agent. It is still addressed the topic of the smart meter, and what kind of benefits it will bring, not only to the customers but also to the entire electricity business.
5.1 Information flow
For an efficient functioning of the electricity sector, the exchange of information and the availability of data plays an essential role, among the various agents of the NES value of chain. For this reason, there are responsibilities in each one of the sectors that need to be accomplished, in terms of providing relevant data for the sectors that relate. Regarding the commercialization sector, there is a mandatory flow of information between the energy supplier agent, the distribution network operator (DNO) and the transmission network operator (TNO). This information becomes crucial, not only for billing purposes, but essentially to the management of the client portfolio or for the definition of strategies for the participation in MIBEL.
One of the factors with a major relevance in the ease of data acquisition, is about the existence or not of telemetering. Nowadays, telemetering with data consumption records,
Chapter 5 – Data Availability
- 24 -
includes the totality of clients of the voltage level SLV, MV, HV and VHV, while, clients with voltage level NLV, do not have telemetering. In this case, estimates and average calculations according to a classification assigned are used, through records of the contracted power and the consumption of the last 12 months. This situation has been undergoing significant changes in recent years, due to technological innovations applied in the electrical grid, as we will see later in this chapter.
The data received by the energy supplier agent, comes with a mandatory daily and monthly frequency. Daily, it is possible to the energy supplier to receive consumption data referring to the previous day, but due to the particularity of the NLV client data daily available being based on estimates, there are monthly corrections of different levels sent, as actual real values are collected by the DNO. The energy supplier receives monthly 3 files in a period of nine months, namely one month after the consumption, three months after the consumption and nine months after the consumption. As these data files are received, they contain corrections and adjustments of the previous data files. Only nine months after the consumption, it is possible to the energy supplier to obtain the definitive data values of the complete client portfolio in that period.
Figure 5.1 – Periodicity of the availability of data.
In the following points, the informations to be supplied by the DNO and the TNO to the energy supplier agent are explained in more detail, according to the type of information, as well as the periodicity of availability and its respective content.
5.1.1 Individual data by delivery point (DPC)
On a daily and monthly basis, by the part of the DNO, consumption data of each individual DPC, belonging to the client portfolio of the energy supplier, with a sampling period of 15 minutes, on the day after the consumption (D+1) and on the month after the consumption
D • Day of consumption. D+1 • Day after consumption. M+1 • One month after consumption M+3 • Three months after consumption M+9 • Nine months after consumption
Chapter 5 – Data Availability
- 25 -
(M+1) are made available. As said before, this data depends directly on the existence of telemetering, that is, in client of a mainly business sector, SLV, MV, HV and VHV, real data values are made available equivalent to the actual consumption. In the majority of domestic clients, the NLV, in which the telemetering functionality does not exist, the data available are based on estimates and averages calculated by historical records. The data referring the NLV clients are separated by classes: NLV A, NLV B and NLV C.
Figure 5.2 – Periodicity and content type of the data made available by delivery point.
5.1.2 Data aggregated data by client portfolio
On a monthly basis, 3 types of consumption data are provided by the TNO: a consumption data file, corresponding to the previous month, M+1, also known as "Version 1", or V1, a consumption file corresponding to consumption three months before, referred to as "Version 2", or V2, and lastly, the consumption data file of nine months before, M+9, also designated as "Version 3", or V3. Each one of those file versions, corresponds to a correction of the previous version, and only Version 3 will contain definitive data. For SLV, MV, HV and
Data D+1, day after the consumption
Clients with telemetering: SLV, MV, HV, VHV
• Daily periodicity, on the day after consumption (D+1);
• Load diagram of one day of consumption, distributed in periods of 15 minutes, per DPC;
• Real data.
Clients without telemetering: NLV A, NLV B, NLV C • Daily periodicity, on the day after consumption (D+1);
• Load diagram of one day of consumption, distributed in periods of 15 minutes, per NLV class;
• Data estimated by the DNO.
Data M+1, month after the consumption
Clients with telemetering: SLV, MV, HV, VHV
• Monthly periodicity, in the first month following the consumption (M+1); • Load diagram of all the days of the month of consumption of the previous
month, distributed in periods of 15 minutes, per DPC; • Real Data.
Chapter 5 – Data Availability
- 26 -
VHV clients, the data entered in versions V1, V2 and V3 do not differ in anything from their D+1 values, since the readings are real and do not change.
The reason behind this method, is due to the fact that in NLV installations, it is not always possible to obtain cyclic readings with the periodicity required by the availability of data, so it is necessary to use calculations to determine the estimated consumption. As the cycle readings are being performed, the data is being updated and this is being transposed into the various data corrections, in the form of file versions (V1, V2 and V3), received by the energy supplier agents.
As opposed to daily data, this monthly data is distributed by hour, for each day of the month, of the reference month. In addition to this data, there is also information on the recording of hourly and daily electricity prices, as well as information on the deviations, by default and in excess, per unit of energy (MWh) and currency unit (€), of operations of purchase of electricity in MIBEL in the previous month, by the energy supplier.
Figure 5.3 - Periodicity and content type of the data made available for the complete client portfolio.
Data M+1, in the first month following the consumption (V1)
Clients aggregate: NLV A, NLV B, NLV C, SLV, MV, HV e VHV
• Monthly periodicity, in the first month following the consumption (M+1); • Load diagram of all the days of the month of consumption of the previous month, distributed by hour, of the clients aggregate of the energy supplier; • Estimated data based on average consumptions.
Data M+3, in the third month following the consumption (V2)
Clients aggregate: NLV A, NLV B, NLV C, SLV, MV, HV e VHV
• Monthly periodicity, in the third month following the consumption (M+3); • Load diagram of all the days of the month of consumption of three months
ago, distributed by hour, of the clients aggregate of the energy supplier; • Data calculated on the basis of all the existing definitive consumptions, and
in average consumptions for the remaining DPCs.
Dados M+9, in the ninth month following the consumption (V3)
Clients aggregate: NLV A, NLV B, NLV C, SLV, MV, HV e VHV
• Monthly periodicity, in the ninth month following the consumption (M+9); • Load diagram of all the days of the month of consumption of nine months
ago, distributed by hour, of the clients aggregate of the energy supplier; • Data calculated on the basis of definitive consumptions.
Chapter 5 – Data Availability
- 27 -
5.2 Smart meters
As mentioned previously, the fact that there are no telemetering conditions the quality of the data made available, since it is not always possible to the DNO to obtain cyclic readings at the frequency required by the availability of data, in which, alternatively, are used estimates using the historical records or the application of the annual consumption profiles. The fact that this happens, immediately conditions the energy supplier agent in the decision making, since the uncertainties generated by the estimates, lead to wrong decision making in the purchase of energy, in addition to conditioning the planning in the participation in the electricity markets.
In recent years, this situation has been changing with the gradual implementation of smart meters. Smart meters have emerged in recent years in Portugal, through the realization of intelligent electrical grids and energy efficiency projects, namely the InovGrid project, initiated in 2007, in Évora. The Smart Grid concept has revolutionized the way technical and commercial management of traditional electricity grids are conducted. This concept incorporates benefits of advanced communication and information technologies, in order to create an efficient network utilization and to provide real-time consumption information. [20]
This way, smart meters became a key element in the application of intelligent systems, since they act as the interface between the consumer and the rest of the electrical network, with the potential of, using the various sensors installed in the network, to be possible to feed information systems capable to manage and analyse large volumes of information. From the point of view, of the various users of the electricity network, among them the energy suppliers, this can be extremely useful regarding the possibility of managing and analysing big data systems, with a perspective to anticipate and predict consumption patterns, meaning a more efficient method for the participation in the electricity markets.
Currently, EDP Distribuição is in the process of replacing the conventional meters to smart meters, or Energy Box (EB). The EB’s are equipped with an interface HAN (Home Area Network) external module, that allows the access of data not only to the clients using the devices, but also to energy supplier agents. The information available ranges from the active and reactive energy every 15 minutes, active and reactive energy per tariff every 15 minutes, max active power taken, instantaneous values of energy, voltage, active power, power factor and frequency, as well as the load diagram. Contractual information is also made available like the configured time cycle and the contracted limited power, with the available functionality of changing the contractual parameters through the communication with the EB. The distribution
Chapter 5 – Data Availability
- 28 -
network operator, EDP Distribuição, is the owner of the devices, responsible for installing, maintaining and operating, while the energy supplier agent receives the data made available by the device and acts as an intermediary between the clients demands and needs, and the DNO respective operations.
Figure 5.4 – The smart meter, e-box, being installed by the EDP Distribuição. [21]
By the end of 2017, 1.3 million EB's were installed, and by the year 2020, the number is expected to increase until 3.4 millions corresponding to 60% of customers. Within the offer of new services to the energy suppliers, in addition to those already mentioned above, the following functionalities are included: [21][22]
• Consumer/production monitoring and energy efficiency services;
• New tariffs based on more granular consumption measures (hourly rates, prepaid); • Improved billing service (without estimates, multipoint clients).
- 29 -
Chapter 6
6.
ANN Theoretical Background
In the chapter 6, the reader is introduced to the general concepts of artificial neural networks (ANN) and a more focused explanation of a particular case of a neural network, a radial basis function neural network (RBFNN), used for the development of this work. The RBFNN training schemes, stopping criteria and the notion of multi objective genetic algorithms are also covered in this chapter.
6.1 Artificial Neural Network Concepts
The concept of artificial neural networks (ANN) was initially inspired by the operation of the brain and all its biological neuronal complexity. The basic component in a brain structure is the neuron. A neuron cell body is composed by a structure called dendrites connecting a nerve terminal, through a long axis called the axon. The nerve terminal is close to other neurons dendrites, forming junctions called synapses. These interconnections between neurons form a biological neural network circuitry. Neurons interact with each others by electrical signals, that propagate from the dendrites to the nerve terminal [23]. The figure 6.1 shows a biological neuron structure.
Chapter 6 – ANN Theoretical Background
- 30 -
Figure 6.1 – Biological neuron. [24]
Taking inspiration from the brain functionality, the concept of mimifying in an analogous way the brain behaviour has emerged, through a mathematical model capable of computational processing that follows the operations of a neuron. This concept of artificial neural network is characterized as an high adaptivity capability system, capable of a very efficient computational model, able to learn from examples and to generalize others never executed before. This artificial system is capable of carrying out autonomous learning, as well as pattern recognition, trainable and not directly programmable, standing out in applications where the solution is hardly achieved in regular programs and models. [25]
Due to artificial neural networks modelling complexity, there are several factors to be considered in terms of network topology, learning algorithms and properties, that impact in a good neural network performance.
![Figure 3.1 – National electric system structure in the early days. [2][3]](https://thumb-eu.123doks.com/thumbv2/123dok_br/18724567.919065/21.892.217.654.123.381/figure-national-electric-structure-early-days.webp)
![Figure 3.2 – Restructuration of the national electric system. [4]](https://thumb-eu.123doks.com/thumbv2/123dok_br/18724567.919065/22.892.181.736.116.476/figure-restructuration-national-electric.webp)
![Figure 6.2 – Example of a neural network with x m inputs, one neuron and one output. [26]](https://thumb-eu.123doks.com/thumbv2/123dok_br/18724567.919065/42.892.234.661.861.1112/figure-example-neural-network-x-inputs-neuron-output.webp)
![Table 6.1 – Most common activation functions. [23][25]](https://thumb-eu.123doks.com/thumbv2/123dok_br/18724567.919065/44.892.221.673.102.640/table-most-common-activation-functions.webp)
![Figure 6.3 - Example of a RBF neural network with x m inputs and N neurons. [26]](https://thumb-eu.123doks.com/thumbv2/123dok_br/18724567.919065/45.892.221.667.102.439/figure-example-rbf-neural-network-inputs-n-neurons.webp)