760
Effect of a specific concurrent water and dry-land
training over a season in young swimmers’
performance
Jorge E Morais1,5, António J Silva2,5,Daniel A Marinho3,5,Mário C Marques3,5, Tiago M Barbosa4,5
1Polytechnic Institute of Bragança, Bragança, Portugal
2University of Trás-os-Montes and Alto Douro, Vila Real, Portugal 3University of Beira Interior, Covilhã, Portugal
4National Institute of Education, Nanyang Technological University, Singapore 5Research Centre in Sports, Health and Human Development, Vila Real, Portugal
Abstract
The aims of this study were to assess over a full season: (i) the effect of a combined dry-land strength and conditioning and in-water program on the swimming performance of young swimmers; (ii) the effect of such program on the performance determinants; (iii) the effect of the training periodization designed. A longitudinal research design assessing an age-group of young swimmers over a season was carried out. Methods: Twenty-seven young swimmers (12 boys: 13.55±0.72-y; 15 girls: 13.16±0.93-y; both sexes in Tanner stages 2-3) were evaluated in three moments over 40 weeks. The 100-m freestyle performance, body mass, height, arm span (anthropometrics), stroke frequency, stroke length, swimming velocity, intracyclic swimming velocity (kinematics), stroke index, propelling efficiency (efficiency), squat jump, countermovement jump, and throw velocity (strength and conditioning) were assessed. A cluster analysis was computed to classify the swimmers. For the “talented” swimmers, the performance and all determinants, but the squat and countermovement jumps improved between the first and last evaluation moments. Both in-water and dry-land strength and conditioning features were responsible for the cluster discrimination in each one of the evaluation moments. All three clusters were also characterized by a mix of technical and strength & conditioning features. This highlights swimming performance as a holistic phenomenon (i.e. multiple determinants) where shifting occur in the interplay among the performance determinant according to the training periodization.
Key words: swimming, strength and conditioning, technique, training periodization
1. Introduction
Sports performance depends on the nature (genetics) and nurture (environment) of the athletes (Davids and Baker, 2007). A few years ago, the literature was updated with the
761
addition of the relationship and contribution of the natural condition of athletes to the performance and technical abilities that are inherent to each sport (Davids et al., 2008). Thus, it seems that a set of intrinsic (anthropometrics and genetic profile, among others) and extrinsic (technique and training) features that are sports-specific enables one to achieve a better performance more effectively (Ford et al., 2011).
Competitive swimming is a holistic phenomenon based on the interaction of several features from different scientific fields (Barbosa et al., 2010). As it happens in other youth sports (e.g. Vaz et al., 2015), young swimmers’ performance analysis is based on identifying the main determinants that allow the swimmers to enhance their performance. Such determinants are mainly related to stroke mechanics (e.g. stroke length, stroke frequency and swimming velocity) (Vitor and Bohme, 2010; Jurimae et al., 2007), and to anthropometrics (Morais et al., 2013; Geladas et al., 2005). Furthermore, it is suggested that the contribution of such determinants is related to the training program designed (Morais et al., 2014). I.e., over a competitive season, the features that are responsible/related to the performance enhancement in the first evaluation moment may not be the same later on, a few months later (Morais et al., 2014). Added to that, little is known about the contribution of concurrent in-water and dry-land (i.e. S&C) programmes to enhance the swimming performance (Garrido et al., 2010). At these early ages most coaches design dry-land S&C programmes that are underpinned by callisthenic routines. There are a few reasons justify this kind of S&C programmes. Planning and conducting the sessions is reasonably straightforward. The equipment needed is affordable. At these ages the main goal is to build-up general strength and power. Young swimmers are still under growth and maturation processes. Therefore, the external training load should be adjusted intrinsically (i.e. encompassing the overcome of their own body weight).
762
Research on the performance of young swimmers is mainly based on anthropometrics, kinematics, and hydrodynamics because these features are strongly related to such performance (Jürimäe et al., 2007; Geladas et al., 2005; Vitor and Böhme, 2010). Thus far, it seems that the literature provides no deep insights on the role played by S&C sessions, with researchers having designed cross-sectional (Bencke et al., 2002; Nasizarde et al., 2014) or longitudinal studies with a very limited time frame (8 weeks) (Garrido et al., 2010). New trends in research among young swimmers emphasize the relationships that should be established between the external and the internal workload over time (Morais et al., 2014). Moreover, no studies in the literature adopt a longitudinal design with repeated measures over a full competitive season, which could provide insights on the relationship of S&C and in-water training with performance and its determinant factors.
Therefore, the aims of this study were to assess over a full season: (i) the effect of a combined dry land S&C and in-water program on the swimming performance of young swimmers, (ii) the effect of a combined program on the performance determinants, and (iii) the effect of the training periodization design. Overall, it was hypothesized that a positive effect of the combined training would be verified, and that, in each evaluation moment, different features would have a significant contribution to the performance. Further, the performance enhancement would be related to the training periodization.
2. Method
2.1. Participants
Twenty-seven young swimmers (12 boys: 13.55±0.72 years-old, 15 girls: 13.16±0.93 years-old; both sexes in Tanner stages 2-3) participating on a regular basis in regional and national events were recruited. At baseline, the swimmers had 3.67±0.73 years of training experience.
The coaches and/or parents, as well as the swimmers, gave their consent for participation in this study. All procedures were in accordance to the Helsinki Declaration regarding research involving human subjects.
2.2. Study design
A longitudinal research study was carried out, with the swimmers evaluated in three moments (Figure 1). The in-water training program included 7.14±1.11-week training sessions over a 40-week testing period. The swimmers swam a mean distance of 37.97±6.31 km weekly and 7.59±1.57 km per training session (including warm-up: A0; slow pace: A1 – between aerobic threshold and anaerobic threshold; medium pace: A2 –
between the anaerobic threshold and VO2max; intense pace: A3 – VO2max; and recovery and technical drills). Table 1 shows the in-water training periodization and volume (mean per week, in km) over the season.
763
mountain climbers. In the second macro-cycle (April-July), the drills increased to 30 secs per station, and two more stations were added: tricep push-ups and resistance tube exercises (upper limbs).
Table 1. In-water training volume over the season (in km).
Oct Nov Dec Jan Feb Mar Apr May Jun Jul
A0 8.05 10.34 11.00 15.48 12.73 9.35 8.99 14.24 12.15 7.00 A1 13.60 13.80 13.70 13.00 12.30 12.80 10.30 12.40 11.90 9.00 A2 7.00 10.80 7.90 11.50 9.50 7.00 5.70 10.20 9.80 8.25 A3 3.50 6.40 5.30 6.80 7.00 4.80 4.30 8.00 8.30 5.50
Total 32.15 41.34 37.90 46.78 41.53 33.95 29.29 44.84 42.15 29.75
A0 – warm-up and recovery pace; A1 – pace between aerobic threshold and anaerobic threshold; A2 – pace between the anaerobic threshold and VO2max; A3 – VO2max pace.
2.3. Performance
A 100-m freestyle official event at a regional or national short course swimming pool was chosen as the performance outcome. The time lag between the official race and the data collection was no longer than 15 days.
2.4. Anthropometrics
Body mass (BM), height (H), and arm span (AS) were selected as anthropometric variables. The swimmers wore a textile swimsuit, a swim cap, and goggles. The body mass was measured in the upright position with the use of a digital weighting scale (SECA, 884, Hamburg, Germany), and the height in the anthropometric position from the vertex to the floor with the use of a digital stadiometer (SECA, 242, Hamburg, Germany). The arm span was measured in the upright position, with the arms and fingers fully extended in the lateral abduction at a 90º angle with the trunk. The distance between the third fingertips of each hand was measured with flexible anthropometric tape (Rosscraft, Canada) (ICC=0.99).
2.5. Kinematics and efficiency
Stroke frequency (SF), stroke length (SL), swimming velocity (v), and intracyclic swimming velocity (dv) were selected as kinematic variables; stroke index (SI) and
propelling efficiency (ηp) were chosen as efficiency variables. After a standardized warm-up, each swimmer performed three maximal freestyle swim trials (25-m) with a push-off start. The swimmers were given a 30-minute rest to recover from each trial. For further analysis, the average value of the three trials was calculated (ICC=0.95).
A speedometer cable (Swim speedo-meter, Swimsportec, Hildesheim, Germany) was attached to the hip of each swimmer. A 12-bit resolution acquisition card (USB-6008; National Instruments, Austin, Texas, USA) was used to transfer data (f=50 Hz) from the
764
The swimming velocity (v, in m· s-1) was calculated during the middle 15-m (between the 5th and 20th meters) as: v=d/t. The stroke frequency (SF, in cycles· min-1 and afterward converted to Hz)was measured with a stroke counter (base 3) by two expert evaluators (ICC=0.97). The stroke length was calculated as SL=v/SF (Craig and Pendergast, 1979). The intracyclic swimming velocity (dimensionless) was quantified by using the coefficient of variation: dv=CV=standard deviation/mean (Barbosa et al., 2010). The efficiency variables were estimated by applying the kinematics data. The stroke index (SI, in m2· s-1) was calculated as: SI=v*SL (Costill et al., 1985). The propelling efficiency (ηp, in %) was estimated as reported elsewhere (Zamparo et al., 2005).
2.6. Strength and conditioning
The squat jump (SJ) and countermovement jump (CMJ) were selected to evaluate the muscle power of the lower limbs (in which the vertical height was registered), and the medicine ball throwing velocity (TV) to assess that of the upper limbs. The swimmers had a standardized dry land warm-up (including the jumps and ball throwing) (Garrido et al., 2010). Three repetitions of each test was done, and the average of the two best trials was selected for further analysis (Garrido et al., 2010). The squat jump (ICC=0.96) and the countermovement jump (ICC=0.91) were performed on a contact mat (Ergojump Digitime 1000; Digitest, Jyvaskyla, Finland), with both hands on the waist throughout the exercise (Maté-Muñoz et al., 2014).
The throwing velocity (TV) was measured by using a Doppler radar gun (ATS II, Stalker, Texas, USA), placed 1-m behind the swimmers at the projection height (ICC=0.92). The swimmers were instructed to keep both feet parallel and at shoulder width while throwing the medicine ball (1-kg mass and 0.72-m circumference) (Van Den Tillar and Marques, 2011).
2.7. Data analysis
Sample power was calculated for an α error probability of 0.05, effect size of 0.40, and a power (1-β) of 0.95 for ANOVA repeated measures (within factors) suggesting a total
sample of 30 participants (GPower, v.3.1.7, University of Kiel, Kiel, Germany).
Kolmogorov-Smirnov and Levene’s tests were used to analyze the normality and homocedasticity assumptions, respectively. The means, one standard deviations, and standardized z-scores were obtained as descriptive statistics.
Cluster analysis was applied to identify subgroups of swimmers (fastest pace, “talented”;
765
Total eta square (2) was selected as the effect size index. Discriminant analysis (stepwise method) was used to validate the clusters in each moment, comparing the classification of the original results and the predicted group memberships (P<0.05) (Barbosa et al., 2014).
Swimmers’ changes between clusters were assessed by cross-tabulating the cluster solutions at different moments (Morais et al., 2015).
3. Results
From the data computed, three clusters were obtained: cluster 1 (fastest swimmers –
named “talented”); cluster 2 (intermediate swimmers – named “proficient”); cluster 3 (slowest swimmers – named “non-proficient”).
An enhancement in performance was observed between the first (M1) and last (M3) evaluation moment, for all clusters (cluster 1: 3.32%; cluster 2: 7.72%; cluster 3: 2.21%). Overall, the anthropometrics increased between the first (M1) and the last (M3) evaluation moment, for all clusters. The kinematics and efficiency showed the same trend of improvement, except for the stroke length at the intermediate moment (M2) in cluster 2 (-1.83%). The swimmers in clusters 2 and 3 also showed a slight decrease in the propelling efficiency (ηp) from the first (M1) to the last (M3) moment (cluster 2: -1.34%; cluster 3: -1.47%) (Table 2). The S&C features (i.e. throwing velocity, squat jump and countermovement jump) increased between the first (M1) and the last moment (M3). However, the swimmers in cluster 1 had a decreased squat jump and countermovement jump height between the first (M1) and the last (M3) moment (squat jump: -21.42%; countermovement jump: -16.12%). All clusters showed the best jump performances at the intermediate moment (M2).
At the three moments, the swimmers in cluster 1 (“talented”) were shown to be the fastest, those in cluster 2 as intermediate (“proficient”) swimmers, and those in cluster 3 as the slowest (“non-proficient”) (Table 2). The variables that better discriminated the clusters differed among the three moments. The stroke index (SI), swimming velocity (v), and squat jump (SJ) had the highest F-ratios (F=14.82, P<0.001; F=12.32, P<0.001; and F=11.s18, P<0.001, respectively) and thus also the highest discrimination effect at the first evaluation moment (M1) (Table 2). The arm span (AS) (F=12.39; P<0.001), the throwing velocity (TV) (F=12.32; P<0.001), and the height (H) (F=11.45; P<0.001) at the intermediate moment (M2). The stroke frequency (SF) (F=15.32; P<0.001), the height (H) (F=9.03; P=0.001) and the swimming velocity (v) (F=8.42; P=0.002) at the last evaluation moment (M3). These data indicate that swimming performance is a holistic phenomenon in which a constant shift in the interplay between determinant factors from different domains (anthropometrics, kinematics, and S&C) happens.
766
767
Table 2. Descriptive statistics of the performance and its determinants by cluster membership, during the three evaluation moments.
M1
Cluster 1 (N=7) Cluster 2 (N=9) Cluster 3 (N=11)
Mean±1SD z Mean±1SD z Mean±1SD z F2,24 P η2
BM [kg] 58.37 ± 4.86 0.4377342 50.92 ± 5.96 -0.4304615 50.43 ± 8.34 -0.4870877 3.95 0.033 0.22
H [cm] 168.57 ± 7.61 0.4951045 160.44 ± 7.32 -0.4293163 159.36 ± 5.80 -0.5522550 4.94 0.016 0.27
AS [cm] 174.00 ± 5.42 0.5233146 164.16 ± 7.46 -0.4568620 162.45 ± 6.13 -0.6275244 9.60 0.001 0.39
SF [Hz] 0.88 ± 0.05 0.6391381 0.82 ± 0.08 -0.0701107 0.79 ± 0.06 -0.4938177 3.12 0.062 0.23
SL [m] 1.70 ± 0.06 -0.0308560 1.67 ± 0.15 -0.2821894 1.69 ± 0.10 -0.0787000 5.31 0.012 0.03
v [m·s-1] 1.49 ± 0.07 0.7568939 1.37 ± 0.08 -0.3956602 1.34 ± 0.07 -0.6269423 12.32 <0.001 0.41
dv [dimensionless] 0.08 ± 0.02 -0.3910711 0.10 ± 0.03 0.4054046 0.09 ± 0.03 -0.2178017 8.82 0.001 0.11
SI [m2·s-1] 2.54 ± 0.16 0.4302393 2.28 ± 0.28 -0.4172258 2.27 ± 0.20 -0.4391234 14.82 <0.001 0.24
ηp [%] 29.01 ± 0.49 -0.1958939 29.48 ± 3.53 -0.0386410 31.06 ± 2.58 0.4883786 10.78 <0.001 0.12
SJ [m] 0.34 ± 0.06 0.9387736 0.25 ± 0.02 -0.4110306 0.24 ± 0.03 -0.5981314 11.18 <0.001 0.50
CMJ [m] 0.36 ± 0.05 0.7351068 0.28 ± 0.03 -0.3894186 0.26 ± 0.03 -0.6852638 11.16 <0.001 0.52
TV [m·s-1] 7.58 ± 0.28 0.8073033 6.44 ± 0.92 -0.3375494 6.07 ± 0.81 -0.7104336 8.18 0.002 0.43
768
M2
Cluster 1 (N=8) Cluster 2 (N=7) Cluster 3 (N=12)
Mean±1SD z Mean±1SD z Mean±1SD z F2,24 P η2
BM [kg] 57.34 ± 4.07 0.1944651 56.30 ± 5.45 0.0655803 50.14 ± 7.99 -0.7004757 9.74 0.001 0.24
H [cm] 169.31 ± 6.44 0.3889177 166.92 ± 3.66 0.1116386 158.58 ± 6.46 -0.8590113 11.45 <0.001 0.44
AS [cm] 173.31 ± 5.96 0.3235918 169.85 ± 4.97 -0.0188006 161.83 ± 7.34 -0.8138824 12.39 <0.001 0.42
SF [Hz] 0.86 ± 0.07 0.2084317 0.84 ± 0.04 -0.0655904 0.83 ± 0.06 -0.2638191 0.75 0.479 0.06
SL [m] 1.75 ± 0.11 0.3849760 1.67 ± 0.06 -0.2348170 1.63 ± 0.11 -0.4809466 3.12 0.062 0.22
v [m·s-1] 1.51 ± 0.07 0.6213460 1.41 ± 0.07 -0.2797043 1.35 ± 0.07 -0.7741511 8.95 0.001 0.48
dv [dimensionless] 0.07 ± 0.01 -0.4576674 0.10 ± 0.01 0.7518822 0.07 ± 0.02 -0.266972 9.24 0.001 0.28
SI [m2·s-1] 2.66 ± 0.19 0.5876206 2.34 ± 0.16 -0.3587636 2.22 ± 0.20 -0.7193871 11.23 <0.001 0.52
ηp [%] 30.17 ± 2.10 0.0537560 29.56 ± 2.76 -0.1969948 30.51 ± 2.24 0.1926364 3.57 0.044 0.03
SJ [m] 0.43 ± 0.10 0.4276593 0.35 ± 0.08 -0.4279922 0.38 ± 0.09 -0.1141424 1.86 0.176 0.10
CMJ [m] 0.44 ± 0.10 0.2128648 0.38 ± 0.09 -0.3894184 0.41 ± 0.09 -0.0206033 1.32 0.285 0.05
TV [m·s-1] 7.64 ± 0.63 0.5061948 7.13 ± 0.96 -0.0645067 6.49 ± 0.50 -0.7880758 12.32 <0.001 0.38
769
M3
Cluster 1 (N=6) Cluster 2 (N=9) Cluster 3 (N=12)
Mean±1SD z Mean±1SD z Mean±1SD z F2,24 P η2
BM [kg] 60.80 ± 5.04 0.6343795 50.72 ± 5.83 -0.6207146 52.82 ± 7.36 -0.3588331 6.81 0.005 0.32
H [cm] 173.58 ± 5.16 0.7828760 163.77 ± 4.59 -0.3859539 161.54 ± 6.33 -0.6525002 9.03 0.001 0.53
AS [cm] 177.16 ± 4.19 0.6190174 168.77 ± 5.61 -0.2230693 163.62 ± 7.58 -0.7403114 6.54 0.005 0.51
SF [Hz] 0.86 ± 0.04 0.0898384 0.90 ± 0.07 0.6007676 0.81 ± 0.07 -0.5641510 15.32 <0.001 0.25
SL [m] 1.77 ± 0.07 0.3241833 1.64 ± 0.09 -0.5109133 1.69 ± 0.15 -0.2175713 8.17 0.002 0.14
v [m·s-1] 1.53 ± 0.09 0.5349407 1.48 ± 0.06 0.1447845 1.36 ± 0.05 -0.9427758 8.42 0.002 0.57
dv [dimensionless] 0.08 ± 0.01 -0.0446414 0.07 ± 0.02 -0.3091832 0.08 ± 0.02 0.0347211 0.02 0.978 0.03
SI [m2·s-1] 2.71 ± 0.25 0.4977976 2.44 ± 0.15 -0.2625523 2.30 ± 0.26 -0.6584721 5.22 0.013 0.36
ηp [%] 29.47 ± 1.84 -0.1453319 29.09 ± 2.71 -0.2969873 30.61 ± 2.81 0.3069777 3.49 0.047 0.08
SJ [m] 0.28 ± 0.05 0.2008723 0.28 ± 0.02 0.0050699 0.25 ± 0.01 -0.6424768 2.67 0.089 0.19
CMJ [m] 0.31 ± 0.02 0.2596389 0.29 ± 0.03 -0.2017168 0.27 ± 0.02 -0.5930273 6.36 0.006 0.21
TV [m·s-1] 7.89 ± 0.85 0.5139729 7.32 ± 0.66 -0.1330752 6.82 ± 0.49 -0.7147810 4.59 0.020 0.34
PERF [s] 61.72 ± 3.97 -0.5802553 63.73 ± 3.76 -0.2223681 70.37 ± 3.16 0.9601640 6.04 0.007 0.57
BM – body mass; H – height; AS – arm span; SF – stroke frequency; SL – stroke length; v – swimming velocity; dv – intracyclic swimming velocity; SI – stroke index; ηp – propelling efficiency; SJ – squat jump; CMJ – countermovement jump; TV – throwing velocity; PERF –
770
In terms of a qualitative study, the discriminant analysis showed good/very good cluster compactness/separation at all three moments, with 74%, 85%, and 85% of the original groups correctly classified at the first (M1), intermediate (M2), and, last moment (M3), respectively.
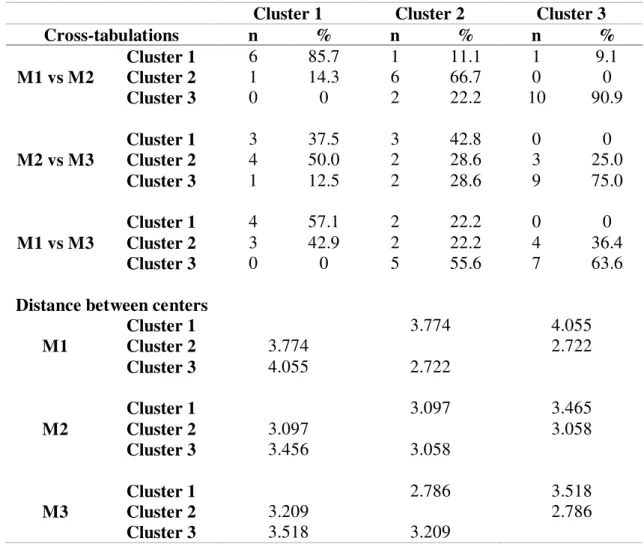
Table 3 presents the cluster membership. In all the cross-tabulations (M1vsM2, M2vsM3, and M1vsM3), cluster 3 consistently showed the highest stability (ranging from 63.6% at M1vsM3 to 90.9% at M1vsM2), followed by cluster 1 (ranging from 37.5% at M2vsM3 to 85.7% at M1vsM2) and, finally, by cluster 2 (ranging from 22.2% at M1vsM3 to 66.7% at M1vsM2). The highest stability for all clusters (less swimmers’ changes between
clusters) was between M1vsM2, whereas the lowest was between M1vsM3 (Table 3).
Table 3. Clusters’ stability and distance between clusters’ centers, between all evaluation moments.
Cluster 1 Cluster 2 Cluster 3
Cross-tabulations n % n % n %
Cluster 1 6 85.7 1 11.1 1 9.1
M1 vs M2 Cluster 2 1 14.3 6 66.7 0 0
Cluster 3 0 0 2 22.2 10 90.9
Cluster 1 3 37.5 3 42.8 0 0
M2 vs M3 Cluster 2 4 50.0 2 28.6 3 25.0
Cluster 3 1 12.5 2 28.6 9 75.0
Cluster 1 4 57.1 2 22.2 0 0
M1 vs M3 Cluster 2 3 42.9 2 22.2 4 36.4
Cluster 3 0 0 5 55.6 7 63.6
Distance between centers
Cluster 1 3.774 4.055
M1 Cluster 2 3.774 2.722
Cluster 3 4.055 2.722
Cluster 1 3.097 3.465
M2 Cluster 2 3.097 3.058
Cluster 3 3.456 3.058
Cluster 1 2.786 3.518
M3 Cluster 2 3.209 2.786
Cluster 3 3.518 3.209
4. Discussion
771
and on-land variables influenced the discrimination of clusters at each evaluation moment, according to the training periodization designed.
The swimmers were gathered in one of the three clusters according to the determinants of the cluster formation. Cluster 1 included the fastest swimmers (“talented”) at all moments, cluster 2 the medium swimmers (“proficient”), and cluster 3 the slowest (“no
n-proficient”) (Table 2) swimmers. At M1, the determinants of the clustering were the stroke index (SI), swimming velocity (v), and the squat jump (SJ). At the beginning of the season, the aim is the build-up of the aerobic basis. This means that the swimmers are submitted to high volumes, based on aerobic sets, improvement of the swim efficiency, and dry-land S&C. At the first moment (M1), the clusters were characterized by different determinants (cluster 1: a high squat jump, throwing velocity, and swimming velocity; cluster 2: a high intracyclic swimming velocity and a low stroke index and swimming velocity; cluster 3: a high propelling efficiency and a low arm span and throwing velocity). Some studies have reported that the fastest swimmers, besides having better nature aspects (high body dimensions), also have better kinematics (i.e., swimming velocity) compared to their slower counterparts (Barbosa et al., 2014; Morais et al., 2013). However, little is known about the role of S&C programs in this regard. The swimmers in cluster 1 had the highest body dimensions and kinematics, although S&C variables were the main determinants of the cluster formation. One study showed that the fastest age-group swimmers had a significantly higher thickness and fascicle length for several muscles (Nasirzade et al., 2014). This difference in the muscle morphology and architecture could be related to higher strength and, ultimately, better performance. The swimmers in cluster 2 had poorer kinematics, along with a high intracyclic swimming velocity (dv). Swimming velocity, and consequently performance, is negatively affected by a high intracyclic swimming velocity (dv) (Barbosa et al., 2013). The swimmers in cluster 3 had shorter anthropometrics (i.e. arm span). The performance of young swimmers is strongly related to anthropometric features (Geladas et al., 2005; Jürimäe et al., 2007). Swimmers with higher body dimensions (cluster 1) were also found to achieve better performances in the S&C tests (Table 2).
At the intermediate moment (M2), the arm span (AS), throwing velocity (TV), and height (H) were the main determinants of the cluster discrimination. After the first preparation stage (overall build-up; Table 1), the swimmers begin a more specific preparation that includes particular training sets (in-water and dry land S&C) related to the events they are to enter at one of the major competitions of the season. In freestyle swimming, the upper limbs are responsible for about 90% of the total workout (Deschodt et al., 1999). At least in adult swimmers, there is a strong relationship between the strength and power of the upper limbs and the sprinting performance (Hancock et al., 2014; Hawley et al., 1992). The swimmers in cluster 1 (“talented”) were characterized not only by high kinematics (swimming velocity and stroke index) but also by a high throwing velocity (S&C). The “proficient” swimmers (cluster 2) maintained their overall features, including a high intracyclic swimming velocity (dv). However, a high body mass (BM) and height (H) were also responsible for the cluster discrimination. Therefore, it seemed that at that moment, the “proficient swimmers” relied more on anthropometrics to enhance their
772
At the end of the season (M3), the swimmers tend to polish and taper from all the work done. Therefore, the stroke kinematics (stroke frequency and swimming velocity) and height (H) were the best cluster discriminators. The reports in the literature consistently indicate that anthropometrics and kinematics are strongly related to the performance of young swimmers (Barbosa et al., 2014; Mezzaroba and Machado, 2014; Vitor and Böhme, 2010), with the fastest swimmers having better kinematics (Morais et al., 2013; Tsalis et al., 2012). The “talented” swimmers (cluster 1) presented a well-rounded set of determinants, which included being the tallest (height, anthropometrics), fastest (swimming velocity, kinematics) and strongest (throwing velocity, upper limb S&C). Hence, besides the well-known anthropometrics and kinematics, S&C programs play a major role (Garrido et al., 2010). On the other hand, the swimmers in both cluster 2
(“proficient”) and cluster 3 (“non-proficient”) were characterized mainly by their kinematics. Those in cluster 2 had a short stroke length (SL) but a high stroke frequency (SF); thus, despite having a low stroke length (SL), these swimmers improved their swim velocity based on the stroke frequency (SF). On the other hand, the swimmers in cluster 3 were characterized by poor kinematics (stroke frequency and swimming velocity).
Regarding the cluster membership, the “non-proficient” swimmers (cluster 3) had the highest stability; i.e., this cluster had lowest number of swimmers crossing over to another cluster. Cluster 3 was followed by the “talented” (cluster 1) and the “proficient” (cluster
2) swimmers (Table 2). The “non-proficient” swimmers had fewer changes over the season (63.6% for M1vsM3). The nature-nurture phenomenon presents quite a challenge for coaches, athletes, and researchers. The training can be designed such that young swimmers are able to improve their performance, highlighting the nurture aspect of swimming. However, this is not quite enough for these swimmers to shift to a faster cluster. The reason for this may be their nature traits. The swimmers in cluster 1
(“talented”) showed moderate stability (57.1% for M1vsM3); three swimmers shifted (dropped) to cluster 2 between the first (M1) and the last moment (M3) (Table 3). Thus,
it seems that the number of “talented” swimmers tends to decrease from the beginning to the end of the season; although three dropped to a lower cluster, another two shifted from cluster 2 to cluster 1. This is in line with the rationale that each swimmer has his/her own rate of development (Durand-Bush and Salmela, 2002), which, combined with training, plays an important role in the final outcome. The swimmers in cluster 2 (“proficient”)
showed the lowest stability (22.2% for M1vsM3), with a higher number of swimmers shifting either to a higher (two swimmers) or a lower (five swimmers) cluster during the season (M1vsM3) (Table 3).
Main findings highlight how a well-designed periodization including concurrent in-water and dry-land training helps young swimmers to excel. The changes on the role played by each in-water and dry-land variable was due to the periodization design put in place over the season. Dry-land S&C enables young swimmers to build-up strength and power. This S&C enhancement might help to improve the swim kinematics and kinetics, having these two a direct effect on the performance. Over a season, different genetic (anthropometrics) and nurture traits (in-water and dry-land features) were responsible for the swimmers’
773
5. Conclusions
Young swimmers’ performance and its determinants improved over the season.
Performance showed to be a multifactorial phenomenon, where different in-water and dry-land variables were responsible for the clusters discrimination in each evaluation moment. The strength and power variables also contributed for the cluster discrimination having an effect on the performance that was mediated by the in-water kinetics and kinematics. The changes on the roleplayed by each in-water and dry-land variable was due to the periodization design put in place over the season.
6. References
Aspenes, S., Kjendlie, P. L., Hoff, J., and Helgerud, J. (2009), Combined strength and endurance training in competitive swimmers, Journal of Sports Sciences. 8,
357-365.
Barbosa, T. M., Bragada, J. A., Reis, V. M., Marinho, D. A., Carvalho, C., and Silva, A. J. (2010), Energetics and biomechanics as determining factors of swimming performance: Updating the state of the art, Journal of Science and Medicine in Sport. 13(2), 262-269.
Barbosa, T. M., Morouço, P. G., Jesus, S., Feitosa, W. G., Costa, M. J., Marinho, D. A., Silva, A.J. and Garrido, N. D. (2013), The interaction between intra-cyclic variation of the velocity and mean swimming velocity in young competitive swimmers, International Journal of Sports Medicine. 34, 123-130.
Barbosa, T. M., Morais, J. E., Costa, M. J., Gonçalves, J., Marinho, D. A., and Silva, A. J. (2014). Young swimmers’ classification based on kinematics, hydrodynamics, and anthropometrics, Journal of Applied Biomechanics. 30, 310-315.
Bencke, J., Damsgaard, R., Saekmose, A., Jorgensen, P., Jorgensen, K., and Klausen, K. (2002), Anaerobic power and muscle strength characteristics of 11 years old elite and non-elite boys and girls from gymnastics, team handball, tennis and swimming, Scandinavian Journal of Medicine and Science in Sports. 12,
171-178.
Craig, A. B., and Pendergast, D. (1979), Relationships of stroke rate, distance per stroke and velocity in competitive swimming, Medicine and Science in Sports. 11,
278–283.
Costill, D. L., Kovaleski, J., Porter, D., Kirwan, J., Fielding, R., and King, D. (1985), Energy expenditure during front crawl swimming: Predicting success in middle-distance events, International Journal of Sports Medicine. 6, 266-270.
Davids, K., and Baker, J. (2007), Genes, environment and sport performance, Sports Medicine. 37(11), 961-980.
Davids, K., Button, C., and Bennett, S. J. (2008), Dynamics of skill acquisition: A constraint-led approach. Champaign, Illinois: Human Kinetics.
Deschodt, V. J., Arsac, L. M., and Rouard, A. H. (1999), Relative contribution of arms and legs in humans to propulsion in 25-m sprint front-crawl swimming, European Journal of Applied Physiology. 80, 192-199.
774
Ford, P., De Ste Croix, M., Lloyd, R., Meyers, R., Moosavi, M., Oliver, J., Till, K. and Williams, C. (2011), The long-term athlete development model: Physiological evidence and application, Journal of Sports Sciences. 29(4), 389-402.
Garrido, N. D., Marinho, D. A., Barbosa, T. M., Costa, A. M., Silva, A. J., Pérez-Turpin, J. A., and Marques, M.C. (2010), Relationships between dry land strength, power variables and short sprint performance in young competitive swimmers, Journal of Human Sport and Exercise. 5(2), 240-249.
Garrido, N. D., Silva, A. J., Fernandes, R. J., Barbosa, T. M., Costa, A. M., Marinho, D. A., and Marques, M.C. (2012), High level swimming performance and its relation to non-specific parameters: A cross-sectional study on maximum handgrip isometric strength, Perceptual Motor Skills. 114(3), 936-948.
Geladas, N. D., Nassis, G. P., and Pavlicevic, S. (2005), Somatic and physical traits affecting sprint swimming performance in young swimmers, International Journal Sports and Medicine. 26, 139-144.
Girold, S., Maurin, D., Dugué, B., Chatard, J. C., and Millet, G. (2007), Effects of dry-land vs. resisted- and assisted-sprint exercises on swimming sprint performances,
Journal of Strength and Conditioning Research. 21, 599-605.
Hancock, A. P., Sparks, K. E., and Kullman, E. L. (2014), Post-activation potentiation enhances swim performance in collegiate swimmers, Journal of Strength and Conditioning Research. 29(4), 912-917.
Hawley, J. Á., Williams, M. M., Vickovic, M. M., and Handcock, P. J. (1992), Muscle power predicts freestyle swimming performance, British Journal of Sports Medicine. 26, 151-155.
Jürimäe, J., Haljaste, K., Cicchella, A., Lätt, E., Purge, P., Leppik, A., and Jürimäe, T. (2007), Analysis of swimming performance from physical, physiological and biomechanical parameters in young swimmers, Pediatric Exercise Science. 19,
70-81.
Maté-Muñoz, J. L., Monroy, A. J., Jodra Jiménez, P., and Garnacho-Castaño, M. V. (2014), Effects of instability versus traditional resistance training on strength, power and velocity in untrained men, Journal of Sports Science and Medicine.
13, 460-468.
Marinho, D. A., Barbosa, T. M., Costa, M. J., Figueiredo, C., Reis, V. M., Silva, A. J., and Marques, M. C. (2010), Can 8-weeks of training affect active drag in young swimmers?, Journal of Sports Science and Medicine. 9, 71-78.
Mezzaroba, P. V., and Machado, F. A. (2014), Effect of age, anthropometry, and distance in stroke parameters of young swimmers, International Journal of Sports Physiology and Performance. 9, 702-706.
Morais, J. E., Garrido, N. D., Marques, M. C., Silva, A. J., Marinho, D. A., and Barbosa, T. M. (2013), The influence of anthropometric, kinematic and energetic variables and gender on swimming performance in youth athletes, Journal of Human Kinetics. 39, 203-211.
Morais, J. E., Marques, M. C., Marinho, D. A., Silva, A. J., and Barbosa, T. M. (2014), Longitudinal modeling in sports: Young swimmers’ performance and biomechanics profile, Human Movement Science. 37, 111-122.
775
Morouço, P., Marinho, D. A., Fernandes, R. J., and Marques, M. C. (2015), Quantification of upper limb asymmetries in front crawl swimming, Human Movement Science. 40, 185-192.
Nasirzade, A., Ehsanbakhsh, A., Ilbeygi, S., Sobhkhiz, A., Argavani, H., and Aliakbari, M. (2014), Relationship between sprint performance of front crawl swimming and muscle fascicle length in young swimmers, Journal of Sports Science and Medicine. 13, 550-556.
Paul, D. J., Nassis, G. P., Whiteley, R., Marques, J. B., Kenneally, D., and Chalabi, H. (2014), Acute responses of soccer match play on hip strength and flexibility measures: Potential measure of injury risk, Journal of Sports Sciences. 32(13),
1318-1323.
Rein, R., Button, C., Davids, K., and Summers, J. (2010), Cluster analysis of movement patterns in multiarticular actions: A tutorial, Motor Control. 14, 211–239.
Tsalis, G., Toubekis, A. G., Michailidou, D., Gourgoulis, V., Douda, H., and Tokmakidis, S. P. (2012), Physiological responses and stroke-parameter changes during interval swimming in different age-group female swimmers, Journal of Strength and Conditioning Research. 26, 3312-3319.
Van Den Tillaar, R., and Marques, M. C. (2011), A comparison of three training programs with the same workload on overhead throwing velocity with different weighted balls, Journal of Strength and Conditioning Research. 25, 2316-2321.
Vaz, L., Figueira, B., and Gonçalves, B. (2015), Classifying youth rugby union players by training performance, International Journal of Performance Analysis in Sport. 15(1), 159-171.
Vitor, F. M., and Böhme, M. T. (2010), Performance of young male swimmers in the 100 meters front crawl, Pediatric Exercise Science. 22, 278–287.
Zamparo, P., Pendergast, D. R., Mollendorf, J., Termin, A., and Minetti, A. E. (2005), An energy balance of front crawl, European Journal of Applied Physiology. 94,