Article
Printed in Brazil - ©2017 Sociedade Brasileira de Química0103 - 5053 $6.00+0.00*e-mail: [email protected]
Determination of Hg in Biological Samples and Ethanol Fuel by Photochemical
Vapor Generation after Pre-Concentration in a Gold Trap
Eliezer Q. Oreste,a Richard M. de Oliveira,a Anderson S. Ribeiro,a Talal S. Mahmoudb
and Mariana A. Vieira*,a
aPrograma de Pós-Graduação em Química, Laboratório de Metrologia Química,
Universidade Federal de Pelotas (UFPel), 96010-900 Capão do Leão-RS, Brazil
bCentro de Estudos do Mar, Universidade Federal do Paraná (UFPR),
AC Pontal do Paraná, 80060-000 Pontal do Sul-PR, Brazil
In this work, the photochemical vapor generation (PVG) coupled with atomic absorption spectrometry and a pre-concentration step with an Au column was used for the determination of Hg in biological samples and ethanol fuel. PVG with pre-concentration showed an up to 250-fold higher sensitivity compared to the approach without pre-concentration. The accuracy of analysis of biological samples was evaluated using certified reference materials (fish tissues), while for ethanol fuel samples, recovery tests were employed (91%). Analytical curves were linear (R > 0.99) in the studied range of 2.5 to 10 µg L-1 for conventional PVG and 0.2 to 0.5 µg L-1 for PVG with the pre-concentration step. For the last, the limits of detection reached for biological samples and ethanol fuel were 0.02 and 0.01 µg L-1, respectively. The systems presented are simple, sensitive and safe for the control of low Hg concentrations in different samples. However, only the system using pre-concentration with an Au column was capable of obtaining the reproduced signals of Hg in low concentrations of the order of 0.2 µg L-1.
Keywords: mercury, biological samples, ethanol fuel, photochemical vapor generation
Introduction
Mercury (Hg) is a toxic element and its introduction to the environment is mainly related to anthropogenic activities. When Hg comes into contact with aquatic environments, they can suffer methylation. This process is the result of the bacterial action that converts inorganic Hg into its organic form, methylmercury (MeHg), which is the more toxic form. Thus, the organic species of Hg can be easily absorbed through biological lipid membranes of fish and become bioaccumulative. Due to this fact, Hg can easily enter the human food chain by ingestion of fish and has neurotoxic potential when it interacts with the central nervous system.1-3
In addition to exposure via ingestion of contaminated food, there are other ways in which Hg interacts with humans and the environment. Among them, Hg can be released into the atmosphere by automobiles from the combustion of fuels, making it a significant source of pollution. Besides Hg, others elements such as As, Cd, Fe,
Mn, P, Pb and V can be released during the combustion.4,5
However, the determination of metals in fuel is difficult due to the fact that their concentrations are generally low as fuel is a result of a distillation process. Furthermore, the validation of the proposed methodologies is not appropriate due to the absence of certified reference materials with concentration values for Hg.6
One interesting factor is that in March 2003, vehicles with flexible engines were introduced to the Brazilian market. Thus, these vehicles can operate on gasoline or ethanol fuel, or a mixture of both fuels in any proportion. Since then, about 40% of the vehicles in Brazil have been using ethanol as fuel. This can contribute in an increase of metals released during the combustion, affecting the quality of fuel.7,8
Ultraviolet (UV) radiation has been successfully used as an alternative to chemical reduction and also promotes the reduction of metal ions in various vapor species.13 This
results in an increase of the number of elements that can be detected by vapor generation techniques. Guo et al.11
were the first researchers to report the analytical application of photochemical vapor generation (PVG) using UV radiation for reduction. In the presence of formic acid, SeIV was converted by UV irradiation to volatile selenium
species, such as SeCO and SeH2, which were then rapidly
transported to a heated quartz tube atomizer (QTA) for detection by atomic absorption spectrometry.
For promoting the photochemical reduction, a photochemical reactor constructed with a low cost UV source can be used. The samples in the presence of low molecular weight (LMW) organic acids are exposed to UV radiation in this photochemical reactor, resulting in the formation of photolysis products and intermediate reducing radicals, which are responsible for the formation of volatile species.PVG presents various advantages, such as not requiring the use of unstable reducing reagents and introducing interference during the reactions, making the method simple and environmentally friendly, in addition to the expanded number of detectable elements.13-18 In relation
to Hg, PVG has been applied for the determination of this analyte in biological14 and geological samples,19 petroleum
and naphta,20 ethanol fuel,21 cosmetics22 and glycerin,23
among others.
Due to the low Hg concentrations found in most samples, the total separation of analyte from the matrix, followed by the use of a pre-concentration step, can increase the sensitivity of detection of the analyte. Thus, the limits of detection (LOD) can reach ultra-trace levels (ng L-1).24,25
It is known that Hg has a high affinity for Au, through the formation of an amalgam, mainly in mining processes.26
Recently, some studies have shown that different species of mercury (Hg0, Hg2+ and CH
3Hg+) are easily adsorbed and
desorbed in the structure of Au when high temperatures are applied, thus making easier the determination of Hg.27,28
Some applications of pre-concentration of Hg in Au columns (gold traps) followed by determination using atomic spectrometry techniques have been reported in the literature. Puanngam et al.29 used pre-concentration in a gold trap for the
determination of Hg in natural waters by CV AAS. Zierhut et al.25 described the determination of Hg species (Hg0, Hg2+
and CH3Hg+) on gold nanostructures directly from aqueous
solutions of natural waters by cold vapor atomic fluorescence spectrometry (CV AFS). Duarte et al.30 proposed a method
for the determination of Hg species in fish samples using chemical vapor generation (CVG) and pre-concentration on a gold gauze placed into a graphite tube and determination by
graphite furnace atomic absorption spectrometry (GF AAS). However, the application of PVG with pre-concentration in a gold trap has not yet been explored for the determination of Hg in a complex matrix, such as biological or fuel samples. Only two applications for water samples have been found.31,32
Based on these points, the goals of this work are to evaluate PVG with and without a pre-concentration step using an Au column for the determination of Hg in biological samples and ethanol fuel, and to compare their figures of merit.
Experimental
Instrumentation
The measurements of Hg were carried out with a AA-6300 atomic absorption spectrometer (Shimadzu, Japan) equipped with deuterium lamp for background correction and a Hg hollow cathode lamp (Hamamatsu Photonics K.K., Japan). The operational conditions were: wavelength, 253.7 nm; spectral band pass, 0.7 nm; lamp current, 6 mA. All measurements were made in continuous mode. A QTA of 14.7 cm in length and 2.4 mm in diameter was mounted in the spectrometer’s flame compartment, positioned in the optical path and maintained at room temperature. Argon, with a purity of 99.996% (Linde, Brazil), was used as the carrier gas.
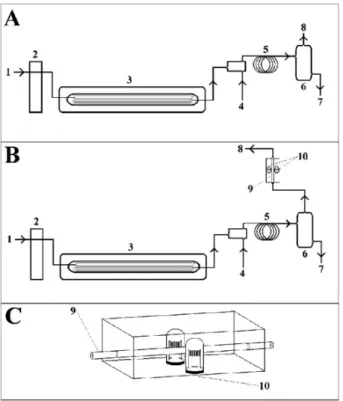
Two photochemical vapor generation set-ups coupled to a cold vapor atomic absorption spectrometer were used in this work, one with pre-concentration in a gold trap and one without. A photochemical reactor using a low pressure Hg vapor UV lamp (254 nm, 15 W, Cole Parmer, USA) was constructed. Samples were pumped through a quartz tube (2 mm i.d. × 3 mm o.d. × 200 cm long) placed in parallel around the lamp. The resulting internal volume was 26.0 mL. A peristaltic pump (Ismatec, Cole Parmer, USA) delivered the samples to the reactor. A 43.1 mL min-1
flow of Ar purge gas was introduced into a gas-liquid separator where it merged with the effluent from the UV photoreactor, transporting the volatile species directly to the QTA. Figure 1A schematically illustrates the system used. The gas flow rate was controlled by a flow meter (Cole Parmer, USA).
was activated for the cooling system, leaving it ready for a new cycle. The samples were weighed in a microbalance Ohaus Adventurer AR 2140 (Pine Brook, USA) with a precision of (0.0001 g). An ultrasonic bath (Model Q335D, Quimis, Brazil) was used.
Reagents and samples
Analytical grade reagents were used in all experiments. All solutions were prepared using deionized water obtained by a water distiller MA078 (Marconi, Brazil), subsequently deionized by passing through a column CS1800 (Permution, Brazil). A stock solution (1000 mg L-1) of inorganic
mercury was prepared by dissolution of a Titrisol ampoule (Merck, Germany) in 0.5% (v/v) HNO3. Standard solutions
containing 1000 mg L-1 of CH
3Hg+ and 400 mg L-1 of
C2H5Hg+ were prepared by dissolution of methylmercury
chloride (Fluka Analytical, Germany) and ethylmercury chloride (Analytical Supelco, USA), respectively, in bidistilled ethanol. Formic acid 85% (v/v) (Synth, Brazil) and ethanol 99.5% v/v (Synth, Brazil) were used as photochemical reagents. Both reagents were purified by sub-boiling distillation in a quartz system (Marconi, model MA-075, Brazil). The real concentration of formic acid was determined using acid-base titration with NaOH
solution and phenolphthalein as indicator. The result was 82.0% (v/v) and this value was used for the calculation of concentration of solutions.
The following certified reference materials (CRMs) were used to evaluate the accuracy: DOLT-4 (dogfish liver) and DORM-3 (dogfish muscle) from the National Research Council Canada (NRCC, Canada). Ethanol fuel samples were acquired at a local gas station in Pelotas City, Brazil.
Sample preparation procedures
Biological samples were treated with formic acid for their solubilization based on the procedure described by Vieira et al.14 and Scriver et al.33 For this procedure,
approximately 250 mg of samples were weighed into polyethylene flasks and 10 mL of 82.0% (v/v) HCOOH was added. The mixture was then placed in an ultrasonic bath at 40 °C for approximately 3 h to accelerate the solubilization process. After cooling, the flask was filled to a volume of 50 mL with deionized water. Before analysis, the samples were diluted with deionized water until concentration of 4.8% (v/v) HCOOH.
Ethanol fuel samples were prepared based on the procedure described by Silva et al.21 An aliquot of 25 mL
of ethanol fuel was transferred to a polyethylene flask and 2.9 mL of 82.0% (v/v) HCOOH was added. The volume was completed to 50 mL with deionized water, resulting in a final concentration of 50% (v/v) ethanol fuel and 4.8% (v/v) HCOOH.
Methodology
The main operating parameters of the PVG system with and without pre-concentration in a gold trap were optimized.
A conventional PVG-CV AAS system was applied only for the determination of Hg in biological samples and the obtained results were compared with those from PVG-CV AAS with pre-concentration on a gold trap system. The samples of ethanol fuel were analyzed using PVG-CV AAS with pre-concentration and the results were compared with those obtained by Silva et al.21
Conventional PVG-CV AAS
The following parameters were investigated: the influence of the HCOOH concentration, the irradiation time of the solutions to UV radiation and the carrier gas flow rate. All these studies were carried out in an aqueous medium with the addition of 10 µg L-1 Hg2+, CH
3Hg+
and CH3CH2Hg+. Subsequently, analytical curves were Figure 1. Schematic of the experimental systems: (A) photochemical
constructed in a linear range of 2.5 to 10 µg L-1 in order to
evaluate the figures of merit for different species of Hg. For instrumental measurements, 50 mL of each sample or standard solution was introduced into a quartz tube wrapped with UV light through a peristaltic pump. Subsequently, the sample solution from the photochemical reactor was directly mixed in a point of confluence with a flow of Ar gas and introduced into the GLS, where the volatile species formed were then directed to the QTA.
PVG-CV AAS with pre-concentration
For both samples, only the effect of the carrier gas flow rate was evaluated. This is an important parameter in pre-concentration systems because the gas is responsible for transporting the Hg vapor that is released from the Au column to the QTA. This study was conducted with solutions containing 0.25 µg L-1 Hg2+. For this system,
the irradiation time used was 2.7 min, considering the maximum speed of rotation of the peristaltic pump, due to the fact that all generated vapor was pre-concentrated in the Au column.
For instrumental measurements, the process was similar to that previously described for conventional PVG-CV AAS. The reading time of the signal, which is measured as integration area, was 120 s with a delay time of 45 s until the appearance of the signal, totaling 165 s of pre-concentration system heating and reaching a temperature of approximately 350°C for desorption.
For biological samples, the analytical curves were prepared in 4.8% (v/v) HCOOH, while for ethanol fuel, the analytical curves were prepared in 4.8% (v/v) HCOOH and 50% (v/v) bidistilled ethanol. Earlier studies showed that the presence of ethanol together with HCOOH improve the sensitivity of the analytical curve.
Results and Discussion
Effect of HCOOH concentration (conventional PVG-CV AAS)
The efficiency of PVG in promoting the reduction of Hg and other elements depends on the type and concentration of low molecular weight acid in the solution. Formic acid is typically employed for PVG due to its ability to generate volatile species when combined with some elements, such as Hg. This study is extremely important for biological samples as usually have a high proportion of organic Hg species, thereby a method capable of determining the total concentration of Hg, a toxic element, is required. The effect of HCOOH on the absorbance signal of Hg0 was investigated in the range of
0.48 to 19.3% (v/v) using standard solutions containing
10 µg L-1 of Hg species (Hg2+, CH
3Hg+ or CH3CH2Hg+).
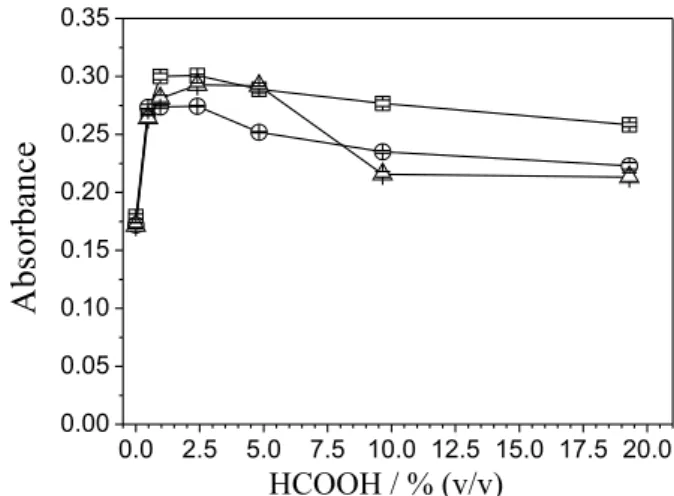
Figure 2 illustrates the results.
According to the results shown in Figure 2, it is observed that at HCOOH concentrations up to 2.4% (v/v), there is an increase of the absorbance signal for the solutions containing all species of Hg. From 4.8% (v/v) HCOOH onwards, a decrease of the signal for CH3CH2Hg+
occurs.However, at high concentrations, 19.3% (v/v), there is a decrease of the signal, mainly for the organic species of Hg, showing a decreasing tendency with increasing concentrations of HCOOH. The signal of Hg2+, CH
3Hg+
and CH3CH2Hg+ decreased approximately 10.5, 11.5 and
26.9%, respectively, from 4.8 to 19.3% (v/v) HCOOH. It was also noted an efficiency of generation of Hg0 from
organic Hg species in the HCOOH medium. Thus, the concentration of 4.8% (v/v) HCOOH was chosen, even with a slight decrease of signal in comparison with the concentration of 2.4% (v/v) HCOOH.
Effect of irradiation time (conventional PVG-CV AAS)
The dose of UV radiation that the solutions and samples receive in the photochemical reactor determines the gain of radical formation and the efficiency of Hg reduction. The irradiation time or exposure time in the PVG system is obtained by altering the speed of the peristaltic pump. The effect of irradiation time was investigated for all species of Hg with a standard solution containing 10 µg L-1 of Hg2+, CH
3Hg+
or CH3CH2Hg+ in 4.8% (v/v) HCOOH. The irradiation time
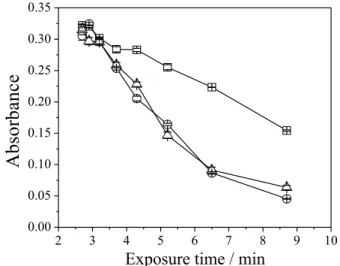
ranged from 8.7 to 2.7 min (interval of speed pump from 30 to 99 rpm). It should be noted that the largest pump speed of rotation provides a lower exposure time to the UV radiation solutions. Figure 3 illustrates the results obtained. Figure 2. Effect of formic acid concentration on absorbance signal obtained by PVG-CV AAS from solutions containing 10 µg L-1 of different species of Hg. () Hg2+, () CH
According to Figure 3, increasing the speed of rotation of the peristaltic pump promotes an increase in the intensity of the absorbance signal for the three Hg species investigated. This is due to the largest sample flow rate through the photochemical reactor, causing an increased amount of radicals to be produced and therefore a more efficient reduction in Hg. A longer period of exposure time promotes a decrease in the absorbance signal and other reactions as a re-oxidation of Hg can occur.34,35
Considering the three species of Hg investigated, there is a stronger similarity in absorbance signal at 3.2 min of irradiation time (sample flow rate of 8 mL min-1).
Although the maximum pump speed generates a more intense analytical signal, a longer time is required for signal stabilization at the baseline after each instrumental measurement, leading to a higher consumption of cleaning reagent (10.0% (v/v) HCOOH). This high concentration of HCOOH to the cleaning was used to ensure that all Hg could be dragged, without the risk of any specie to remain in the line, avoiding memory effects in subsequent determinations. Thus, a time of 3.2 min was chosen for subsequent studies.
Effect of gas flow rate (conventional PVG-CV AAS)
Another important parameter during PVG is the flow rate of carrier gas. Argon was introduced into the gas-liquid separator, where it merged with the effluent from the UV photochemical reactor stripping Hg0 from
the liquid phase and transporting it directly to the QTA. Figure 4 shows the results obtained for standard solutions containing 10.0 µg L-1 of different species of Hg in 4.8%
(v/v) HCOOH.
With the increase of gas flow rate, the signal has a tendency to decrease for all species of Hg. This fact is related to the dilution of the atomic cloud that reaches the QTA. Thus, a flow rate of 43.1 mL min-1 was selected
because in this condition, intense and similar analytical signals to all species of Hg can be evaluated.
Effect of gas flow rate (PVG-CV AAS with pre-concentration)
Based on the previous studies reported by Silva et al.,21
as there is no difference in the sensitivity between the different species of Hg, experiments using PVG-CV AAS with pre-concentration were performed only with a standard solution containing Hg2+. For this system, the optimization
of the argon flow rate is very important because it is responsible for transporting the vapor of Hg previously pre-concentrated in the Au column to the QTA. Figure 5 shows the results.
For the interval of 62.6 to 95.4 mL min-1 of Ar flow rate,
the absorbance signal remained constant. However, from 95.4 mL min-1 there is a decrease of the signal, possibly
due to rapid dispersion and dilution of the atomic cloud for higher flow rates. Thus, the flow rate adopted for further studies was 83.7 mL min-1 as it presented a high intensity
of the analytical signal and showed a higher precision compared with other flow rates investigated for this system.
Figures of merit and applications
Table 1 summarizes the experimental parameters after optimization for conventional PVG-CV AAS and PVG-CV AAS with pre-concentration.
For analysis of biological samples, the analytical curves were constructed using calibration standards of Hg2+ in Figure 3. Effect of irradiation time on absorbance signal obtained by
PVG-CV AAS from solutions containing 10 µg L-1 of different species of Hg. () Hg2+, () CH
3Hg+ and (∆) CH3CH2Hg+ in 4.8% (v/v) HCOOH. Gas flow rate: 43.1 mL min-1.
Figure 4. Effect of gas flow rate on absorbance signal obtained by conventional PVG-CV AAS from solutions containing 10 µg L-1 of different species of Hg. () Hg2+, () CH
4.8% (v/v) HCOOH and for ethanol fuel, the calibration standards were prepared in 4.8% (v/v) HCOOH plus 50% (v/v) bidistilled ethanol. Figures of merit obtained for the determination of Hg in biological samples and ethanol fuel using both systems are summarized in Table 2.
The results showed that the pre-concentration system has a higher sensitivity in comparison to the conventional PVG system and this fact allows us to construct analytical curve at low concentrations and achieve lower limits of detection, as observed for biological samples.
Although PVG CV-AAS with pre-concentration presents a lower limit of detection, the order of magnitude of the values is the same when compared with the values obtained for the conventional system. The limit of detection was calculated as three times the standard deviation of
ten measurements of the analytical blank divided by the slope of the analytical curve. As the sensitivity achieved by the pre-concentration system is high, the value of the limit of detection is affected by the high value of standard deviation because there is a variation between the instrumental measurements due to high detectability achieved by the system. The standard deviation values obtained for PVG-CV AAS and with pre-concentration were 0.00865 and 0.02241 for ethanol fuel and biological sample, respectively.
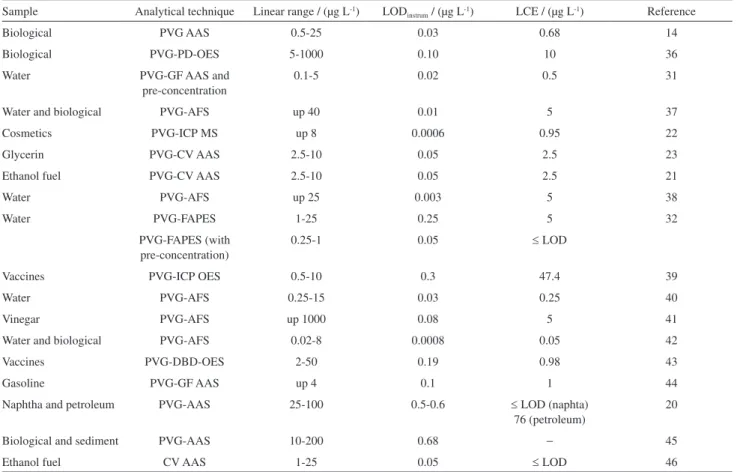
In order to compare the figures of merit obtained in this work, after a review of the literature, we found similar works and the findings are summarized in Table 3. In relation to the linear range and limits of detection presented, the pre-concentration system coupled to PVG used in this study allowed the calibration to be performed with standards solutions with low concentrations of Hg (0.2 µg L-1) and to obtain lower limits of detection, a
fact which was not observed for most previous studies. Thus, it is evident that the pre-concentration of Hg in an Au column associated with PVG is feasible and provides signals to real concentrations for < 1.0 µg L-1 using atomic
absorption spectrometry. This fact has not been reported experimentally, and until this moment, the determination of the real concentration of Hg in ethanol fuel samples has not been possible, as can be seen in the literature.
The accuracy of the conventional PVG system and with pre-concentration for the determination of total Hg in biological samples was evaluated by analyzing two CRMs. The results presented in Table 4 for concentrations of total Hg are in agreement with the certified values, considering a 95% level of confidence, for both systems. For PVG with pre-concentration, the relative standard deviations were < 11.0%, showing a slightly lower precision when compared with conventional PVG. This can occur due to the need of a dilution step to adjust the calibration range of the system. Despite this, both systems can be used to control Hg in biological samples.
For the determination of Hg in ethanol fuel, one sample was acquired at a local gas station in Pelotas City. In the absence of a CRM for this kind of sample, Figure 5. Effect of gas flow rate on absorbance signal obtained by
PVG-CV AAS with pre-concentration in solutions containing 0.25 µg L-1 of Hg2+ in 4.8% (v/v) HCOOH.
Table 1. Experimental parameters used for the two systems
Parameter Conventional
PVG-CV AAS
PVG-CV AAS with pre-concentration
Irradiation time / min 3.2 2.7
Speed of peristaltic pump / rpm 80 99
Sample flow rate / (mL min-1) 8 9.6
Gas flow rate / (mL min-1) 43.1 83.7
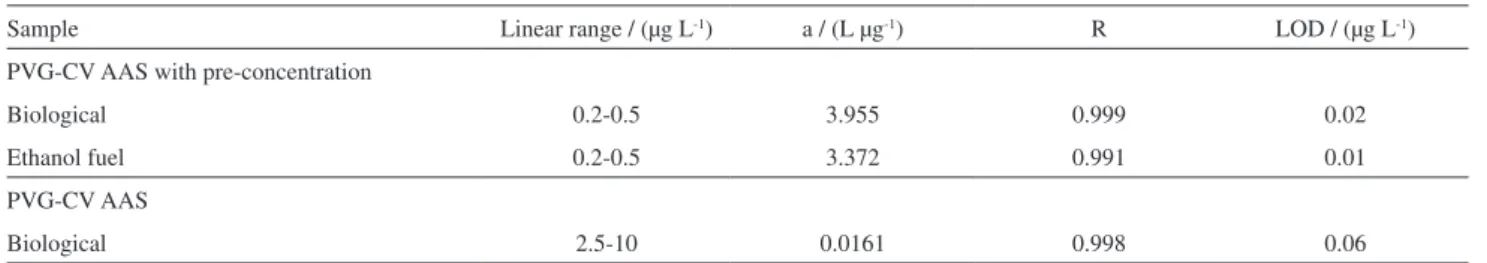
Table 2. Figures of merit for analytical curves used for the determination of Hg total
Sample Linear range / (µg L-1) a / (L µg-1) R LOD / (µg L-1)
PVG-CV AAS with pre-concentration
Biological 0.2-0.5 3.955 0.999 0.02
Ethanol fuel 0.2-0.5 3.372 0.991 0.01
PVG-CV AAS
which contain values for the control of Hg, the accuracy was evaluated by recovery tests. The result for spike recovery, as shown in Table 5, was 91%, indicating that the method can be used with security to determine Hg in low concentrations.
According to the results shown in Table 5, a low concentration of Hg was found in the sample, showing the need of a control of this toxic metal in these samples, since the cultivation process of sugar cane can promote the presence of this element in the final product. The PVG system with pre-concentration shows a high sensitivity and was suitable to determine Hg in concentrations below 0.1 µg L-1. The higher value of the relative standard
deviation (RSD) observed for the sample without addition is due that the concentration found is close to the value of LOD.
The current specifications imposed by the National Agency of Petroleum, Natural Gas and Biofuels47 define
limits for maximum concentration of Na, Cu and Fe in Table 3. Figures of merit for detection techniques for Hg determination in different samples
Sample Analytical technique Linear range / (µg L-1) LOD
instrum / (µg L-1) LCE / (µg L-1) Reference
Biological PVG AAS 0.5-25 0.03 0.68 14
Biological PVG-PD-OES 5-1000 0.10 10 36
Water PVG-GF AAS and
pre-concentration
0.1-5 0.02 0.5 31
Water and biological PVG-AFS up 40 0.01 5 37
Cosmetics PVG-ICP MS up 8 0.0006 0.95 22
Glycerin PVG-CV AAS 2.5-10 0.05 2.5 23
Ethanol fuel PVG-CV AAS 2.5-10 0.05 2.5 21
Water PVG-AFS up 25 0.003 5 38
Water PVG-FAPES 1-25 0.25 5 32
PVG-FAPES (with pre-concentration)
0.25-1 0.05 ≤ LOD
Vaccines PVG-ICP OES 0.5-10 0.3 47.4 39
Water PVG-AFS 0.25-15 0.03 0.25 40
Vinegar PVG-AFS up 1000 0.08 5 41
Water and biological PVG-AFS 0.02-8 0.0008 0.05 42
Vaccines PVG-DBD-OES 2-50 0.19 0.98 43
Gasoline PVG-GF AAS up 4 0.1 1 44
Naphtha and petroleum PVG-AAS 25-100 0.5-0.6 ≤ LOD (naphta)
76 (petroleum)
20
Biological and sediment PVG-AAS 10-200 0.68 − 45
Ethanol fuel CV AAS 1-25 0.05 ≤ LOD 46
LOD: Limit of detection; LCE: lower concentration experimental; PVG AAS: photochemical vapor generation atomic absorption spectrometry; PVG-PD-OES: PVG point discharge optical emission spectrometry; PVG-GF AAS: PVG graphite furnace AAS; PVG-AFS: PVG atomic fluorescence spectrometry; PVG-ICP MS: PVG inductively coupled plasma mass spectrometry; PVG-CV AAS: PVG cold vapor AAS; PVG-FAPES: PVG furnace atomization plasma emission spectrometry; PVG-DBD-OES: PVG-dielectric barrier discharge-OES.
Table 4. Concentration of Hg in CRMs of biological samples by conventional PVG-CV AAS and with pre-concentration (n = 3)
Sample Certified value / (mg kg-1) Concentration of Hg (average) ± SD (RSD / %) / (mg kg -1)
Conventional PVG-CV AAS PVG-CV AAS with pre-concentration
DOLT 4 2.58 ± 0.22 2.46 ± 0.13 (5.3) 2.55 ± 0.28 (11.0)
DORM 3 0.382 ± 0.060 0.362 ± 0.024 (6.6) 0.366 ± 0.040 (10.9)
Table 5. Results of concentration of Hg total in ethanol fuel by PVG-CV AAS with pre-concentration (n = 3)
Sample Concentration of Hg (average) ± SD (RSD / %) / (µg L -1)
Without addition Addition of 0.4 µg L-1
ethanol biofuel (anhydrous or hydrated). However, it did not establish limits of concentration for elements of environmental interest, such as Hg, for example, and it is evident that there is a need for the control of this analyte, which even at low concentrations, can be harmful to the environment and human health. Until now, no work in the literature has reported the quantification of Hg in ethanol.
Conclusions
Photochemical reduction using UV radiation combined with a CV AAS technique has been successfully applied and proven to be an excellent alternative for the determination of total Hg in biological and ethanol fuel samples. The two systems employed (conventional and with pre-concentration) proved suitable for the quantification of Hg in lower concentrations and effective in reducing inorganic and organic species of Hg. With the PVG-CV AAS pre-concentration system, it was possible to achieve a high detectability, higher than the conventional method. These methods do not require an extensive sample preparation and eliminate the use of reducing agents.
Acknowledgments
The authors are grateful to Conselho Nacional de Desenvolvimento Científico e Tecnológico (CNPq, Process No. 310917/2013-1 and No. 447552/2014-7) for financial support and Coordenação de Aperfeiçoamento de Pessoal de Nível Superior (CAPES) for scholarship and financial support.
References
1. Taylor, D. L.; Kutil, N. J.; Malek, A. J.; Collie, J. S.; Mar. Environ. Res. 2014, 99, 20.
2. Cai, Y.; Braids, O. C. In ACS Symposium Series, vol. 835; American Chemical Society: Washington, USA, 2003, ch. 1, p. 1.
3. Llop, S.; Murcia, M.; Aguinagalde, X.; Vioque, J.; Rebagliato, M.; Cases, A.; Iñiguez, C.; Espinosa, M. J. L.; Amurrio, A.; Muñoz, E. M. N.; Ballester, F.; Environ. Res. 2014, 132, 83. 4. Aranda, P. R.; Gásquez, J. A.; Olsina, R. A.; Martinez, L. D.;
Gil, R. A.; Talanta 2012, 101, 353.
5. Santos, W. N. L.; Dias, F. S.; Reboucas, M. V.; Pereira, M. G.; Lemos, V. A.; Teixeira, L. S. G.; J. Anal. At. Spectrom.2006, 21, 1327.
6. Saint’Pierre, T. D.; Frescura, V. L. A.; Curtius, A. J.; Talanta
2006, 68, 957.
7. Anderson, L. G.; Energy Environ. Sci.2009, 2, 1015.
8. Du, X.; Carriquiry, M. A.; Energy Policy2013, 59, 507. 9. Welz, B.; Sperling, M.; Atomic Absorption Spectrometry, 3rd ed.;
Wiley-VCH: Weinheim, Germany, 1999.
10. Ribeiro, A. S.; Vieira, M. A.; Curtius, A. J.; J. Braz. Chem. Soc.
2004, 15, 825.
11. Guo, X.; Sturgeon, R. E.; Mester, Z.; Gardner, G. J.; Anal. Chem.2003, 75, 2092.
12. Yan, X. P.; Yin, X. B.; He, X. W.; Jiang, Y.; Anal. Chem.2002, 74, 2162.
13. Golimowski, J.; Golimowska, K.; Anal. Chim. Acta1996, 325, 111.
14. Vieira, M. A.; Ribeiro, A. S.; Curtius, A. J.; Sturgeon, R. E.; Anal. Bioanal. Chem.2007, 388, 837.
15. Guo, X.; Sturgeon, R. E.; Mester, Z. N.; Gardner, G. J.; Environ. Sci. Technol.2003, 37, 5645.
16. Zheng, C.; Sturgeon, R. E.; Hou, X.; J. Anal. At. Spectrom.
2009, 24, 1452.
17. Grinberg, P.; Sturgeon, R. E.; Spectrochim. Acta, Part B2009, 64, 235.
18. Grinberg, P.; Mester, Z.; Sturgeon, R. E.; Ferretti, A.; J. Anal. At. Spectrom.2008, 23, 583.
19. Su, Y.; Xu, K.; Gao, Y.; Hou, X.; Microchim. Acta2008, 160, 191.
20. Jesus, A.; Zmozinski, A. V.; Vieira, M. A.; Ribeiro, A. S.; Silva, M. M.; Microchem. J.2013, 110, 227.
21. Silva, C. S.; Oreste, E. Q.; Nunes, A. M.; Vieira, M. A.; Ribeiro, A. S.; J. Anal. At. Spectrom. 2012, 27, 689.
22. Gao, Y.; Shi, Z.; Zong, Q.; Wu, P.; Su, J.; Liu, R.; Anal. Chim. Acta2014, 812,6.
23. Lisboa, M. T.; Clasen, C. D.; Oreste, E. Q.; Ribeiro, A. S.; Vieira, M. A.; Energy Fuels2015, 29, 1635.
24. Leopold, K.; Foulkes, M.; Worsfold, P.; Anal. Chim. Acta2010, 663, 127.
25. Zierhut, A.; Leopold, K.; Harwardt, L.; Schuster, M.; Talanta
2010, 81, 1529.
26. Lacerda, L. D.; Santos, A. F.; Marins, R. V.; Quim. Nova2007, 30, 366.
27. Zierhut, A.; Leopold, K.; Harwardt, L.; Worsfold, P.; Schuster, M.; J. Anal. At. Spectrom.2012, 24, 767.
28. Yuan, X.; Yang, G.; Ding, Y.; Li, X.; Zhan, X.; Zhao, Z.; Duan, Y.; Spectrochim. Acta, Part B 2014, 93, 1.
29. Puanngam, M.; Dasgupta, P. K.; Unob, F.; Talanta2012, 99, 1040.
30. Duarte, F. A.; Bizzi, C. A.; Antes, F. G.; Dressler, V. L.; Flores, E. M. M.; Spectrochim. Acta, Part B2009, 64, 513.
31. He, C.; Cheng, G.; Zheng, C.; Wu, L.; Lee, Y.; Hou, X.; Anal. Methods2015, 7, 3015.
32. Ribeiro, A. S.; Vieira, M. A.; Grinberg, P.; Sturgeon, R. E.; J. Anal. At. Spectrom. 2009, 24, 689.
34. Grinberg, P.; Sturgeon, R. E.; J. Anal. At. Spectrom.2009, 24, 508.
35. Zheng, C.; Ma, Q.; Wu, L.; Hou, X.; Sturgeon, R. E.; Microchem. J.2010, 95, 32.
36. Zhang, S.; Luo, H.; Peng, M.; Tian, Y.; Hou, X.; Jiang, X.; Zheng, C.; Anal. Chem.2015, 87, 10712.
37. Hou, X.; Ai, X.; Jiang, X.; Deng, P.; Zheng, C.; Lv, Y.; Analyst
2012, 137, 686.
38. Zheng, C.; Li, Y.; He, Y.; Ma, Q.; Hou, X.; J. Anal. At. Spectrom.
2005, 20, 746.
39. Santos, E. J.; Herrmann, A. B.; Santos, A. B.; Baika, L. M.; Sato, C. S.; Tormen, L.; Sturgeon, R. E.; Curtius, A. J.; J. Anal. At. Spectrom.2010, 25, 1627.
40. Xia, H.; Liu, X.; Huang, K.; Gao, Y.; Gan, L.; He, C.; Hou, X.; Spectrosc. Lett.2010, 43, 550.
41. Liu, Q.; Spectrochim. Acta, Part B 2010, 65, 587.
42. Gao, Y.; Yang, W.; Zheng, C.; Hou, X.; Wu, L.; J. Anal. At. Spectrom.2011, 26, 126.
43. He, H.; Zhu, Z.; Zheng, H.; Xiao, Q.; Jin, L.; Hu, S.; Microchem. J.2012, 104, 7.
44. Jesus, A.; Sturgeon, R. E.; Liu, J.; Silva, M. M.; Microchem. J.
2014, 117, 100.
45. Sturgeon, R. E.; Luong, V.; J. Anal. At. Spectrom.2013, 28, 1610.
46. Almeida, I. L. S.; Coelho, N. M. M.; Energy Fuels2012, 26, 6003.
47. Agência Nacional do Petróleo, Gás Natural e Biocombustíveis; Resolução ANP No. 7, de 9.2.2011 - DOU 10.2.2011 - Retificada
DOU 14.4.2011. Available at http://www.udop.com.br/ download/legislacao/comercializacao/institucional_site_ juridico/resolucao_anp07_2011_regulamento_tecnico_etanol. pdf; accessed in February 2017.
Submitted: November 17, 2016
Published online: February 23, 2017