ACPD
9, 12707–12730, 2009OClO, NO2 and O3 measurements in the Arctic polar vortex by
GOMOS
C. T ´etard et al.
Title Page
Abstract Introduction
Conclusions References
Tables Figures
◭ ◮
◭ ◮
Back Close
Full Screen / Esc
Printer-friendly Version
Interactive Discussion Atmos. Chem. Phys. Discuss., 9, 12707–12730, 2009
www.atmos-chem-phys-discuss.net/9/12707/2009/ © Author(s) 2009. This work is distributed under the Creative Commons Attribution 3.0 License.
Atmospheric Chemistry and Physics Discussions
This discussion paper is/has been under review for the journalAtmospheric Chemistry and Physics (ACP). Please refer to the corresponding final paper inACPif available.
Simultaneous measurements of OClO,
NO
2
and O
3
in the Arctic polar vortex by
the GOMOS instrument
C. T ´etard1, D. Fussen1, C. Bingen1, N. Capouillez1, E. Dekemper1, N. Loodts1, N. Mateshvili1, F. Vanhellemont1, E. Kyr ¨ol ¨a2, J. Tamminen2, V. Sofieva2,
A. Hauchecorne3, F. Dalaudier3, J.-L. Bertaux3, O. Fanton d’Andon4, G. Barrot4, M. Guirlet4, T. Fehr5, and L. Saavedra5
1
Institut d’A ´eronomie Spatiale de Belgique, Brussels, Belgium 2
Finnish Meteorological Institute, Helsinki, Finland 3
Service d’A ´eronomie du CNRS, Verri `eres-le-buisson, France 4
ACRI-ST, Sophia-Antipolis, France 5
European Space Research Institute (ESRIN), European Space Agency, Frascaty, Italy
Received: 7 May 2009 – Accepted: 26 May 2009 – Published: 4 June 2009
Correspondence to: C. T ´etard ([email protected])
ACPD
9, 12707–12730, 2009OClO, NO2 and O3 measurements in the Arctic polar vortex by
GOMOS
C. T ´etard et al.
Title Page
Abstract Introduction
Conclusions References
Tables Figures
◭ ◮
◭ ◮
Back Close
Full Screen / Esc
Printer-friendly Version
Interactive Discussion
Abstract
We present the first nighttime measurements of OClO from a limb-viewing satellite in-strument in the Arctic polar vortex. The relationship between OClO, NO2and O3slant
column densities in the Arctic polar vortex are analyzed from the GOMOS measure-ments. The retrieval process is based on a differential optical absorption spectroscopy 5
(DOAS) method applied on the weighted median GOMOS transmittances. A study about the longitudinal distributions of OClO, NO2 and O3 above 65◦ north in January 2008 is presented. It shows a strong halogen activation in the lower stratosphere and a strong denoxification in the entire stratosphere inside the Arctic polar vortex. Time series of temperatures and OClO, NO2 and O3 slant column densities for the winters 10
2002/2003 to 2007/2008 are also presented. They highlight the correlation between temperature, OClO and NO2. The GOMOS instrument appears to be a very suitable
instrument for the monitoring of OClO, NO2 and O3 in the stratosphere during
night-time.
1 Introduction
15
Since the discovery of the stratospheric ozone depletion by Farman et al. (1985), sev-eral studies have been performed to better understand this recurrent phenomenon (a historical review of this research can be found in Solomon, 1999). Inorganic chlo-rine species (Cly) play an important role in the stratospheric chemical processes that lead to ozone depletion in both Arctic and Antarctic polar regions. The inert reservoir 20
species (like ClONO2 or HCl) are converted into active chlorine (ClO, Cl2O2) by
het-erogeneous reactions, which occur on the surface of polar stratospheric clouds (PSC) formed during the polar night (Solomon et al., 1986) if stratospheric temperatures are below 198 K (TPSC) . These active species will strongly contribute to catalytic cycles
ACPD
9, 12707–12730, 2009OClO, NO2 and O3 measurements in the Arctic polar vortex by
GOMOS
C. T ´etard et al.
Title Page
Abstract Introduction
Conclusions References
Tables Figures
◭ ◮
◭ ◮
Back Close
Full Screen / Esc
Printer-friendly Version
Interactive Discussion via one of the three reactions between ClO and BrO:
ClO+BrO→OClO+Br (R1)
ClO+BrO→BrCl+O2 (R2)
ClO+BrO→Br+Cl+O2 (R3)
The study done by Sessler et al. (1995) shows that OClO is a good qualitative indica-5
tor of chlorine activation and a good quantitative indicator of BrO. This study highlights also that OClO is a poor quantitative indicator of the ClO presence. The monitoring of OClO appears to be crucial to better understand the polar stratospheric chemistry by constraining the chemical models. The only significant sink of OClO is its rapid photol-ysis by the solar radiation in the UV wavelength range. Consequently OClO is almost 10
constant during night.
Nitrogen species NOx (NO+NO2) also play an important role by reforming the halo-gen reservoir species:
ClO+NO2→ClONO2 (R4)
BrO+NO2→BrONO2 (R5)
15
The reactions R4 and R5 limit the formation of OClO. Nevertheless, in the polar vor-tex, NO2 is removed via the formation of HNO3. This is the well-known denoxification
of the polar vortex.
The first measurements of OClO in the stratosphere were performed in Antarctica by Solomon et al. (1987) from a ground-based station. Since then, other measurements 20
ACPD
9, 12707–12730, 2009OClO, NO2 and O3 measurements in the Arctic polar vortex by
GOMOS
C. T ´etard et al.
Title Page
Abstract Introduction
Conclusions References
Tables Figures
◭ ◮
◭ ◮
Back Close
Full Screen / Esc
Printer-friendly Version
Interactive Discussion (GOME) on ERS-2 (Burrows et al., 1999), SCanning Imaging Absorption
spectroM-eter for Atmospheric CHartographY (SCIAMACHY) onboard ENVISAT (Bovensmann et al., 1999) and Ozone Monitoring Instrument (OMI) on Aura (Levelt et al., 2006). The instrument Optical Spectrograph and InfraRed Imager System (OSIRIS) onboard the Odin satellite (Llewellyn et al., 2004) uses the limb scattering technique to retrieve ver-5
tical profiles of concentrations of OClO (Krecl et al., 2006). Moreover, SCIAMACHY has a limb-viewing mode and can also retrieve such vertical profiles. However, no re-sults have been published for the moment. Note that the Stratospheric Aerosol and Gas Experiment III (SAGE III) on the Meteor-3M satellite (McCormick et al., 1991) can also perform lunar occultations and limb-scatter measurements in order to retrieve the 10
OClO vertical distributions but, for the moment, no results concerning this has been published. The Global Ozone Monitoring by Occultation of Stars (GOMOS) instrument on ENVISAT (see e.g., Bertaux et al., 1991; Kyr ¨ol ¨a et al., 2004) is designed to retrieve the vertical concentrations of trace gases, including nighttime OClO. Preliminary results for the year 2003 have suggested the presence of a maximum of the OClO concentra-15
tion in the equatorial upper stratosphere (Fussen et al., 2006). The stellar occultation technique used by GOMOS allows the measurements of OClO during nighttime. GO-MOS is the only satellite instrument able to perform nighttime measurements in the stratosphere. For the moment, the OClO product obtained from the GOMOS spectra has not been validated with data from other instruments. This is why we consider this 20
work as preliminary.
We report in this paper the distributions of OClO, NO2and O3slant column densities
(SCD) retrieved from GOMOS measurements during the Arctic winters from 2003 to 2008. After a brief summary of the GOMOS instrument, the retrieval algorithm is de-scribed. Then, we present the spatial distributions of OClO, NO2 and O3measured in
25
ACPD
9, 12707–12730, 2009OClO, NO2 and O3 measurements in the Arctic polar vortex by
GOMOS
C. T ´etard et al.
Title Page
Abstract Introduction
Conclusions References
Tables Figures
◭ ◮
◭ ◮
Back Close
Full Screen / Esc
Printer-friendly Version
Interactive Discussion
2 The GOMOS instrument
GOMOS is one of the ten instruments onboard ESA’s ENVISAT satellite launched on 1 March 2002 in a sun-synchroneous orbit at an altitude of 800 km. It is a stellar occul-tation spectrometer dedicated to the stratospheric and mesospheric remote sounding of the Earth. Operating in the UV, visible and NIR wavelength range (from 245 to 5
942 nm), it allows the retrieval of vertical profiles of O3, H2O, NO2, NO3, O2, aerosols and temperature. OClO is not a species retrieved systematically from the GOMOS operational algorithm because its slant optical thickness is small with respect to the instrumental signal-to-noise ratio. Nevertheless, a global determination of the strato-spheric OClO distribution is possible if several GOMOS measurements are co-added 10
(see Sect. 3 and Fussen et al., 2006). GOMOS is also equipped with two fast pho-tometers used to correct for star scintillation and to retrieve temperature profiles.
GOMOS measures light from several stars that are setting behind the Earth horizon. The transmittance along the line of sight is obtained at each tangent altitude by dividing the stellar spectrum measured through the atmosphere by the reference stellar spec-15
trum measured outside the atmosphere. This method is self-calibrated and offers the advantage of a large number of occultations per day (30 to 50 measurements per orbit compared to only 2 occultations for the solar occultation method). The wide variety of stars used combined with the sun-synchroneous orbit allows a global coverage in about 3 days. Nevertheless, the light intensity of stars is weak, influencing the signal-to-noise 20
ratio of GOMOS measurements that depends on the star used.
3 OClO retrieval
Due to the difficulties of the detection of OClO in a single GOMOS spectrum, we co-add transmittances (interpolated on a common altitude grid) in latitude bins of 10 degrees with a temporal resolution of one month. The transmittances used are already cor-25
ACPD
9, 12707–12730, 2009OClO, NO2 and O3 measurements in the Arctic polar vortex by
GOMOS
C. T ´etard et al.
Title Page
Abstract Introduction
Conclusions References
Tables Figures
◭ ◮
◭ ◮
Back Close
Full Screen / Esc
Printer-friendly Version
Interactive Discussion each data set is checked by using statistical normality tests after which we calculate
for each consistent bin a weighted median spectrum and the associated variances. A differential optical absorption spectroscopy (DOAS, Platt et al., 1979) technique is then applied on this weighted median spectrum in the [355–390 nm] wavelength re-gion. In this spectral window, the main contributions of the total extinction are the 5
molecular scattering, the aerosol extinction and the absorptions by OClO and NO2.
Even if the ozone absorption in this wavelength range is weak, we take it into ac-count in order to obtain a better accuracy of the retrieval. For the sake of an optimal signal-to-noise ratio, we have decided to use only measurements from the star Sirius (Temperature=11000 K, Magnitude=–1.44) in this study.
10
The key principle of the DOAS method is to separate the total transmittances T(λ) into two components, one varying slowly with the wavelength (Ts(λ)) and the other rapidly varying (notedd T (λ) and named experimental differential transmittance). The slowly varying transmittances are calculated using a second order polynomial. It cor-responds to the molecular scattering, the aerosol extinction and the slowly varying 15
components of the gaseous absorptions. In the same way, we separate the absorp-tion cross secabsorp-tions (σi) of each species into a slowly varying component (calculated also with a second order polynomial) and a high frequency component. The differential cross sectionsδσi are then calculated as the differences between the absorption cross sections and the smoothed ones. Thus, the modelled differential transmittance M(λ) 20
can be written as:
M(λ) = Ts
1−exp
h
− NO3δσO3 + NNO2δσNO2
+NOClOδσOClO
i
(1)
ACPD
9, 12707–12730, 2009OClO, NO2 and O3 measurements in the Arctic polar vortex by
GOMOS
C. T ´etard et al.
Title Page
Abstract Introduction
Conclusions References
Tables Figures
◭ ◮
◭ ◮
Back Close
Full Screen / Esc
Printer-friendly Version
Interactive Discussion by the experimental errors. In the minimization procedure, the wavelength is eventually
shifted by∆λ. The estimated retrieval error is extracted from the jacobian. Note that the cross sections used in the retrieval are the same regardless of the temperature.
Unfortunately, for the moment, no direct validation of the OClO SCD obtained can be achieved. In the future, a validation exercise will be done with the OSIRIS, SCIA-5
MACHY, OMI and GOME results. Nonetheless, we can compare the NO2 SCD
ob-tained from our DOAS procedure and from the GOMOS operational algorithm. Fig-ure 1 shows a typical comparison for August 2003 for the [60–65◦S] latitudinal band. The NO2 SCDs of each measurement in this bin, retrieved from the GOMOS
opera-tional algorithm are combined to obtain the weighted median SCD observed in the left 10
panel (dashed line). The relative differences between these two profiles are mostly lower than 10% (in absolute values) and this result holds for the other latitudinal bands. We can therefore conclude that the results of our DOAS process are consistent with the results of the operational algorithm. Furthermore, in a previous article, Fussen et al. (2006) shows a comparisons between OClO obtained from GOMOS measure-15
ments and calculated from the Belgian Assimilation System of Chemical Observations of ENVISAT (BASCOE) model (Errera and Fonteyn, 2001) for the year 2003. A good agreement results from this comparison. Thus, we can be confident with the OClO product obtained from the DOAS approach used in this study.
4 Spatial distribution of OClO, NO2and O3in the Arctic vortex in January 2008
20
According to the report of the Arctic winter stratosphere 2007/2008 (available at http: //www.ozone-sec.ch.cam.ac.uk/scout o3/), the stratosphere in the winter 2007/2008 was very cold. The temperature started to decrease in November and remained low until a major stratospheric warming in late February. Inside the polar vortex, the tem-peratures were below the PSC temperature treshold until the end of February. Indeed, 25
ACPD
9, 12707–12730, 2009OClO, NO2 and O3 measurements in the Arctic polar vortex by
GOMOS
C. T ´etard et al.
Title Page
Abstract Introduction
Conclusions References
Tables Figures
◭ ◮
◭ ◮
Back Close
Full Screen / Esc
Printer-friendly Version
Interactive Discussion In January 2008, the polar vortex was not centered on the geographical north pole.
It gradually moved towards Europe. Figure 2 shows a potential vorticity map obtained from the MIMOSA model (Hauchecorne et al., 2002) at 675 K (about 27 km) on 10 Jan-uary 2008. It highlights that the polar vortex extends from the North pole down to 60◦N latitudes above the regions whose longitude lies between 70◦W and 135◦E. 5
Consequently, a 5 degree latitudinal band in the northern hemisphere was not ho-mogeneous for the highest latitude. In January 2008, only the latitudinal band near 72◦ was sounded by GOMOS (Sirius occultations). In Fig. 2, the white circle represents the spatial distribution of these GOMOS Sirius occultations. They are distributed along the entire longitudinal range: some of them were performed inside the polar vortex and 10
the others outside. Hence, we cannot bin together all these measurements. Figure 3 shows that the distribution of the transmittances at 385 nm and at 30 km for the GO-MOS measurements in this latitudinal band are bimodal. Note that for other altitudes and wavelengths, this bimodality of the transmittances is also observed. One expects that high transmittances correspond to measurements inside the polar vortex. Indeed, 15
because of the denoxification of the polar vortex, the NO2absorption is weak.
To take into account the specificity of the position of the polar vortex in January 2008, we have divided the latitudinal band into 10◦
longitudinal boxes. In each box, we check the consistency of the measurements (statistical test) and we calculate the weighted median transmittance spectra. Then, we use the DOAS technique to retrieve OClO, 20
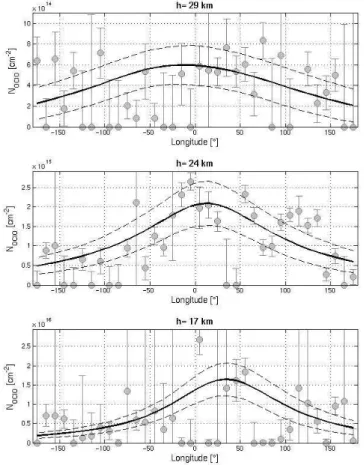
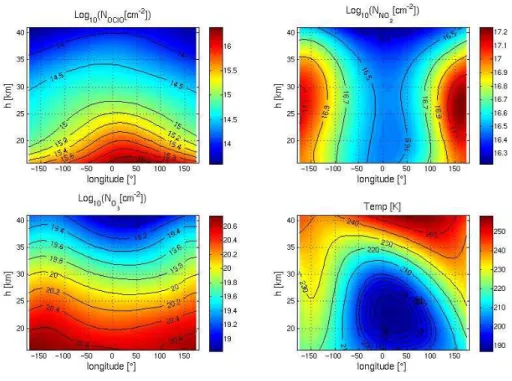
NO2and O3SCDs in each box. The results concerning OClO are presented in Fig. 4. It represents the longitudinal variations of OClO SCD for three different altitudes: 17, 24 and 29 km. It appears clearly that maxima of OClO SCD occur in the activated polar vortex (between 70◦W and 135◦E) at the two lowest altitudes. At 29 km, the shape of the distribution is flatter (around 5e14 cm−2
). The isopleths longitude-altitude for OClO, 25
NO2, O3SCDs and for the temperature provided by the European Center for
ACPD
9, 12707–12730, 2009OClO, NO2 and O3 measurements in the Arctic polar vortex by
GOMOS
C. T ´etard et al.
Title Page
Abstract Introduction
Conclusions References
Tables Figures
◭ ◮
◭ ◮
Back Close
Full Screen / Esc
Printer-friendly Version
Interactive Discussion This is in a good agreement with our current knowledge of stratospheric chemistry
(Brasseur and Solomon, 2005). According to Sessler et al. (1995), OClO presence is an indicator of halogen activation. The presence of ClO in the lower stratosphere in the polar vortex is confirmed by the instrument Microwave Limb Sounder (MLS) instru-ment onboard EOS Aura (Earth Observing System, Schoeberl et al., 2006): in Fig. 6, 5
a maximum of ClO volume mixing ratio in the lower stratosphere is located in the Arc-tic polar vortex (at high equivalent latitude, Santee et al., 2008). Figure 5 shows also the longitudinal and vertical distribution of ozone SCD. It shows a slow decreasing of ozone inside the polar vortex. This is in a good agreement with the halogen activation and with the denoxification observed. One may also notice the low temperatures (lower 10
than 200 K) encountered in the areas where the halogen activation and the denoxifica-tion are observed, a condidenoxifica-tion for the presence of PSCs.
5 Temporal evolution of OClO, NO2and O3in Arctic winters
In this section, we study the temporal evolution of the OClO, NO2 and O3 SCDs in the Arctic regions during winter from 2002/2003 to 2007/2008. Figure 7 shows the 15
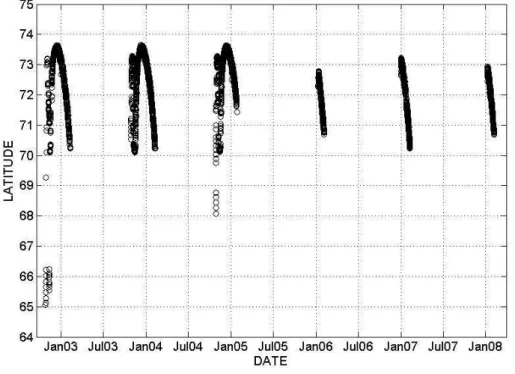
geolocation of the Sirius occultations in the northern hemisphere (latitude greater than 65◦). All these measurements occurred during polar nights. This study was performed with a temporal resolution of two days. Bins with less than 4 measurements are not considered as statistically significant and are not taken into account. This restriction eliminates only 11 bins among a total of 200 bins. The same method is then applied on 20
each set: the weighted median is calculated and the DOAS retrieval is applied. Thus, we retrieve the OClO SCD, the NO2 SCD and the O3 SCD as a function of time in
the Arctic winter. Note that, for this study, we do not take into account the position of measurements relative to the polar vortex. In other terms, no longitudinal separation (like in the previous section) has been done because the number of measurements 25
ACPD
9, 12707–12730, 2009OClO, NO2 and O3 measurements in the Arctic polar vortex by
GOMOS
C. T ´etard et al.
Title Page
Abstract Introduction
Conclusions References
Tables Figures
◭ ◮
◭ ◮
Back Close
Full Screen / Esc
Printer-friendly Version
Interactive Discussion measurements (like for the winter 2007/2008, cf Sect. 4) introducing some uncertainty
in our temporal study.
Figure 8 shows the minimum temperature reached in the stratosphere (panels A) and the O3(panels B), NO2 (panels C) and OClO (panels D) SCDs (with the error bars) at the altitude of 19 km as a function of time. This level has been chosen because at this 5
altitude both denoxification and halogen activation are clearly observable. The winter 2006/2007 was not studied due to the lack of data. In the next paragraphs, we will describe the results obtained for each winter.
5.1 The Arctic winter 2002/2003
During this winter, stratospheric minimum temperatures retrieved using the GOMOS 10
photometers were below the temperature of formation of PSC from mid November to mid January (panel A). Then, temperatures were higher after mid January, almost always above TPSC. Consequently, the halogen activation must be more important
during this cold period: we observed a slow increase of OClO SCDs all along this period (reaching 2.0e15 cm−2
at the end of December) and then, after mid January, 15
OClO SCDs began to decrease slightly. For NO2, it is the reverse: we observed a
decrease of the NO2 SCDs during the cold period and then an increase. Concerning ozone, the SCDs are very noisy. This is mainly because ozone is a weak absorber in the wavelength region used in the retrieval.
5.2 The Arctic winter 2003/2004
20
This winter is also characterized by two periods: a cold one (from mid November to late December when, the minimum temperatures are belowTPSC) following by a
warm-ing. During the cold period, OClO SCDs are increasing, NO2 and O3 SCDs are both
decreasing. When the temperatures gets higher, NO2SCDs are increasing and OClO SCDs are decreasing. However, ozone SCDs remain approximately constant. For this 25
ACPD
9, 12707–12730, 2009OClO, NO2 and O3 measurements in the Arctic polar vortex by
GOMOS
C. T ´etard et al.
Title Page
Abstract Introduction
Conclusions References
Tables Figures
◭ ◮
◭ ◮
Back Close
Full Screen / Esc
Printer-friendly Version
Interactive Discussion the warm period. For this winter the period of high halogen activation corresponds to
the period with the highest denoxification. This is in a good agreement with our current knowledge in stratospheric chemistry.
5.3 The Arctic winter 2004/2005
According to the report of the Arctic winter stratosphere 2004/2005 (available at http: 5
//www.ozone-sec.ch.cam.ac.uk/scout o3/), the temperatures in the stratosphere were the lowest since 50 years. They remained below TPSC from late November to late
February. Consequently, lots of PSC have been observed during the entire winter. The minimum GOMOS temperatures are in agreement with this situation. They are below TPSC from late November to late January. OClO SCDs strongly increased fom
10
late November to mid December, reaching approximately 2.5e15 cm−2. In the same time, NO2 SCDs decreased strongly. From mid December, OClO and NO2 remained
roughly constant. Ozone SCDs are weak all along this period. During this exceptionally cold and stable winter, GOMOS has observed strong and long halogen activation and denoxification.
15
5.4 The Arctic winter 2005/2006
For this winter, GOMOS has operated measurements only during January. The min-imum temperatures retrieved from the GOMOS photometers are not very low. They are below TPSC only for a few days in mid January (during the GOMOS
measure-ments period). Then the miminum temperatures in the stratosphere increased. Conse-20
quently, we observed an increase of the NO2SCDs (from 2.5e15 cm−2in mid January to 6e16 cm−2in early February). Nevertheless, we cannot observe a diminution of the OClO SCDs as expected. For an unclear reason, the temporal evolution of OClO SCDs is first decreasing and then increasing. Concerning ozone, nothing can be deduced by studying the temporal evolution.
ACPD
9, 12707–12730, 2009OClO, NO2 and O3 measurements in the Arctic polar vortex by
GOMOS
C. T ´etard et al.
Title Page
Abstract Introduction
Conclusions References
Tables Figures
◭ ◮
◭ ◮
Back Close
Full Screen / Esc
Printer-friendly Version
Interactive Discussion
5.5 The Arctic winter 2007/2008
The GOMOS measurements for this winter occurred only in January 2008. The mini-mum temperatures are often lower thanTPSCduring the whole GOMOS measurement
period. Nevertheless, we can distinguish neither denoxification nor halogen activation. This is probably because no longitudinal discrimination is carried out for this temporal 5
study. Indeed, the polar vortex is not centered on the geographical pole and the latitu-dinal band sounded by the GOMOS measurements is not homogeneous (cf. Sect. 4). This lack of homogeneity of the GOMOS measurements used generates the large er-ror bars observed on the O3, NO2 and OClO SCDs. However, we can observe an anticorrelation between NO2 and OClO SCDs: in mid January a sudden increase of 10
NO2SCD occurred at the same time as a sudden decrease of the OClO SCD. This is
followed by a decrease of NO2and an increase of OClO SCD.
6 Conclusions
This preliminary work focuses on the interactions between NO2, O3 and OClO in the
Arctic polar vortex. The slant column densities of these species are retrieved during 15
nighttime from Sirius occultations as observed by the GOMOS instrument. First, the longitudinal distributions of these species in January 2008 highlight strong variations of OClO and NO2(relative to the longitude) in the lower stratosphere: in the polar vortex, weak NO2SCD and strong OClO SCD are observed, and the reverse situation outside the polar vortex. Halogen activation (marked by high OClO SCDs) and denoxification 20
which occur in the polar vortex are clearly detectable. Hence, the GOMOS spectrome-ter appears to be a suitable instrument to perform a monitoring of such species in the polar vortex. Furthermore, the temporal study confirms that the halogen activation de-gree and the concomitant denoxification can be effectively monitored by GOMOS. We were able to highlight the correlation between cold temperatures (belowTPSC), weak
25
ACPD
9, 12707–12730, 2009OClO, NO2 and O3 measurements in the Arctic polar vortex by
GOMOS
C. T ´etard et al.
Title Page
Abstract Introduction
Conclusions References
Tables Figures
◭ ◮
◭ ◮
Back Close
Full Screen / Esc
Printer-friendly Version
Interactive Discussion This paper reports the first study of OClO distribution using limb-viewing satellite
mea-surements performed during night in the Arctic regions.
The next step in the use of the GOMOS measurements for the OClO retrieval is to validate this product. For this aim, we need correlative measurements from other satellite instruments (like OSIRIS, SCIAMACHY, GOME or OMI) or balloon-borne in-5
struments. In a forthcoming work, we will build a global OClO climatology.
Acknowledgements. This study was funded by the PRODEX 9 contract SECPEA under the
authority of the Belgian Space Science Office (BELSPO).
We thank the MLS science team for giving us the authorization to use the ClO figure.
References
10
Bertaux, J. L., M ´egie, G., Widemann, T., Chassefi `ere, E., Pellinen, R., Kyr ¨ol ¨a, E., Korpela, S., and Simon, P.: Monitoring of ozone trend by stellar occultations: the GOMOS instrument, Adv. Space Res., 11, 237–242, doi:10.1016/0273-1177(91)90426-K, 1991. 12710
Bovensmann, H., Burrows, J. P., Buchwitz, M., Frerick, J., No ¨el, S., Rozanov, V. V., Chance, K. V., and Goede, A. P. H.: SCIAMACHY: Mission Objectives and Measurement Modes, J. 15
Atmos. Sci., 56, 127–150, doi:10.1175/1520-0469(1999)056, 1999. 12710
Brasseur, G. P. and Solomon, S.: Aeronomy of the Middle Atmosphere: Chemistry and Physics of the Stratosphere and Mesosphere, Springer, Berlin., 2005. 12715
Burrows, J. P., Weber, M., Buchwitz, M., Rozanov, V., Ladst ¨atter-Weißenmayer, A., Richter, A., Debeek, R., Hoogen, R., Bramstedt, K., Eichmann, K.-U., Eisinger, M., and Perner, D.: The 20
Global Ozone Monitoring Experiment (GOME): Mission Concept and First Scientific Results., J. Atmos. Sci., 56, 151–175, doi:10.1175/1520-0469(1999)056, 1999. 12710
Canty, T., Riviere, E. D., Salawitch, R. J., Berthet, G., Renard, J. B., Pfeilsticker, K., Dorf, M., Butz, A., B ¨osch, H., Stimpfle, R. M., Wilmouth, D. M., Richard, E. C., Fahey, D. W., Popp, P. J., Schoeberl, M. R., Lait, L. R., and Bui, T. P.: Nighttime OClO in the winter Arctic vortex, 25
J. Geophys. Res., 110, D01301, doi:10.1029/2004JD005035, 2005. 12709
ACPD
9, 12707–12730, 2009OClO, NO2 and O3 measurements in the Arctic polar vortex by
GOMOS
C. T ´etard et al.
Title Page
Abstract Introduction
Conclusions References
Tables Figures
◭ ◮
◭ ◮
Back Close
Full Screen / Esc
Printer-friendly Version
Interactive Discussion
Errera, Q. and Fonteyn, D.: Four-dimensional variational chemical assimilation of
CRISTA stratospheric measurements, J. Geophys. Res., 106, 12253–12266, doi:10.1029/ 2001JD900010, 2001. 12713
Farman, J. C., Gardiner, G., and Shanklin, J. D.: Large losses of total ozone in antartica reveal
seasonal ClOx/NOxinteraction, Nature, 315, 207–210, 1985. 12708
5
Fussen, D., Vanhellemont, F., Dodion, J., Bingen, C., Mateshvili, N., Daerden, F., Fonteyn, D., Errera, Q., Chabrillat, S., Kyr ¨ol ¨a, E., Tamminen, J., Sofieva, V., Hauchecorne, A., Dalaudier, F., Bertaux, J.-L., Renard, J.-B., Fraisse, R., d’Andon, O. F., Barrot, G., Guirlet, M., Mangin, A., Fehr, T., Snoeij, P., and Saavedra, L.: A global OClO stratospheric layer discovered in GOMOS stellar occultation measurements, Geophys. Res. Lett., 33, L13815, doi:10.1029/ 10
2006GL026406, 2006. 12710, 12711, 12713
Hauchecorne, A., Godin, S., Marchand, M., Hesse, B., and Souprayen, C.: Quantification of the transport of chemical constituents from the polar vortex to midlatitudes in the lower
stratosphere using the high resolution advection model MIMOSA and effective diffusivity, J.
Geophys. Res., 107(D20), 8289, doi:10.1029/2001JD00049, 2002. 12714 15
Krecl, P., Haley, C. S., Stegman, J., Brohede, S. M., and Berthet, G.: Retrieving the vertical distribution of stratospheric OClO from Odin/OSIRIS limb-scattered sunlight measurements, Atmos. Chem. Phys., 6, 1879–1894, 2006,
http://www.atmos-chem-phys.net/6/1879/2006/. 12709, 12710
Kyr ¨ol ¨a, E., Tamminen, J., Leppelmeier, G. W., Sofieva, V., Hassinen, S., Bertaux, J. L., 20
Hauchecorne, A., Dalaudier, F., Cot, C., Korablev, O., Fanton D’Andon, O., Barrot, G., Man-gin, A., Th ´eodore, B., Guirlet, M., Etanchaud, F., Snoeij, P., Koopman, R., Saavedra, L., Fraisse, R., Fussen, D., and Vanhellemont, F.: GOMOS on Envisat: an overview, Adv. Space Res., 33, 1020–1028, doi:10.1016/S0273-1177(03)00590-8, 2004. 12710
Levelt, P. F., van den Oord, G. H. J., Dobber, M. R., Malkki, A., Visser, H., de Vries, J., Stammes, 25
P., Lundell, J. O. V., and Saari, H.: The Ozone Monitoring Instrument, IEEE Transactions on Geoscience and Remote Sensing, 44, 1093–1101, doi:10.1109/TGRS.2006.872333, 2006. 12710
Llewellyn, E., Lloyd, N. D., Degenstein, D. A., Gattinger, R. L., Petelina, S. V., Bourassa, A. E., Wiensz, J. T., Ivanov, E. V., McDade, I. C., Solheim, B. H., McConnell, J. C., Haley, C. S., 30
von Savigny, C., Sioris, C. E., McLinden, C. A., Griffioen, E., Kaminski, J., Evans, W. F. J.,
ACPD
9, 12707–12730, 2009OClO, NO2 and O3 measurements in the Arctic polar vortex by
GOMOS
C. T ´etard et al.
Title Page
Abstract Introduction
Conclusions References
Tables Figures
◭ ◮
◭ ◮
Back Close
Full Screen / Esc
Printer-friendly Version
Interactive Discussion Warshaw, G., Deslauniers, D. L., Marchand, P., Richardson, E. H., King, R. A., Wevers,
I., McCreath, W., Kyrola, E., Oikarinen, L., Leppelmeier, G. W., Auvinen, H., Megie, G., Hauchecorne, A., Lefevre, F., de La Noe, J., Ricaud, P., Frisk, U., Sjoberg, F., von Scheele, F., and Nordh, L.: The OSIRIS instrument on the Odin spacecraft, Can. J. Phys., 82, 411– 422, doi:10.1139/p04-005, 2004. 12710
5
McCormick, M. P., Chu, W. P., Zawodny, J. M., Mauldin, L. E., and McMaster, L. R.: Strato-spheric aerosol and gas experiment III (SAGE III) aerosol and trace gas measurements for Earth Observing System (EOS), in: Society of Photo-Optical Instrumentation Engineers (SPIE) Conference Series, 125–141, 1991. 12710
Miller, H. L. J., Sanders, R. W., and Solomon, S.: Observations and interpretation of column 10
OClO seasonal cycles at two polar sites, J. Geophys. Res., 104, 18769–18783, 1999. 12709
Platt, U., Perner, D., and P ¨atz, H. W.: Simultaneous measurement of atmospheric CH2O, O3,
and NO2 by differential optical absorption, J. Geophys. Res., 84, 6329–6335, doi:10.1029/
JC084iC10p06329, 1979. 12712
Pommereau, J.-P. and Piquard, J.: Observations of the vertical distribution of stratospheric 15
OClO, Geophys. Res. Lett., 21, 1231–1234, doi:10.1029/94GL00390, 1994. 12709
Renard, J. B., Lefevre, F., Pirre, M., Robert, C., and Huguenin, D.: Vertical profile of night-time stratospheric OClO, J. Atmos. Chem., 26, 65–76, 1997. 12709
Riviere, E. D., Pirre, M., Berthet, G., Renard, J. B., Taupin, F. G., Huret, N., and Chartier, M.: On the interaction between nitrogen and halogen species in the Arctic polar vortex during 20
THESEO and THESEO 2000, J. Geophys. Res., 108, 8311, doi:10.1029/2002JD002087, 2003. 12709
Santee, M. L., Lambert, A., Read, W. G., Livesey, N. J., Manney, G. L., Cofielfd, R. E., Cuddy,
D. T., Daffer, W. H., Drouin, D. J. an d Froidevaux, L., Fuller, R. A., Jarnot, R. A., Knosp, B. W.,
Perun, V. S., Snyder, W. V., Stek, P. C., Thurstans, R. P., Wagner, P. A., Waters, J. W., Connor, 25
B., Urban, J., Murtagh, D., Ricaud, P., Barrett, B., Kleinboehl, A., Kuttippurath, J., Kullmann, H., von Hobe, M., Toon, G. C., and Stachnik, R. A.: Validation of the Aura Microwave Limb Sounder ClO Measurements, J. Geophys. Res., 113, D15S22, doi:10.1029/2007JD008762, 2008. 12715
Schoeberl, M. R., Douglass, A. R., Hilsenrath, E., Bhartia, P. K., Beer, R., Waters, J. W., 30
ACPD
9, 12707–12730, 2009OClO, NO2 and O3 measurements in the Arctic polar vortex by
GOMOS
C. T ´etard et al.
Title Page
Abstract Introduction
Conclusions References
Tables Figures
◭ ◮
◭ ◮
Back Close
Full Screen / Esc
Printer-friendly Version
Interactive Discussion Sessler, J., Chipperfield, M. P., Pyle, J. A., and Toumi, R.: Stratospheric OClO measurements
as a poor quantitative indicator of chlorine activation, Geophys. Res. Lett., 22, 687–690, 1995. 12709, 12715
Solomon, S.: Stratospheric ozone depletion: A review of concepts and history, Rev. Geophys., 37, 275–316, 1999. 12708
5
Solomon, S., Garcia, R. R., Rowland, F. S., and Wuebbles, D. J.: On the depletion of antarctic ozone, Nature, 321, 755–758, 1986. 12708
Solomon, S., Mount, G. H., and Sanders, R.W. Schmeltekopf, A. L.: Visible spectroscopy at McMurdo station, Antartica 2. Observations of OClO, J. Geophys. Res., 92, 8329–8338, 1987. 12709
10
ACPD
9, 12707–12730, 2009OClO, NO2 and O3 measurements in the Arctic polar vortex by
GOMOS
C. T ´etard et al.
Title Page
Abstract Introduction
Conclusions References
Tables Figures
◭ ◮
◭ ◮
Back Close
Full Screen / Esc
Printer-friendly Version
Interactive Discussion
Fig. 1. On the left: vertical profiles of NO2slant column densities for August 2003 in the [60◦–
65◦S] latitudinal band. The dashed line corresponds to the profile retrieved from the GOMOS
operational algorithm and the solid line to the profile retrieved in this study. On the right: vertical
ACPD
9, 12707–12730, 2009OClO, NO2 and O3 measurements in the Arctic polar vortex by
GOMOS
C. T ´etard et al.
Title Page
Abstract Introduction
Conclusions References
Tables Figures
◭ ◮
◭ ◮
Back Close
Full Screen / Esc
Printer-friendly Version
Interactive Discussion
Fig. 2. Potential vorticity map calculated by the MIMOSA high-resolution advection model at
12:00 UT on 10 January 2008 at 675 K (about 27 km). The white circle at 72◦N represents the
ACPD
9, 12707–12730, 2009OClO, NO2 and O3 measurements in the Arctic polar vortex by
GOMOS
C. T ´etard et al.
Title Page
Abstract Introduction
Conclusions References
Tables Figures
◭ ◮
◭ ◮
Back Close
Full Screen / Esc
Printer-friendly Version
Interactive Discussion
Fig. 3. Histogram of transmittances at 30 km and at 386 nm from the GOMOS Sirius
ACPD
9, 12707–12730, 2009OClO, NO2 and O3 measurements in the Arctic polar vortex by
GOMOS
C. T ´etard et al.
Title Page
Abstract Introduction
Conclusions References
Tables Figures
◭ ◮
◭ ◮
Back Close
Full Screen / Esc
Printer-friendly Version
Interactive Discussion
Fig. 4.OClO slant column densities as a function of longitude with the spectral inversion error
bars for January 2008 in the Arctic polar region. The solid line is the result of an error-weighted fit by a simple lorentzian function. The dashed lines represent the associated confidence
ACPD
9, 12707–12730, 2009OClO, NO2 and O3 measurements in the Arctic polar vortex by
GOMOS
C. T ´etard et al.
Title Page
Abstract Introduction
Conclusions References
Tables Figures
◭ ◮
◭ ◮
Back Close
Full Screen / Esc
Printer-friendly Version
Interactive Discussion
Fig. 5. Isopleths (longitude-altitude) of the OClO SCD retrieved from the DOAS procedure,
NO2and O3SCDs retrieved from the operational algorithm, and the temperature provided by
ACPD
9, 12707–12730, 2009OClO, NO2 and O3 measurements in the Arctic polar vortex by
GOMOS
C. T ´etard et al.
Title Page
Abstract Introduction
Conclusions References
Tables Figures
◭ ◮
◭ ◮
Back Close
Full Screen / Esc
Printer-friendly Version
Interactive Discussion
14 January 2008
-80 -40 0 40 80
Equivalent Latitude / degrees 390
490 620 800 1040 1400 1800
Potential Temperature / K
20 25 30 35 40 45
Approximate Altitude / K
0.0 0.2 0.4 0.6 0.8 1.0 1.2 1.4 ClO / ppbv
Fig. 6.Isopleth (equivalent latitude-altitude) of the ClO volume mixing ratios on January 2008
ACPD
9, 12707–12730, 2009OClO, NO2 and O3 measurements in the Arctic polar vortex by
GOMOS
C. T ´etard et al.
Title Page
Abstract Introduction
Conclusions References
Tables Figures
◭ ◮
◭ ◮
Back Close
Full Screen / Esc
Printer-friendly Version
Interactive Discussion
Fig. 7. Geolocation of the tangent points of all the GOMOS Sirius occultations above 65◦N
ACPD
9, 12707–12730, 2009OClO, NO2 and O3 measurements in the Arctic polar vortex by
GOMOS
C. T ´etard et al.
Title Page
Abstract Introduction
Conclusions References
Tables Figures
◭ ◮
◭ ◮
Back Close
Full Screen / Esc
Printer-friendly Version
Interactive Discussion
Fig. 8.Time series of the winters 2002/2003 to 2007/2008 (except 2006/2007) of the minimal
temperature in the stratosphere(A)and of O3(B), NO2(C)and OClO SCDs(D)at 19 km with
![Fig. 1. On the left: vertical profiles of NO 2 slant column densities for August 2003 in the [60 ◦ – 65 ◦ S] latitudinal band](https://thumb-eu.123doks.com/thumbv2/123dok_br/18242905.341393/17.918.104.611.40.488/fig-vertical-profiles-slant-column-densities-august-latitudinal.webp)