UNDERSTANDING MOBILITY TO IMPROVE
IVAN DE OLIVEIRA NUNES
UNDERSTANDING MOBILITY TO IMPROVE
D2D COMMUNICATION
Dissertação apresentada ao Programa de Pós-Graduação em Computer Science do Instituto de Ciências Exatas da Federal University of Minas Gerais como requisito parcial para a obtenção do grau de Mestre em Computer Science.
Orientador: Antonio Alfredo Ferreira Loureiro
Co-Advisor: Pedro Olmo Stancioli Vaz de Melo
Belo Horizonte
IVAN DE OLIVEIRA NUNES
UNDERSTANDING MOBILITY TO IMPROVE
D2D COMMUNICATION
Dissertation presented to the Graduate Program in Computer Science of the Fed-eral University of Minas Gerais in partial fulfillment of the requirements for the de-gree of Master in Computer Science.
Advisor: Antonio Alfredo Ferreira Loureiro
Co-Advisor: Pedro Olmo Stancioli Vaz de Melo
Belo Horizonte
© 2016, Ivan de Oliveira Nunes.
Todos os direitos reservados
Ficha catalográfica elaborada pela Biblioteca do ICEx - UFMG
Nunes, Ivan de Oliveira.
N972u Understanding mobility to improve D2D communication. / Ivan de Oliveira Nunes. – Belo Horizonte, 2016.
xv, 87- f.: il.; 29 cm.
Dissertação ( mestrado) - Universidade Federal de
Minas Gerais – Departamento de Ciência da Computação. Orientador: Antônio Alfredo Ferreira Loureiro.
Coorientador: Pedro Olmo Stancioli Vaz de Melo.
1. Computação - Teses. 2. Device-to-device. 3. Redes de computadores 4. Computação móvel. 5. Redes sociais on- line. I. Orientador. II. Coorientador. III. Título.
Agradecimentos
Meu caminho até aqui foi iluminado por uma série de pessoas especiais que tornaram essa jornada muito mais fácil e agradável de ser trilhada. Agradeço a Deus por ter me dado condição de seguir este caminho e por ter colocado nele as pessoas que cito nesses agradecimentos.
Agradeço aos meus pais, João e Angélica e ao meu irmão Igor, por me darem amor incondicional e assistência em todos os momentos de dificuldade.
À Renata, por estar sempre ao meu lado, por me dar amor e carinho e compar-tilhar comigo todas as alegrias e frustrações.
A todos os familiares que mesmo distântes se fazem presentes em minha vida. Especialmente meus avós tios e primos.
A todos os professores pelas valiosas lições dadas dentro e fora de sala. Agradeço especialmente ao prof. Antonio Loureiro e ao prof. Pedro Vaz de Melo pela orientação, pelas mais diversas lições e pela amizade contruída nesse processo. Agradeço também aos professores Magnos Martinello e Roberta Gomes, por me introduzirem ao mundo da pesquisa, ainda na graduação, e por me apoiarem até hoje.
Aos colegas do laboratório Wisemap pela amizade, pela colaboração, pelas valiosas discussões e por fazerem o café. Agradeço especialmente a Clayson Celes e Igor de Oliveira Nunes, por participarem na autoria de parte deste trabalho.
Aos amigos de infância e do intercâmbio, por tantos os momentos prazerosos, divertidos e revitalizantes.
Aos colegas da turma 09: a melhor turma de Engenharia de Computação que já existiu.
Enfim, a todos que de alguma forma me ajudaram a chegar até aqui. Muito obrigado!
“Já dizia minha avó, antes mal acompanhada do que só!”
Abstract
Device-to-Device (D2D) communication is already considered a fundamental technol-ogy for the next generation mobile networks. This new type of communication en-ables the offloading of the base station download demands by directly transmitting the content when devices are sufficiently near to each other. In this work, we analyze
the role of different human mobility features to improve the cost-effectiveness of
op-portunistic forwarding in multi-hop D2D communication networks. We propose two algorithms, SAMPLER, which combines individuals’ mobility patterns, points of in-terest, and social awareness, and GROUPS-NET, which employs the knowledge about the regularity of group mobility as a measure of social context, instead of detecting communities. The proposed algorithms use different strategies and were validated in real-world scenarios using publicly available data sources. Both algorithms achieved better cost-effectiveness in multi-hop D2D forwarding when compared to the
state-of-art solution. In addition to these protocols, we also have proposed a group detection and tracking methodology and a novel mobility model, GRM, which accounts for the role of group meetings regularity in human mobility.
Contents
Agradecimentos ix
Abstract xi
1 Introduction 1
1.1 Overview . . . 1
1.2 Building Blocks and Related Work . . . 5
1.2.1 Human Mobility . . . 5
1.2.2 Communities Detection and Characterization . . . 6
1.2.3 Opportunistic Forwarding in D2D Networks . . . 7
1.2.4 Mobility Modeling . . . 9
2 Group Mobility: Detection, Tracking and Characterization 13 2.1 Chapter Overview . . . 13
2.2 Social Groups Identification and Tracking . . . 14
2.2.1 Modeling the Evolution of Proximity Traces With Graphs . . . 14
2.2.2 Telling Apart Social and Random Contacts to Create Social Graphs 15 2.2.3 Data Set Characterization . . . 16
2.2.4 Group Detection . . . 17
2.2.5 Group Tracking . . . 19
2.3 Characterization of Group Dynamics . . . 20
2.3.1 Metrics . . . 20
2.3.2 Results . . . 22
2.4 A Discussion on Group Detection Application . . . 24
2.5 Final Remarks . . . 26
3 GROUPS-NET 27 3.1 Chapter Overview . . . 27
3.2 Group Meetings Detection and Tracking . . . 29
3.3 Social Group Meetings Properties . . . 29
3.4 GROUPS-NET: Group Meetings Aware Routing . . . 31
3.5 Synthetic vs Real World Mobility . . . 36
3.6 Comparative Analysis . . . 39
3.6.1 Bubble Rap Algorithm . . . 39
3.6.2 Performance Evaluation . . . 40
3.6.3 Discussion . . . 43
3.7 Final Remarks . . . 44
4 SAMPLER: Combining Spatial and Social Awareness 47 4.1 Chapter Overview . . . 47
4.2 NCCU Trace . . . 48
4.3 SAMPLER Features . . . 49
4.3.1 Social Awareness as Popularity . . . 49
4.3.2 Social Communities . . . 51
4.3.3 Users’ Individual Mobility . . . 51
4.3.4 Points of Interest . . . 52
4.4 Combining Features Toward Cost-Effective Forwarding . . . 53
4.4.1 SAMPLER . . . 54
4.5 Results . . . 56
4.5.1 Experimental methodology . . . 56
4.5.2 Performance Evaluation . . . 58
4.5.3 Discussion . . . 58
4.6 Final Remarks . . . 59
5 GRM: Group Regularity Mobility Model 61 5.1 Chapter Overview . . . 61
5.2 Group Mobility: Real World vs Synthetic Models . . . 63
5.3 The GRM Model . . . 66
5.3.1 Group Meeting Times . . . 68
5.3.2 Group Meetings Durations . . . 70
5.3.3 Groups’ Structure and Social Context . . . 70
5.3.4 Mobility and Meeting Places . . . 72
5.4 Evaluation . . . 73
5.5 Opportunistic Forwarding in GRM . . . 73
5.6 Final Remarks . . . 77
6 Conclusion 79
Bibliography 81
Chapter 1
Introduction
1.1
Overview
In recent years, high data rate applications such as videos, songs, games, and social me-dia have become increasingly popular to users in cellular networks. Device-to-Device (D2D) communication has been proposed to facilitate high data rate transmissions among nearby users offering higher throughput, efficient spectral usage, extended
net-work coverage, and improved energy efficiency.
D2D refers to the direct transmission of content between devices without the need of sending all data through the base station, as in traditional cellular networks. The D2D transmission can be classified into two basic types: 1-hop transmission, in which a message goes directly from the source to the destination if both are close enough to each other; and multi-hop transmission, where the message must be
opportunistically routed, device-by-device, from the source to the destination. This last solution is more complex, since it depends on the intermittent communication structure of a mobile network and is suited for communication in which a greater delivery time might be tolerated.
This concept was firstly introduced in the context of Delay Tolerant Networks
(DTNs), but it has many applications to D2D networks as discussed by Li et al. (2014). For example, opportunistic forwarding algorithms can be used to deliver contents such as video advertisements and non-critical updates of applications. In such cases, timely delivery is not strictly essential and the multi-hop D2D communication can act as a bandwidth offload for the download demands of the base stations.
As discussed by Laya et al. (2014), the support for D2D communications affects
the data and control planes of the current cellular network as follows:
2 Chapter 1. Introduction
(a) Traditional centralized archi-tecture
(b) Distributed ad-hoc architec-ture
(c) Hybrid D2D architecture
Figure 1.1. Possible architectures for mobile and cellular networks
• Data plane: D2D supports opportunistically routed messages, creating a new data path that significantly reduces the download demand from the base station.
• Control plane: Signaling to control the forwarding policies can be achieved in
two ways: from device-to-device or in a centralized way. In the latter case, control messages come directly from the base station, but the content data is forwarded from device-to-device. The combination of both control signaling policies is also possible.
Figure 1.1 illustrates the types of possible architectures for data and control planes. In contrast with the purely centralized and the purely ad-hoc networks, illus-trated in Figures 1.1(a) and 1.1(b), respectively, the new generation of cellular com-munication supports a centralized control plane and a distributed data plane, which together allow to lessen the base station workload with D2D data transmissions. The possibility of a centralized control plane, offered in D2D communication, is a
funda-mental difference from D2D to the traditional DTNs, in which forwarding algorithms
must be completely distributed as in Figure 1.1(b).
Forwarding algorithms in multi-hop D2D networks aim to achieve cost-effective
1.1. Overview 3
bandwidth. The network overhead is measured by the average number of times the content needs to be D2D-transmitted for the message to get to its destination. A high number of transmissions may negatively impact the users’ experience by, for example, increasing devices’ energy expenditure.
Considering these metrics, the most successful strategy for opportunistic cost-effective forwarding, Bubble Rap (Hui et al., 2011), relies on information about static
social communities and nodes’ centrality. The use of Bubble Rap in D2D Networks is proposed in (Li et al., 2014). However, detecting communities in a D2D scenario is a complex and expensive task. With that in mind, as one of the contributions of this work, we introduce GROUPS-NET (Group Routing in Pocket Switched-Networks), a D2D parameter-free forwarding algorithm that considers the dynamic social structure of the D2D communication without the need to detect communities. GROUPS-NET works by looking at social group meetings instead of social communities, i.e., it uses group mobility awareness as an alternative measure for social context. According to our experiments, GROUPS-NET outperforms Bubble Rap in terms of cost-effective content delivery in large-scale scenarios.
We also have noticed that the existent social aware forwarding algorithms do not consider any geographic feature of the individuals’ mobility patterns nor the properties of the scenario in question, such as its Points of Interest (PoI). The recently released NCCU trace (Tsai and Chan, 2015) brings an unprecedented opportunity to investigate this open issue, since it is the first available real-world dataset to monitor not only users’ proximity contacts but also their geo-locations. In the literature, there are other real and synthetic traces, but none of them presents all these properties. In other words, based on the characterization of the NCCU trace we can get insights to design real-world protocols that take advantage and consider human mobility. With that in mind, we propose to combine spatial features and social awareness, recorded in the NCCU trace, with the goal of improving the cost-effectiveness of opportunistic
forwarding. We describe two spatial and two social features and characterize them in the NCCU trace. As a proof of concept, we use such properties to design SAMPLER (Social-Aware, Mobility, and PoI Routing) that, to the best of our knowledge, is the
first opportunistic routing strategy to combine mobility, PoIs, and social-awareness to provide cost-effective content delivery in intermittent connected networks. The explored properties of this strategy and the reasons for using each one of them are discussed in details.
Specifically, SAMPLER works by forwarding messages to nodes of higher
4 Chapter 1. Introduction
belong to the social community whose destination node is also a member of this com-munity. Within such community, the message is forwarded to the most popular nodes until it reaches the destination node. Our experiments show that by exploring the combination of spatial and social features, SAMPLER significantly increases the
de-livery ratio, reduces the network overhead, and enables faster dede-livery of messages, when compared to the state-of-the-art solution. These results reinforce our assump-tion that a better understanding of real mobility traces can provide valuable insights in the design of D2D routing.
In addition to SAMPLER and GROUPS-NET, we have shown that the existent mobility models do not capture the regularity of human group meetings, which are present in real mobility traces. Next, we have characterized the statistical properties of such group meetings in real mobility traces and design the Group Regularity Mobility (GRM) Model accordingly. We show that GRM maintain typical characteristics of real traces such as contact-duration and inter-contact-times (ICT) probability distribution functions, while, in addition, accounting for the role of group mobility. Finally, we evaluate some of the state-of-the-art social-aware protocols for opportunistic routing using a synthetic contact trace generated by our model. The results show that the behavior of such protocols in our model is similar to their behavior in real mobility traces.
In summary, we highlight the following main contributions of this work:
• A methodology for detecting and tracking mobile groups from proximity traces and a characterization of such groups’ properties. Such part of this work is also available in (Nunes et al., 2016c).
• GROUPS-NET, a group meetings aware algorithm for opportunistic forwarding in multi-hop D2D networks. GROUPS-NET does not need community detection and achieves better cost-effectiveness than the state-of-the-art solution, namely Bubble Rap. Such part of this work is also available in (Nunes et al., 2016b,d).
• SAMPLER, an algorithm that combines spatial and social properties to lever-age the cost-effectiveness of opportunistic message forwarding. SAMPLER is
currently submitted for possible publication in (Nunes et al., 2016a).
1.2. Building Blocks and Related Work 5
Throughout the rest of this chapter we introduce the main building blocks that were fundamental for providing the contributions listed above, pointing out the main related research efforts.
1.2
Building Blocks and Related Work
1.2.1
Human Mobility
Some rules that govern human mobility have already been revealed. Studies have used diverse data sources to look into human mobility patterns in the perspective of both: individual behavior and collective dynamics. The work of Gonzalez et al. (2008) on individual human mobility has found that human trajectories show a high degree of temporal and spatial regularity. More recently, a dichotomy in individual mobility was revealed in (Song et al., 2010) and (Pappalardo et al., 2015a). Those studies suggest that two mobility profiles, called returners and explorers, govern people
movements based on preferential returns and explorations of new places. In relation to collective dynamics, Candia et al. (2008) analyzed large-scale collective behavior from aggregated call detail records. Their work revealed that the spatio-temporal
fluctuations of individuals in a city is highly dependent of activity patterns and routines.
Yet, Isaacman et al. (2012) proposed an approach for modeling how people move in different metropolitan areas.
All of the works above are concerned with identifying the intrinsic properties of human mobility in order to provide knowledge and models that capture underlying information for many applications such as: impact of large scale events in urban mo-bility (Calabrese et al., 2010), typical transitions between points of interest in a city (Silva et al., 2014), and characterization and prediction of traffic conditions (Bauza et al., 2010; Lu and Cao, 2003; Terroso-Sáenz et al., 2012). Some studies have investi-gated the importance of understanding the properties of human mobility for designing communication protocols based on opportunistic encounters among people (Chaintreau et al., 2007; Panisson et al., 2012; Sermpezis and Spyropoulos, 2015; Rao et al., 2015). These works explore pairwise contacts between users from the individual mobility per-spective considering the following metrics: contact rate, inter-contact time, and contact duration. However, to the best of our knowledge, there is no such characterization re-lated to group mobility and its applications to mobile networks, which is one of the contributions of this work.
All the above-mentioned research efforts could be classified according to the
6 Chapter 1. Introduction
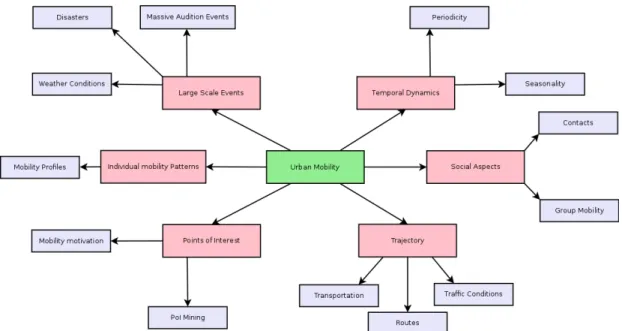
Figure 1.2. A taxonomy for human mobility properties. Pink boxes depict our
categorization for mobility studies and purple boxes exemplify types of studies contemplated within such categories.
and combine the six classes of mobility features presented in the pink boxes of the Fig-ure 1.2. In Chapter 2 we detect, track, and characterize group mobility, a social aspect of human mobility. In the GROUPS-NET algorithm, presented in Chapter 3, we com-bine the temporal and the social aspects of mobility by exploring the periodicity of group mobility to design a new forwarding strategy for D2D networks. Conversely, SAMPLER, presented in Chapter 4, combines points of interest, social context, and individual mobility patterns in its forwarding policy.
1.2.2
Communities Detection and Characterization
To perform group characterization from mobility traces’ analysis, we apply community detection methods. Since its introduction, community detection in complex networks have attracted a lot of attention. Algorithms for community detection can be
classi-fied according to two characteristics: overlapping versus non-overlapping, and static versus dynamic graphs. Among many proposed algorithms, the studies in (Palla et al., 2005) and (Gregory, 2010) have remarked themselves as the most popular and effective
algorithms for community detection in static graphs. Studies such as (Nguyen et al., 2011a) aim to propose adaptations and new algorithms that are suited for dynamics graphs, considering computational efficiency issues. In our study, we use these
1.2. Building Blocks and Related Work 7
characterize social groups dynamics looking at proximity traces.
There are also studies that characterize community evolution in other kinds of complex networks. For instance, Palla et al. (Palla et al., 2007) analyzed the evolution of communities in scientific collaboration networks and in phone call networks. Hui
et al. (2011) used community structure in mobility networks to design a very successful message forwarding protocol for Disruption Tolerant Networks (DTN), namely Bubble Rap. Our work in group mobility detection is fundamentally different from (Hui et al.,
2011) because it aims to detect groups of people who are in fact together, in space and time, socially interacting. In (Hui et al., 2011), the authors build a single static graph, of the whole trace time, and detect static communities in this single graph. The use of a single aggregated graph prevents accounting for changes of social behavior in time, i.e., social dynamics. For example, students who meet regularly because they attend the same class in a given semester may not be attending a class together in the next semester. The methodology we propose is capable of accounting for these changes in behavior through the detection and tracking of social groups who are together in space and time, instead of social communities in aggregated graphs. In Chapter 2, we aim to characterize the evolution of social groups by looking at properties such as group sizes, group meeting durations, periodicity in group meetings, and dynamics of groups’ evolution. Finally, we discuss group mobility application, providing a case study and some early results for opportunistic mobile networking.
1.2.3
Opportunistic Forwarding in D2D Networks
The most successful approaches for multi-hop forwarding are the probabilistic and social-aware strategies (Mota et al., 2014). The use of a probabilistic approach was
firstly introduced by Lindgren et al. (2003) in the PROPHET algorithm. The main idea
of PROPHET is to assign a higher importance to pairwise node contacts that happened more recently in an attempt to predict future pair contacts. The PROPHET algorithm achieved great success, being years later outperformed by social-aware strategies. In this direction, Hui et al. (2011) used the social community structure, detected from contact graphs of mobile networks, combined with network nodes’ centrality, to propose a forwarding algorithm named Bubble Rap. Although there are other routing protocols that exploit the social information from contacts between people (Daly and Haahr, 2007; Mtibaa et al., 2010; Hossmann et al., 2010), to the best of our knowledge, until now Bubble Rap was the most cost-effective forwarding algorithm in terms of high
8 Chapter 1. Introduction
The problem with Bubble Rap and other social-aware strategies is the depen-dence on information about static social communities. This dependepen-dence is harmful in several ways. First, communities are computationally expensive to detect (Nguyen et al., 2011b). Second, they are hard to detect in a distributed way, since individual nodes will not have information about the contact graph of the whole network. Ex-istent distributed community detection algorithms have at most 85% precision (Hui et al., 2007). Another problem of community detection algorithms is the parameter calibration. The most successful community detection algorithms depend on param-eters that must be calibrated for each specific scenario (Peel, 2010). In a real-time application, such as D2D communication, such calibration is not feasible. In addition to these problems, there is no established truth for community detection. Abrahao et al. (2012) evaluated community detection schemes and showed that, for the same scenarios, different community detection algorithms led to very different results for
communities’ compositions. Finally, static communities’ detection does not account for the dynamism in humans’ social relationships, i.e., how they change over time.
Aiming to address these issues, we propose to look at social group meetings, instead of detecting communities. A social group meeting is defined as a group of
people who are together, in space and time, for some social reason or common goal. People in a bus, for example, are together because they share the same goal of getting to a given destination. Students in the classroom share the objective of learning the class’ subject content. Friends hanging out at a bar share the social motivation of being together to relax and talk to each other. All of these are examples of social group meetings. As human beings have regular schedules and routines, it is reasonable to expect group meetings to present some regularity and predictability as well.
1.2. Building Blocks and Related Work 9
1.2.4
Mobility Modeling
Mobility models (Treurniet, 2014) have fundamental importance for mobile network-ing. They enable the generation of synthetic trajectories for mobile nodes in simulated environments, which can then be used to evaluate the performance of newly designed networking protocols. The validation of such protocols in real world large scale ex-periments is often unfeasible due to the financial and operational limitations. In this sense, synthetic models enable the rapid evaluation of the performance of networking protocols considering long periods of protocols’ deployment time, and large number of network nodes.
Group mobility is considered a fundamental building block for mobility modeling (Treurniet, 2014). However, the existent group mobility models (Aung et al., 2015) focus on modeling groups which remain together throughout the whole simulation time. On the other hand, mobility models that aim to model the regularity of human contact patterns (Ekman et al., 2008; Mei and Stefa, 2009; Lee et al., 2009) only consider pairwise contacts, ignoring the fact that human social contacts often happen in groups, involving more than two entities, as recently revealed in (Nunes et al., 2016c). The research studies on group mobility models are restricted to represent nodes that move together as clusters. For example, Reference Point Group Mobility (RPGM) (Hong et al., 1999) and Reference Velocity Group Mobility (RVGM) (Wang and Li, 2002) are variants of random models for group mobility. In both models, people are organized by groups in agreement with their logical relationships. Each group contains one leader and the members of a group move according to their leader. These mo-bility models are based on certain properties of movement, such as speed, direction, and acceleration and do not exhibit the typical contact properties of human mobility. Therefore, such models are not able to reproduce the mobility behavior and statistical properties of real-world mobility traces (Karamshuk et al., 2011).
In recent years, some studies have focused on modeling human mobility using statistical properties (e.g., displacements distribution, frequency for visiting different
locations) obtained from spatial and temporal regularity patterns. Lee et al. (2009) present a mobility model, called Self-similar Least Action Walk (SLAW), that cap-tures the following feacap-tures: truncated power-law distributions of flights, pause-times
and inter-contact times, attractive force to more popular places, and heterogeneously defined areas of individual mobility. The model uses these features to represent the mobility of people who share common gathering places, i.e., places that most people visit during their daily lives.
10 Chapter 1. Introduction
the intuition that people go more often to nearby or popular places. The intuition behind SWIM is supported by Gonzalez et al. (2008) who reveal spatial and temporal regularity patterns in the movement. Specifically, each node receives a home location
and assigns a probability to each possible destination according to the popularity of that location and the distance of such place to home.
SLAW and SWIM are able to produce inter-contact time and contact duration distributions that follow the ones found in the well-known mobility traces. However, both models consider only pairwise contacts, ignoring group mobility or any relation-ships between more than two nodes.
Musolesi and Mascolo (2007) proposed the community based mobility model (CMM) founded on social network theory. The model receives a social network as input and applies a community detection algorithm to this social network to determine the nodes’ movements according to the social ties between them. The intuition is that nodes go to places with higher social attraction. Boldrini and Passarella (2010) present the Home Cell Mobility Model (HCMM), an evolution of the CMM, based on the idea of social and location attractions. Similarly to SWIM, HCMM adopted the concept of home location and the nodes’ movements are subjected to their social relationships. Moreover, nodes go to few places more often and these places are not far from their homes. In these models, the community structure is forced into the nodes’ mobility to generate a social context. In our model, on the other hand, the community structure emerges naturally from both the regularity of group meetings and the dynamic group composition, as it happens in real world.
Ekman et al. (2008) introduced a mobility model called Working Day Movement Model (WDM) with the objective of modeling the daily behavior of people. WDM simulates daily routines of people considering their daily commutes between home and workplace. WDM expresses the regularity of human mobility, but, as we show in Sec. 5.2, it is not representative of real-world group mobility.
1.2. Building Blocks and Related Work 11
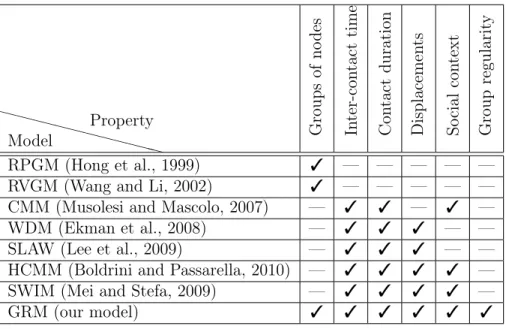
Table 1.1. Opportunistic networking properties in each mobility model
❳ ❳ ❳ ❳ ❳ ❳ ❳ ❳ ❳ ❳ ❳❳ Model
Property Group
s of no de s In te r-co nt ac t ti m e Co nt ac t du ra ti on D is pl ac em en ts So ci al co nt ex t G ro up re gu la ri ty
RPGM (Hong et al., 1999) ✓ — — — — —
RVGM (Wang and Li, 2002) ✓ — — — — —
CMM (Musolesi and Mascolo, 2007) — ✓ ✓ — ✓ —
WDM (Ekman et al., 2008) — ✓ ✓ ✓ — —
SLAW (Lee et al., 2009) — ✓ ✓ ✓ — —
HCMM (Boldrini and Passarella, 2010) — ✓ ✓ ✓ ✓ —
SWIM (Mei and Stefa, 2009) — ✓ ✓ ✓ ✓ —
GRM (our model) ✓ ✓ ✓ ✓ ✓ ✓
Chapter 2
Group Mobility: Detection,
Tracking and Characterization
2.1
Chapter Overview
Many practical problems can benefit from the knowledge of the underneath dynamics
that govern human mobility. For example, it can be applied to better plan urban infrastructure, forecast traffic, map the spread of biological viruses, or better design
Mobile Ad-hoc Network (MANET) protocols.
Specific network problems such as opportunistic routing and information diffusion in MANETs share a common interesting property: they are highly dependent on how humans interact with each other. In this context, we define a human group as set of
people that, for some reason or goal, get together in space and time. It is clear that knowledge of regular group meetings can be explored to improve the current state-of-the-art of opportunistic information diffusion, routing or to increase the current
understanding of how diseases spread. However, it remains a challenge how to define, detect, keep track, and analyze groups of humans and their dynamics.
In the literature, there are several proposals dedicated to understanding and modeling human mobility considering diverse aspects, but group mobility is currently an untrodden field. The human species is pretty sociable and this sociability must be
considered in order to better understand, model, and predict movement. The growing ubiquity of geo-localization sensors and the availability of data collected by them create a new opportunity to tackle the problem of group mobility. With this in mind, the present chapter focuses on characterization of groups’ dynamics through the analysis of proximity contact traces. Among the specific contribution of this chapter, we highlight:
14
Chapter 2. Group Mobility: Detection, Tracking and Characterization
• Definition of a methodology for telling apart random and social interactions in
proximity traces using a time dependent social graph model;
• Proposal of a systematic way for detecting and tracking human mobile groups;
• Characterization of group mobility properties, including group evolution, period-icity, and meeting durations;
• A discussion and some early results on how knowledge of group mobility could be applied to design opportunistic networking protocols.
This chapter is organized as follows. Section 2.2 formalizes our methodological steps to detect, track, and characterize human groups’ dynamics. Section 2.3 describes the experiments’ methodology and metrics, presenting results and the main groups’ characteristics detected. Section 2.4 discusses the application of group detection to information dissemination protocols. Finally, Section 2.5 brings the final remarks and
future work.
2.2
Social Groups Identi
fi
cation and Tracking
2.2.1
Modeling the Evolution of Proximity Traces With Graphs
2.2. Social Groups Identification and Tracking 15
Figure 2.1. RECAST application to tell apart random and social relationships
between peers in a contact trace
2.2.2
Telling Apart Social and Random Contacts to Create
Social Graphs
To help separating random and social contacts, we apply RECAST algorithm (Vaz de Melo et al., 2013) to the contact trace. RECAST algorithm separates social from random relationships between peers (Fig. 2.1). It works comparing the edge persistence and topological overlap of randomly generated graphs to the actual contact graph obtained from the contact trace. As output, RECAST reveals which pairs of nodes meet each other in a social fashion and which pairs do not share social properties. We then remove from the trace, contacts between pairs classified by RECAST as random
and proceed with the analysis in the trace containing only contacts between pairs that share social bonds.
16
Chapter 2. Group Mobility: Detection, Tracking and Characterization
2.2.3
Data Set Characterization
To be able to analyze the social groups’ dynamic properties, we need to understand the data set, avoiding potential biases (e.g., sampling bias, and inconsistencies) due to the data acquisition process. We perform this evaluation with the goal of definingtw size (the proper time slice to divide the data set) andwth (the threshold for the number of contacts, or contact duration that tell apart social and random contacts in the trace previously filtered by RECAST).
In the present study, we used the MIT Reality Mining proximity trace (Eagle and Pentland, 2006), which is a contact trace containing 80 users who reside in two different university buildings. Users were monitored for one year and contacts were
registered when two users were less than 10 meters apart. A contact entry in the trace is composed of the IDs of the pair of nodes and the date and time when the contact happened. It is worth mentioning that geo-location traces (such as GPS traces) can be converted to proximity traces by defining a minimum distance, which can be considered
a contact between two entities. For this reason, this methodology can also be applied to those kinds of traces.
Firstly, we analyze the time between pair re-encounters, i.e., once a pair has met, what is the distribution of the time until the next meeting. Fig. 2.3 shows that the re-encounter behavior is very periodical, with peaks around every five minutes (red dashed lines). This behavior indicates that the deployed system for data acquisition acts every five minutes most of the times, but for some reason it can also actuate
in shorter periods. Looking at the CDF of the re-encounter probability, we see that approximately 95% of the re-encounters can be captured with a tw of one hour. For this reason, we set the duration of the time windowtw to one hour.
Next, we analyze the fraction of pairs contacts to define wth. Fig, 2.2 shows that 27% of pairs that meet in a given hour only meet once. We assume these one-time meetings as coincidence meetings. For meeting frequencies from 2 to 12, the graphic shows values between 5% and 10%. For frequencies higher than 12, the probability becomes very low, which is consistent to the assumption of data acquisition mostly in periods of five minutes, but rarely less thanfive. From 2 to 12 encounters per hour, we
have similar values in the PDF when compared toP(X = 1). For this reason, wth= 2 for the MIT Reality Mining data set.
To summarize, through the data set characterization, we were able to define that
2.2. Social Groups Identification and Tracking 17
Figure 2.2. Probability distribution function of the number of pair contacts per
hour.
2.2.4
Group Detection
After defining values fortw andwth, we define a social group as follows:
• Definition of social group: A group is a community detected inGc(V, E[tw= i]) , i.e., the graph generated from the ith time slice of the trace S, after elim-inating contacts between pairs with no social bond and edges with weight bellow the threshold wth.
So far, we have established a model to represent social interactions that consists of graphs generated from peer contacts in traces’ time slices. Following the above group definition, we must be able to detect communities (social groups represented by more
densely interconnected parts within a graph of social links) in such graphs in order to track social groups. There are several community detection algorithms, such as (Xu et al., 2013; Nguyen et al., 2011a; Gregory, 2010). From the existing algorithms, we use the Clique Percolation Method (CPM) (Palla et al., 2005). The main reasons for using CPM are that their community members can be reached through well connected subsets of nodes and that the communities may overlap (share nodes with each other). This latter property is essential, as most social graphs are characterized by overlapping and nested communities (Palla et al., 2007). For each time-slice graphGc(V, E[tw=i]) we compute CPM.
In CPM, a community is defined as a union of all k-cliques (complete sub-graphs of
sizek) that can be reached from each other through a series of adjacent k-cliques (where adjacency means sharing k−1 nodes). The CPM parameter k limits the minimum size of detected communities. CPM has remarked itself as one of the most effective
18
Chapter 2. Group Mobility: Detection, Tracking and Characterization
(a) (b)
(c)
Figure 2.3. Probability function of the timex(in seconds) until the next
meet-ing. Red dashed lines show a fixed inter-measurement time of 318 seconds in which re-encounter peaks happen. This means that most of the trace proximity records were acquired infixed periods of 318 seconds. The probability of a pair of nodes meeting again has approximately exponential distribution and 95% of the re-encounters happen in less than one hour
2.2. Social Groups Identification and Tracking 19
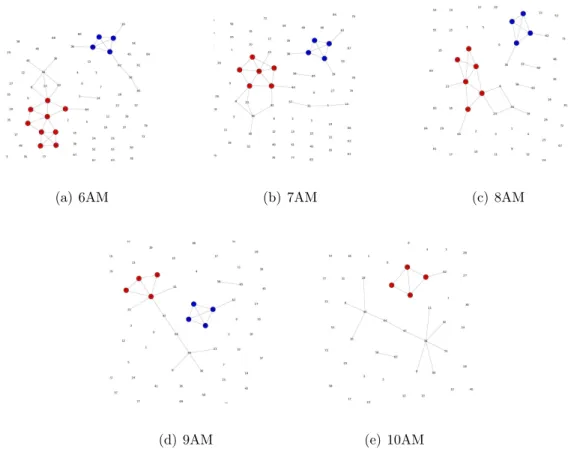
(a) 6AM (b) 7AM (c) 8AM
(d) 9AM (e) 10AM
Figure 2.4. Group detection with CPM, in the MIT proximity trace, with
tw=1h in three consecutive time windows, at February 5th of 2009. Only edges withwth≥2are represented
2.2.5
Group Tracking
Once groups are detected in different time slices, there must be a way of tracking them,
i.e., a criterion for considering that two groups in consecutive time slices are in fact the same group. With that goal we introduce the Group Correlation Coefficientρ(G1, G2):
ρ(G1, G2) = |V(G1)∩V(G2)|
|V(G1)∪V(G2)| (2.1) where |V(G1)∩V(G2)| is the number of common nodes in groups G1 and G2 and |V(G1)∪V(G2)|is the total number of different nodes that compose both groups. The
coefficient ρ assumes values from 0 to 1, where 0 means no correlation, i.e., no node that belongs to both groups and 1 means that G1 and G2 have the exact same node composition. Group correlation coefficient is a measurement of the stability in groups’
20
Chapter 2. Group Mobility: Detection, Tracking and Characterization
We consider a group to be the same in two consecutive time slices if ρ(G(tw = i), G(tw=i+ 1))>0.5, i.e., if at least 50% of the group members remains the same. A ρvalue greater than0.5, is the condition to map each group in a single group in two different time slices. The valueρ <0.5, would allow a single group to be mapped to two different groups with less than half of the original node composition in the next time window, adding complexity to the group tracking. At the same time aρthreshold of 0.5allows high volatility in group composition, making it possible to better analyze groups’ evolution.
2.3
Characterization of Group Dynamics
In this section we use the results of group detection and tracking methodology proposed in Section 2.2 to characterize groups’ dynamic evolution. Specifically, we analyze the following characteristics:
• Groups’ sizes throughout day hours.
• Groups’ evolution considering possibilities of no change, growth, contraction, birth and death.
• Groups’ meetings inter-contact times and periodicity.
• Groups’ meetings durations and its correlation with group stability and with group’s social bonds strength.
2.3.1
Metrics
One of the interests of the experiments to be presented in this section, is to reveal what factors impact the duration of a group meeting. Specifically, we plan to investigate the impact of the stability of group members and the impact of the strength of social bonds shared by group members. To measure the stability of group members we use the previously defined Group Correlation Coefficient ρ. Since we consider a group to remain the same if ρ > 0.5, the value for ρ throughout the duration of a group may
vary from 0.5to1.0.
For measuring the strength of groups’ social bonds we define Groups
Self-Containment Factor (GSCF) as:
GSCF(G) =
�
win(G) �
win(G) +�
2.3. Characterization of Group Dynamics 21
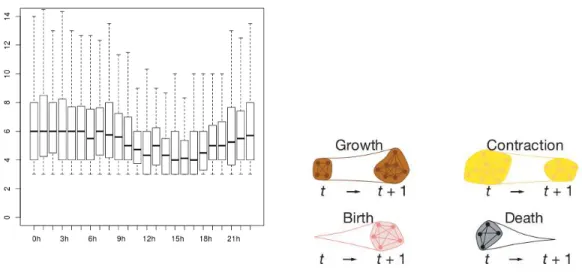
(a) Distribution of group sizes over day hours (0 to 23h)
(b) Considered events in group evolution (Palla et al., 2007)
(c) Dynamics of group evolution throughout day periods
Figure 2.5. Analysis of groups’ evolution, i.e., groups’ sizes and groups’
trans-formations, over different days times.
where �
win(G) is the sum of edge-weights between members of Group G, and �
22
Chapter 2. Group Mobility: Detection, Tracking and Characterization
Figure 2.6. Probability of a group re-meeting in t hours after meeting for the
first time att= 0. Red lines represent 24-hour periods and green lines represent 7-day periods
2.3.2
Results
After applying the methodology for group detection and tracking, proposed in Section 2.2, we here analyze characteristics from detected groups. In Fig. 2.5(a), box-plots for groups sizes are presented for each day hour (outliers omitted for better presentation). It shows that in night hours (10pm to 7am), groups’ sizes are similar and distributed around the average size of six. During day hours (8am to 9pm), groups’ sizes are more heterogeneous and have lower sizes. This behavior indicates that, in hours with higher mobility, groups tend to be less stable and have reduced number of members.
2.3. Characterization of Group Dynamics 23
Figure 2.7. Pearson’s correlation between group meeting durations,GSCF and
members stabilityρ.
Fig. 2.6 presents a very important result, which measures the frequency of group re-encounters, i.e., given the fact that a group first met at time t = 0, how group re-meetings are distributed along the next hours (thours after thefirst meeting). The result reveals that the mass of probability is concentrated around peaks in periods of 24 hours (represented by red dashed lines). This means that group meetings are highly periodical in a daily fashion. One may also notice higher peaks marked with green dashed lines. Green dashed lines represent periods of 7 days, meaning that groups meetings also present weekly periodicity. This periodicity makes sense since people have schedules and routines. This result motivated our discussion in Section 2.4, which tries to answer the question: Is it possible to use past group meetings to predict future ones?
To measure the impact of the strength of social bonds (GSCF - Eq. 2, Section 2.3.1) and groups’ stability (ρ, Eq. 1, Section 2.2.5) to the group meetings durations we
24
Chapter 2. Group Mobility: Detection, Tracking and Characterization
(a) Nov.2008 (b) Dec.2008 (c) Jan.2009
(d) Feb.2009 (e) Mar.2009 (f) Apr.2009
(g) May 2009 (h) Jun.2009
Figure 2.8. Delivery ratios for nodes that have been in groups with the origin
node (in blue) and for nodes that have not been (in red). Numbers in the x-axis represent IDs of origin nodes
2.4
A Discussion on Group Detection Application
There are several applications that can benefit from the knowledge of intrinsic
2.4. A Discussion on Group Detection Application 25
Figure 2.9. Average delivery ratios, for the different origin nodes, from
November-2008 to June-2009
delivery ratios of nodes that have been in the same group with the source of a given message and of nodes which have not been in the same group of the source.
In our experiment, we select a node as the origin of a message and simulate an epidemic transmission, i.e., at every time that a node which has the message meets a node that does not have it yet, the message is propagated. We simulate the message propagation selecting each node of the data set as origin and divide the rest of the nodes in two classes: nodes that have belonged to a group together with the origin in the past 30 days and nodes that have not. Then, we compute the delivery ratios of the two classes of nodes. We consider that the message is delivered to nodeN if node N receives the message within seven days after the start of the dissemination.
26
Chapter 2. Group Mobility: Detection, Tracking and Characterization
as discussed in future works. One may notice that, throughout different months, for
some node IDs there are some blank spaces in the graphs of Fig. 2.8. These are origin nodes that were not active in the data set during that given month, and for this reason present 0% delivery ratios to both classes of nodes. In June of 2009 for example, there are several nodes with 0% delivery ratios, which makes sense since many of the students start to leave the campus for summer vacation. Figure 2.9 depicts the average delivery ratios, with different origins, from November of 2008 to June of 2009.
2.5
Final Remarks
In this chapter, we go over a sequence of methodological steps to detect and track social groups in mobility traces. We perform a characterization of groups’ evolution over time considering (i) size; (ii) structure change rates of growth, contraction, birth and death; (iii) group meeting periodicity, and (iv) group meeting durations and its correlation with the strength of group’s bonds and group’s composition stability.
Our results show that social groups’ characteristics are highly dependent on day time. Moreover, group contacts happen periodically fashion, presenting not only daily periodicity, but also a portion of weekly periodicity. It is also noteworthy that groups re-encounter probability decreases over time, meaning that groups that have not met in a while are less likely to meet again soon. Finally, the duration of group meetings is moderately correlated with the stability of it’s members (ρ) and with the strength
of their social bonds (GSCF).
Chapter 3
GROUPS-NET
3.1
Chapter Overview
As discussed in Chapter 1, forwarding algorithms in multi-hop D2D networks have the goal of achieving cost-effective delivery, i.e., the highest possible delivery ratio with the lowest possible network overhead. In this case, the delivery ratio is measured as the percentage of the opportunistically routed messages that are successfully delivered to the destination. Successfully delivered messages are the ones that the base station will not need to deliver itself, enabling bandwidth offload. The network overhead
is measured by the average number of times that the content will need to be D2D-transmitted for the message to get to its destination. A high number of transmissions may negatively impact the users’ experience by, for example, increasing the devices’ energy expenditure.
Considering these metrics, the most successful strategy for opportunistic cost-effective forwarding, Bubble Rap (Hui et al., 2011), relies on information about static
social communities and nodes’ centrality (which can be approximated by the node popularity within the mobile network). The use of Bubble Rap in D2D Networks is proposed in (Li et al., 2014). However, communities have some problems. First, they are computationally expensive to detect (Nguyen et al., 2011b). Second, they are hard to detect in a distributed way since the individual nodes will not have information about the contact graph of the whole network. Existent distributed community detection al-gorithms have at most 85% precision in detected communities, as reported in (Hui et al., 2007). Another problem of community detection algorithms is the parameter calibration. The most successful community detection algorithms depend on param-eters that must be calibrated for each specific scenario (Peel, 2010). In a real-time
application, such as D2D communication, such calibration is not feasible. In addition
28 Chapter 3. GROUPS-NET
to these mentioned problems, there is no established truth for community detection. Abrahao et al. (2012) evaluate community detection schemes and show that, for the same scenarios, different community detection algorithms yielded very different results
for communities’ compositions. Finally, static communities detection does not account for the dynamism in humans’ social relationships, i.e., how they change over time.
Aiming to address these issues, we propose to look at social groups’ meetings, instead of detecting communities. A social group meeting is defined as a group of
people who are together, in space and time, for some social reason or common goal. People in a bus, for example, are together because they share the same goal of getting to a given point of interest. Students in the classroom share the objective of learning the class’ subject content. Friends hanging out at a bar share the social motivation of being together to relax and talk to each other. All of these are examples of social group meetings. As human beings have regular schedules and routines, it is reasonable to expect social group meetings to present some regularity as well.
From the implementation point of view, a device can detect a group meeting of which it is part of by simply looking at the list of devices that remained nearby for more than a threshold time, for example, 10 minutes. This way, groups meetings can be easily detected in a distributed fashion. Moreover, the group meeting detection method does not change depending on the scenario nor requires parameters calibration for each specific network, as in community detection schemes. In addition to those
desirable characteristics, by looking only at recent group meetings or by giving higher importance to more recent meetings, it is possible to account for the dynamic nature of social relationships. All of these favorable characteristics motivated the study of group meetings to propose an opportunistic routing scheme that is better suited for D2D networks than the current social aware proposals. Therefore, the specific contributions of this chapter are the following:
• A characterization of group meetings regularity properties and its modeling as a Poisson process, which enables to predict future meetings using the information about the most recent ones;
• An analysis of the state-of-the-art synthetic mobility models which allows us to conclude that group meetings’ properties are not well captured by the synthetic traces generated from such models.
3.2. Group Meetings Detection and Tracking 29
main properties of group meetings that make them interesting in the design of a new forwarding strategy. Section 3.4 introduces GROUPS-NET, a group meetings-aware routing protocol. Section 3.5 presents a comparison of real and synthetic mobility traces with respect to the presence of group mobility. Section 3.6 comparatively evaluates GROUPS-NET, contrasting its performance with the state-of-the-art solution, Bubble Rap, in different network scales. Finally, Section 3.7 presents the final remarks and future work.
3.2
Group Meetings Detection and Tracking
Group meetings may be easily detected in a real scenario by looking at the list of near devices, for instance. However, to study group meetings properties it is neces-sary to detect group meetings from pairwise contacts traces, which are the typically available data sources to study social-aware forwarding algorithms. In such traces, each pairwise contact is registered with the two nodes involved and the time when the contact happened. Therefore we have used the group detection methodology proposed in Chapter 2. Notice that in a real distributed scenario these steps would not be neces-sary since group meetings detection is simple to perform distributively. However, this methodology must be applied to enable such study using pairwise contact traces.
In the present study, we used the MIT Reality Mining (Eagle and Pentland, 2006) and Dartmouth (Henderson et al., 2008) traces, which are contact traces containing 80 and 1200 users respectively. In the MIT Reality Mining the monitored users reside in two university buildings and were monitored for several months. Contacts were registered when two users were less than 10 meters apart. Although the MIT Reality Mining trace consists of a specific and small scale scenario, we considered this trace
because it is the original trace used to validate Bubble Rap in (Hui et al., 2011). The Dartmouth trace registered contacts of all of the students in a university campus for two months. To the best of our knowledge, Dartmouth is the largest scale and publicly available contact dataset. Due to its scale and generality, the Dartmouth trace is a better representation of a real D2D cellular network environment.
3.3
Social Group Meetings Properties
30 Chapter 3. GROUPS-NET
(a) (b)
Figure 3.1. a) Probability of a given group re-meeting t hours after its first
meeting. Red dotted lines represent 24-hour periods and green dashed lines 7-day periods. b) Average delivery ratio, for different origin nodes, from November of 2008 to June of 2009
Figure 3.1(a) presents the frequency of group re-encounters for the MIT Reality Mining, i.e., given the fact that a groupfirst met at timet= 0, how group re-meetings are distributed along the next hours (t hours after the first meeting). The result
reveals that the probability mass is concentrated around peaks of 24-hour periods (represented by red dotted lines). This means that group meetings are highly periodical in a daily fashion. One may also notice higher peaks marked with green dashed lines. Green dashed lines represent periods of seven days, meaning that groups meetings also present weekly periodicity. This periodicity makes sense since people have schedules and routines. This result motivated our next experiment, which tries to answer the question: is it possible to use past group meetings to predict future ones?
3.4. GROUPS-NET: Group Meetings Aware Routing 31
As presented in Figure 3.1(b), for different months, the delivery ratios to nodes
that have been in group meetings with the origin are over two times higher than of the other nodes. Around 90% of the nodes that were in group meetings together with the origin received the message within one week. On the other hand, the delivery ratio to nodes that had not been in a group together with the origin is around 40%. This result conforms with the periodical behavior presented in Figure 3.1(a) (a group that has met in recent past is likely to meet again soon) and is a key insight on how group meetings could and should be used to better design opportunistic routing protocols. One may notice that in June the delivery ratios for both classes significantly drop. This behavior is explained by the fact that the trace was collected in a university campus and, in June, most students in the US start to leave the campus for summer vacation. To use group meetings to design a forwarding policy, there must be a representa-tive statistical model for group meetings regularity. Due to group meetings’ periodicity, presented in Figure 3.1, it makes sense to model such behavior as a Poisson process. In a Poisson process, the accumulated number of occurrences along the time must be well approximated by a straight line with slope λ. To verify the goodness of fit of group meetings to a Poisson process, for each group in the trace, we perform a linear regression of the number of meetings over time. Then, we compute the R2 value of each group, which measures how well the linear modelfits to the number of meetings. Figure 3.2 exemplifies such regression for different values of R2. Figure 3.3, which
presents the frequency distribution ofR2 for all groups in the trace, shows that group meetings have a good fit to a Poisson process, most of them with R2 values of 0.85
or higher. We use this Poisson process model to design our forwarding algorithm, as discussed in Section 3.4.
3.4
GROUPS-NET: Group Meetings Aware
Routing
32 Chapter 3. GROUPS-NET
(a) (b)
(c) (d)
Figure 3.2. Poisson processfit for different values ofR2
Figure 3.3. R-squared distribution for Poisson distributionfits of each group of
3.4. GROUPS-NET: Group Meetings Aware Routing 33
(i) the probability of groups A and B meeting again in the near future, and (ii) the probability of a message being carried from a group A to a groupB by a person who is member of both groups. To compute such probability, GROUPS-NET relies on two main properties:
• Meetings regularity: Each group is assigned with a probability of meeting again soon, which is based on the number of times that the group has met in the recent past. We show, in Section 3.3, that it follows a Poisson process. The regularity property comes from the group meetings periodical behavior, depicted in Figure 3.1(a). The key insight is that the higher the number of meetings of a group in the recent past, the higher the probability of that group meeting again in the near future. By only considering meetings in the recent past, the meetings regularity property accounts for the social dynamism of human relationships.
• Shared group members: In a group meeting, a message can be propagated for all
nodes involved in the meeting. However, the message must be propagated forward to the next group and so on, until it reaches a group that the destination node is member of. This group-to-group propagation is made by nodes that belong to both groups linked by an edge. If two groups have a higher number of member nodes in common, there is a greater probability for the message to be carried from group A to group B, for instance. Thus, higher probabilities should be assigned to edges between groups that have more shared members.
To combine both of the aforementioned properties, GROUPS-NET assign edges’ probabilities as the product of the probabilities of each of the groupsAandBmeeting again (meetings regularity property) weighted by the similarity inA andBof member compositions (shared group members property). Figure 3.4 illustrates the GROUPS-NET algorithm.
Theλvalue of a group in the Poisson process is the inverse of the group’s average
inter-meeting time. Thus, given a fixed-time window size of length L, which is the considered time to look back in past (e.g., 3 weeks), theλof a group can be estimated
by:
λ= number_of_meetings
L . (3.1)
Since group meetings follow a Poisson process (as we show in Section 3.3), the probability of a given group to meet K times in the t-time interval is given by the expression:
P[N(t) =K] = e
−λt(λt)K
K! . (3.2)
34 Chapter 3. GROUPS-NET
Figure 3.4. Example of a GROUPS-NET scenario. The base station assembles
the groups graph. Nodes’ weights are the number of meetings of each group during the last week and edge weights are the number of members shared by each pair of groups. Nodes and edges weights are then used to generate a probabilistic graph according to the Meetings Regularity and Shared Group Members properties
group to meet again at least one time during the considered time interval t:
P[N(t)�1] = 1−P[N(t) = 0] = 1−e−λt. (3.3)
Equation 3.3 shows that the frequency in group meetings can be used to compute the probability of a group meeting to happen at least once in the near future time t. Thus, GROUPS-NET sets nodes’ probabilities according to Equation 3.3. The time t should be set according to the messages’ TTLs of the network.
To consider the probability of the message being propagated between two different
3.4. GROUPS-NET: Group Meetings Aware Routing 35
members composition as:
P(m:G1→G2) = |V(G1)∩V(G2)|
|V(G1)∪V(G2)|. (3.4)
After setting the edges probabilities, the algorithm re-computes each edge weight as the product of each of the groups’ re-meeting probabilities (computed with Equation 3.3) multiplied by the groups’ composition overlap, as in Equation 3.5.
W(EG1,G2) =P(G1→G2)×PG1[N(t)�1]×PG2[N(t)�1] (3.5)
Therefore, with edges’ probabilities set, the most probable group-to-group prob-ability can be computed by the product of each edge in its path (Equation 3.6). By exploiting the logarithm-likelihood property described in Equation 3.7, the most prob-able path can be simply computed by a shortest path algorithm, such as Dijkstra, after setting each edge weightW(Ei,j) to−log(W(Ei,j)).
P(R) =�W(Ei,j), Ei,j ∈R. (3.6)
arg_max( R �
W(Ei,j)) =arg_max(log( R �
W(Ei,j)))
=arg_max( R �
log(W(Ei,j))).
(3.7)
Using this modeling, we propose GROUPS-NET to compute the most probable group-to-group path and forward a message opportunistically to nodes that belong to such route. GROUPS-NET is formalized in Algorithm 1.
The GROUPS-NET algorithm has an upper bound defined by the computation of the shortest path in a graph, which has time complexity of O(V2log(V)), where
V is the number of different groups in the network, i.e., vertexes in the groups graph
G[V, E]of Algorithm 1.
Notice that to compute the most probable group-to-group path, it is necessary to centralize the information about recent group meetings at some point. Such com-putation is made possible by the D2D architecture, which defines a centralized control
plane and a decentralized data plane. This is the reason why GROUPS-NET properly
fits applications in the D2D networks, but it is not necessarily feasible in purely
36 Chapter 3. GROUPS-NET
Data:
The past time window: T;
The list of groups detected within T: L;
The number of meetings of each groupGiin L; D2D network messages‘ time to live: TTL; Origin: o;
Destination: d;
Result: The list of devices to forward the message to forallGi in L do
λi = M eetingsT (Gi) P(Gi) = 1−e−λi×T T L
end
G[V,E] =∅
forallpairs (Gi,Gj) in L do
W(Gi, Gj) = devicesdevices((GiGj))∩devices∪devices((GjGi)) G[V,E].add_edge(Gi,Gj)
G.E(Gi,Gj).weight =
−log(W(Gi, Gj)×P(Gi)×P(Gj))
end
R = shortestPath(G[V,E],o,d) ForwardingList = ∅
forallNetwork Devices Di do if Di∈Rthen
ForwardingList.add(Di)
end end
returnForwardingList;
Algorithm 1:GROUPS-NET route selection algorithm.
When a given origin device wishes to send a content to a destination, it sends a request to the base station, which computes the most probable group-to-group path and sends it back to the origin device. Next, the forwarding policy proceeds as follows: starting by the origin device, each device will make the decision of forwarding or not the content to a new encountered device based on the condition that the encountered device must be a member of at least one of the groups that belong to the most probable group-to-group path.
3.5
Synthetic vs Real World Mobility
3.5. Synthetic vs Real World Mobility 37
(a) MIT (Real Trace) (b) Dartmouth (Real Trace)
(c) SWIM (Synthetic Trace) (d) WDM (Synthetic Trace)
Figure 3.5. Comparison of group meetings periodicity in real and synthetic
mobility traces
models. Specifically, we want to see if such models capture group re-encounters and
their evolution over time to be able to decide if they are representative, considering the group mobility feature and if they should or not be used in the validation of opportunistic networking protocols based on group meetings and social context.
Firstly, we apply the methodology for detecting and tracking groups, defined in
38 Chapter 3. GROUPS-NET
3.5(b) show the P.D.F. of group re-meetings along the time for the real world traces. In both of the real mobility traces we can verify the presence of periodicity in groups’ re-encounters. By looking at both of them we see that the mass of probability is concentrated in peaks aroud the red dotted lines, which represent periods of 24 hours. We also observe in both Figures 3.5(a) and 3.5(b) that higher peaks are presented around the green dashed lines, which represent periods of seven days. As discussed in Section 3.3, this pattern in the group re-meetings’ P.D.F. shows that group meetings present daily and weekly periodicity. It is noteworthy that such pattern is observed in both of the real traces, even though they are from different places, have different number of nodes, and used different data collection methods. Next, we leverage three
widely used state-of-the-art synthetic mobility models to verify if they represent well the role of social groups to mobility.
The SWIM mobility model was introduced by Mei and Stefa (2009) as a model to generate synthetic small worlds which preserve the pairwise contact duration and inter-contact times statistical distributions as they are observed in real mobility traces. The SLAW mobility model (Lee et al., 2009) was designed to capture several significant
statistical patterns of human mobility, including truncated power-law distributions of human displacements, pause-times and pairwise inter-contact times, fractal way-points, and heterogeneously defined areas of individual mobility. The Working Day Movement (WDM) synthetic model (Ekman et al., 2008) is a model designed to capture these same statical properties of contact durations and inter-contact times as SWIM and SLAW. In addition to those properties, WDM aims to capture the daily regularity of human movements, i.e., how human routines after their mobility.
As we did for the real traces, MIT and Dartmouth, we have applied our group detection and tracking methodology to the contact traces generated by these three synthetic models. Figures 3.5(c) and 3.5(d) present the results for the SWIM and WDM models, respectively.
The contact trace generated by the SWIM model (figure 3.5(c)) do not present any regularity in group meetings. Out of the detected groups only three group re-meetings were registered in a period of 15 days. The result for the contact trace generated by the SLAW model presented an analogous behavior, i.e., no regularity in group meetings. This behavior is explained by the fact that such models were designed to be representative of the statistical properties of pairwise contacts only, without considering that human contacts often involve more than two peers. These models look only at pairwise contacts, disregarding group meetings.
In the WDM trace (figure 3.5(d)) we can observe that group re-meetings happen
3.6. Comparative Analysis 39
traces. This behavior is observed because WDM firstly defines a set of places, called
offices, and than distribute nodes to transition between pre-defined subsets of offices with daily periodicity. Therefore, nodes with intersections in their lists of offices will
always form groups with exaggerated meeting regularity.
By analysing the group meetings regularity of the synthetic models, we conclude that none of them represent well the group mobility patterns. For this reason, none of the synthetic modelsfits for evaluating GROUPS-NET which is based on the group
meetings regularity. Therefore, in Section 3.6, we evaluate GROUPS-NET using only real mobility traces, which do not suffer from such biases. We also highlight the need for designing mobility models which better represent role of social groups and their regularity in human mobility.
3.6
Comparative Analysis
To validate the performance of GROUPS-NET, we compare it to the forwarding al-gorithm that achieved the most cost-effective performance for D2D networks: Bubble
Rap (Hui et al., 2011).
3.6.1
Bubble Rap Algorithm
The Bubble Rap algorithm identifies static social communities by looking at densely
interconnected nodes in the aggregated contact graph during the whole trace using the Clique Percolation Method (Palla et al., 2005). Therefore, each node in the network must belong to at least one community. Nodes that do not belong to any community are assigned to a pseudo-community of one node. This is necessary for the forwarding algorithm operation. Moreover, each node gets a measure of its global popularity in the network (GlobalRank) and a local measurement of popularity, which is valid within that node’s community (LocalRank). Using these parameters, the forwarding strategy works as follows:
• At each encounter, a given node transmits its content if the encountered node has a higherGlobalRank, or if the encountered node belongs to a community of which the
final destination is a member.
• Once the message is inside thefinal destination’s community, the forwarding process occurs if theLocalRank of the encountered node is higher than theLocalRank of the node that has the message. This procedure goes on until the message reaches the