325
Abstract
Static and dynamic effects on power transmission towers can be evaluated by methodologies available in codes, which suggest the use of linear static analysis. By us-ing numerical simulations, it is possible to observe the strong inluence of the geometric nonlinear behavior of transmission cables. Dynamic effects also strongly inluence this behavior, with the possibility of resonance between the cables and the structure, but up to the moment, the existent analysis procedures have not been completely validated on an experimental basis. In order to validate a complete analysis methodology, experi-mental procedures are proposed for a suspension tower of a 138kV transmission line in use. A tridimensional anemometer was installed on this structure in order to measure the values and directions of wind speeds. Simultaneous strain values were collected on the main elements of the tower through optical extensometers. Optical sensor technol-ogy with Fiber Bragg Gratings was used, due to the characteristic of immunity to the electromagnetic ield occasioned by high electric currents. The string swing angle was evaluated through a high-resolution camera and a tridimensional accelerometer. With this instrumentation, it is possible to create a complete database that correlates wind speeds with the responses of the structural set. At the moment, 5 months of data have been collected and the instrumentation is in the inal testing phase and synchronized. After this step, real-time measurements will be performed.
keywords: monitoring of transmission lines, optical sensors, Fiber Bragg Grating.
Hermes Carvalho
Professor Adjunto
Universidade Federal de Minas Gerais – UFMG Departamento de Engenharia de Estruturas Belo Horizonte – Minas Gerais – Brasil [email protected]
Gilson Queiroz
Professor Associado
Universidade Federal de Minas Gerais – UFMG Departamento de Engenharia de Estruturas Belo Horizonte – Minas Gerais – Brasil [email protected]
Ricardo Hallal Fakury
Professor Titular
Universidade Federal de Minas Gerais – UFMG Departamento de Engenharia de Estruturas Belo Horizonte – Minas Gerais – Brasil [email protected]
Experimental evaluation of the
wind effects on an operating
power transmission tower
Mechanic and Energy
Mecânica e Energia
http://dx.doi.org/10.1590/0370-44672015690052
1. Introduction
Concerns related to loadings result-ing from the wind actions on overhead transmission line components have been growing in Brazil in recent years, as in other countries, since the breakdown of these structures may result in losses of greater importance in a power supply system. The newspaper "The State of São Paulo" report-ed that on November 4, 1997, winds up to 36 m/s caused the collapse of 10 transmis-sion towers in the Itaipu plant. This case is just one example, since from the beginning of the construction of latticed metal towers, there have been several similar records due to strong winds. This suggests that in the absence of another phenomenon, the wind load can be severe enough to cause the col-lapse of overhead lines towers.
Current calculation methodologies suggested by the transmission tower stan-dards indicate the use of linear analysis with static loadings equivalent to wind effects. Effects of non-geometric linearity obtained by nonlinear analysis of the entire
structural set (tower, insulators and cables), were considered relevant for long span cable structural systems (CARVALHO, 2010). Dynamic analysis indicated efforts up to three times higher than those obtained by means of equivalent static analysis, indicat-ing that the occurrence of accidents caused by the wind may be intensiied if the tower analyses are conducted using inappropri-ate models (RODRIGUES, 2004). Many theoretical studies have been developed so far, but only a few experimental validations have been performed.
With this motivation, this article aims to present an experimental project developed by CEMIG (Companhia En-ergética de Minas Gerais), in partnership with the Federal University of Minas Gerais (UFMG) in a 28-meter height suspension transmission tower, with a 138 kV air phase line / phase component. With the monitoring system in operation, it becomes possible to obtain simultaneous recordings of the insulator string balance,
wind speed and delections on the support structure in real situations. These data will allow the validation of analytical methods, since they contain information relating to the actions and their structural responses.
For obtaining experimental infor-mation, real-time monitoring technology has been used, adapted for measuring the balance of insulator strings and other quantities (MOLINA, 2014). The monitoring system is composed of the following subsystems:
• Power set (solar panels and batteries); • Electrical sensing elements (humid -ity, temperature, solar radiation, wind speed, swing angle);
• Electrical data logger;
• Optical sensor elements (structure temperature and strain);
• Optical data logger (OSA - OPTI -CAL SPECTRUM ANALYZER);
• Digital camera;
326
2. Experimental methodology
2.1 Monitoring System Structure
The structure under study was monitored, as well as all the informa-tion relating to wind acinforma-tions and their structural responses. There is a wind gauge and a measurement system for
obtaining the actions and the swing angle of the insulator strings, which consists of an acquisition system and data communication, an inertial plat-form, climatological sensors, and an
image and document camera feeding system. The simplified diagram in Figure 1 shows the integrated balance sensor with the other components of the system.
Figure 1
Balance Monitoring System Structure.
The camera data system, the inertial platform and transmission components of the angle measuring system are in a metal housing. The inertial platform is attached to the in-sulator strings. For setting the camera,
an auxiliary structure has been built in order to move it away from the tower structure along the transmission cables, enabling the capturing of the insulator strings’ transverse movement. A set of batteries, solar panels and a charge
controller have been used for feeding the system.
Figure 2 shows the lab setup and Figure 3 shows the sensors clamping arrangement and other equipment in the tower’s metal structure.
IMU / Balance Sensor
Digital Camera
Modem GPRS
Datalogger # 1 CR1000
Datalogger # 2 CR1000
Battery 12V
Voltage Controller
Charger
Solar Panel
0-5Vdc
0-400mVdc
0-2-5Vdc
RS-232
RS-232
CSI/0, RS-485
12Vdc TX/RX
SDI-12
Ultrasonic Anemometer 3D
Temperature and Humidity
Solar Radiation
Barometer
327
Figure 2 Experimental setup in the lab:
(a) digital camera; (b) temperature and humidity sensor; (c) solar radiation sensor; (d) wind speed sensor; (e) swing angle sensor along the insulator strings; (f) electrical data logger.
Figure 3 Setting of the monitoring system in the tower:
(a) swing angle sensor; (b) digital camera; (c) solar panel; (d) box with data logger, battery and modem; (e) Solar radiation sensor, temperature sensor, 3D wind speed sensor and atmospheric pressure sensor.
The string displacement is cap-tured by the camera from a given wind speed value or a stipulated swing angle value. A logical pulse data logger trig-gers the camera, initiating a sequence of photos. The remote acquisition of information from the measuring system and the recording of the swing angle, installed in the ield, are performed by means of a modern GPRS. A remote access may be done through a computer equipped with a modem.
The structural responses are cap-tured through strain sensors installed in the main structural elements in the tower at a frequency of 1 Hz. As the
electrical strain sensor is very sensitive to the inluence of external electro-magnetic ields, caused by the high current of the electrical cables, opti-cal strain gages with Bragg Grating were used because they are immune to electrical interference.
As the tower structure was built with equal-sided angles, two strain sen-sors have been used on each structural element object of analysis. Local effects on the equal-sided angles were evaluated in the lab and are negligible. Figure 4 shows the tower instrumented elements, as well as their respective arrangements in the structure as a whole.
The inluence of bending in the equal-sided angles structure will be eliminated with the use of two strain sensors on each part, with a sensor on each tab, on the neutral axis.
Due to the high sensitivity of optical strain gages to the temperature variation, an optical temperature sensor was installed next to each pair of strain gages. The measured strain values, which in this case are total delections, may be broken down into two parts, one corresponding to the steel and optical iber cable temperature ranges and the other, delections due to the load as set forth in Equation (1).
∆ε
total=
∆ε
load+
∆ε
temperature=
∆λ
B( 1 +
ρ
e) λ
B+ (TCS)
∆
T
(a)
(f) (b)
(c)
(e) (d)
(a)
(b)
(c) (e)
(d)
328 Where:
∆εtotal = strain variation measured in
the structural element;
∆εcarga = strain variation due to load
variation in the structural element;
∆εtemperature = strain variation due to
temperature variation on the structural element;
∆λB = wavelength variation relected
on the optical iber;
ρe = Bragg grating sensitivity to
strain, equal to -0.22;
λB = Bragg grating wavelength
re-lected on the optical iber;
TCS = Bragg grating sensitivity
crossed to the temperature equal to 8.59 με / ° C;
∆T = temperature variation.
Figure 4
Location of the sensors within the tower elements.
2.2 Balance Sensor Development
The angle measurement system is composed of an inertial platform called IMU (Inertial Measurement Unit). Through the combination of three-dimen-sional sensors (accelerometers, magnetom-eters and gyroscopes), the inertial IMU allows determining the state of any system to which it is attached. Inertial platforms are commonly used in aircraft navigation systems, satellites, cars, etc.
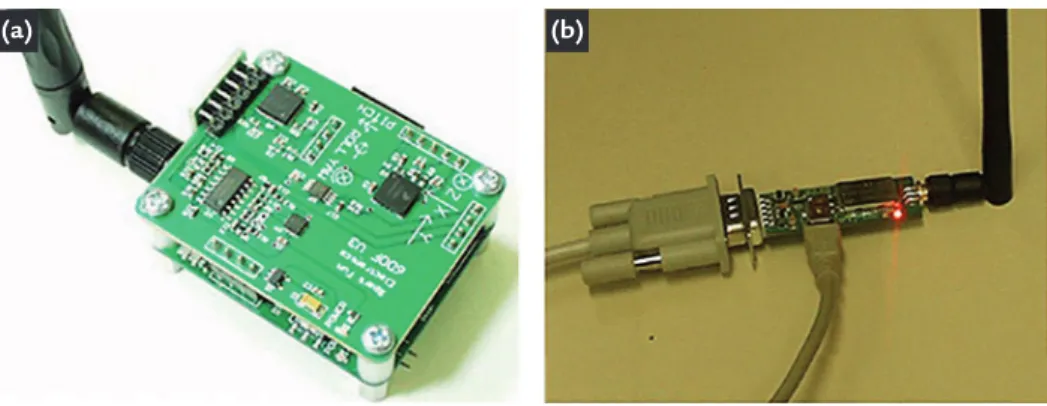
On the balance sensor prototype,
the IMU Spark Fun Electronics, model IMU 6-DOFv3 was used, which uses three integrated circuits CI-IDG-300, containing two independent vibrating gyroscopes. The IMU consists of two electronic circuits that communicate via RF signal (Bluetooth). The irst, shown in Figure 5a, contains sensors (accelerometer, magnetometer and gyroscope) and an RF transmitter. The second unit, shown in Figure 5b, is the receiver circuit, which
connects to a data logger via serial inter-face to collect information. The inertial platform data are values from a 10 bit AD converter and eight data channels for measurements of acceleration data (x, y, z), turning rate (x, y, z) and magnetometer data (x , y). The IMU sampling frequency was 10 Hz, enough to avoid aliasing (inac-curate results due to low data acquisition rate) for measuring the balance of an insulator string.
Figure 5
Inertial Platform Spark Fun Electronics: (a) transmitter circuit with sensors and (b) receiver circuit.
Figure 6 shows the angles φ, θ and
ψ in relation to the inertial platform co-ordinate axes, which are attached to the insulator strings referred to, respectively, Pitch, Roll and Yaw. To obtain the
insula-tor string tilt angles, for which a rigid body behavior is assumed, you must only know the φ and θ angles, as they are the string degrees of freedom. The swing angle θ is orthogonal to the driver position; the angle
φ has a value different from zero when there is a longitudinal displacement of the insula-tor strings, a situation corresponding to the breakdown of the driver cable or unbal-anced horizontal stresses of adjacent cables.
Figure 6
Inertial Platform and measured quantities.
329
2.3 Field Installing
A suspension structure of a 138 kV transmission line has been chosen for the installation of the measuring and monitoring system for the structural behavior of the system consisting of a
tower and cables subjected to the wind action. On the same tower, a meteo-rological station has been installed at a 10m height, allowing us to monitor both the wind direction and speed,
solar radiation and other weather data. Figure 7 shows the installation of the angle measurement sensor, the digital recording system (camera) and the cli-matological station.
Figure 7 Installation of the accelerometer and the measurement angle digital recording system.
Figure 8 shows the installation of an optical strain sensor and the system power set, comprising batteries and solar panels.
Figure 8 Optical sensor installed in the structural
element and the system power set.
3. Outcome
3.1 Results obtained in the field
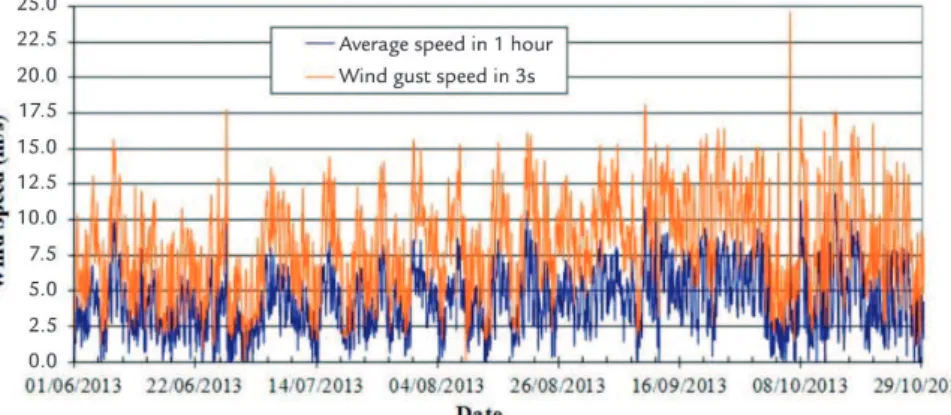
For 5 months, wind speed values were collected in the structure under study with average values at 3 seconds (gust values) and hourly average. Through analysis of the col-lected values, it was possible to observe that the average speed values in August,
Septem-ber and OctoSeptem-ber overcome in 20% to 40% the average values acquired in June and July. Such result was expected since the months of August and September in the assessed region are characterized as the months of greatest wind inluence. The maximum
wind speed averaging 3 seconds was equal to 24.6m/s, about 75% of the maximum value expected for the region, according to the reference standard ABNT NBR 6123, for a recurrence period equal to 50 years. Figure 9 shows the obtained values.
330
Figure 10 shows the histogram of the collected speeds during 5 month measuring.
Figure 10
Wind speeds averaging 3 seconds and hourly average.
Figure 11 shows the strain and temperature values collected by opti-cal sensors, with temperature
inlu-ence only on the strain. The strain variation observed in sensors 2 and 3 are related to the temperature
variation in sensor 1 and strain in sensors 5 and 6 to the temperature of sensor 4.
Figure 11
Strain and temperature values collected at each second, with temperature influence on the strain.
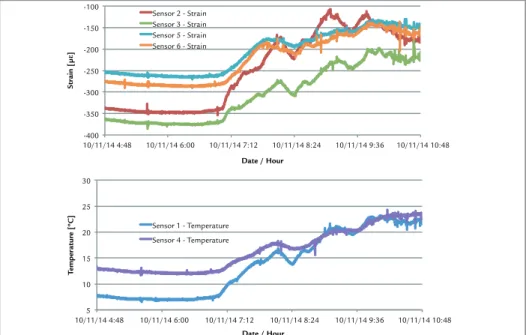
Figure 12 shows strain and tem-perature values listed by optical sen-sors with temperature inluence and
wind loads during strain. The varia-tion observed in the strain sensors 2 and 3 are relative to the temperature
variation in sensor 1 and the strain in sensors 5 and 6 to the temperature sensor 4.
Figure 12
Strain and temperature values
collected at each second, with temperature and wind load influence on the strain.
-300 -250 -200 -150 -100 -50 0
8/11/14 17:02 8/11/14 19:26 8/11/14 21:50 9/11/14 0:14
Strain [
µ
]
Date / Hour
Sensor 2 - Strain Sensor 3 - Strain Sensor 5 - Strain Sensor 6 - Strain
5 10 15 20 25 30
8/11/14 17:02 8/11/14 19:26 8/11/14 21:50 9/11/14 0:14
T
emperatur
e [ºC]
Date / Hour
Sensor 1 - Temperature Sensor 4 - Temperature
5 10 15 20 25 30
10/11/14 4:48 10/11/14 6:00 10/11/14 7:12 10/11/14 8:24 10/11/14 9:36 10/11/14 10:48
T
emperatur
e [ºC]
Date / Hour
Sensor 1 - Temperature
Sensor 4 - Temperature
-400 -350 -300 -250 -200 -150 -100
10/11/14 4:48 10/11/14 6:00 10/11/14 7:12 10/11/14 8:24 10/11/14 9:36 10/11/14 10:48
Strain [
µ
]
Date / Hour
331 ASSOCIAÇÃO BRASILEIRA DE NORMAS TÉCNICAS – ABNT. NBR 6123: Forças devidas ao Vento em Ediicações. Rio de Janeiro, 1988.
BLESSMANN, Joaquim. O Vento na Engenharia Estrutural. Porto Alegre: Ed.
Universidade/ UFRGS. 1995. 282p.
CARVALHO, H. Metodologias para análise estática do efeito do vento em linhas de transmissão. Belo Horizonte: Universidade Federal de Minas Gerais, 2010. 190p.
(Dissertação de mestrado em Engenharia Mecânica).
HAPPOLDT, H. Centrales Y Redes Eléctricas. Barcelona, España:
Springer-Verlag, 1971. 472p.
MOLINA, R. et al. Cálculo e medição do ângulo de balanço de cadeias de iso-ladores de linhas de transmissão. Revista Iberoamericana de Ingenieria Mecanica, v.
1, n.18, p.145-159, 2014.
PAVEL, F., KOJI F., FRIEDRICH, K., JAN R. Tower top geometry and mid span clearances. Paris: CigreWorking Group B2, 2007. 187p.
PEREIRA, D.C.A. Sensores de ibra óptica baseados em redes de Bragg para monitorização ambiental e estrutural. Porto: Universidade do Porto, 2003. 210p. (Tese
de Doutorado em Engenharia Elétrica).
RODRIGUES, R.S. Mecânica do colapso aeroelástico do torres TEE. Rio de Janeiro: Universidade Federal do Rio de Janeiro, 2004. 232p. (Tese de Doutorado em Engenharia Civil).
Received: 26 March 2015 - Accepted: 18 May 2016.
5. References
The experimental results are very important for the improvement and validation of a complete methodology (static and dynamic) for the analysis and design of overhead power lines towers. Only after this validation, will it be possible to evaluate and reine the line design’s criteria.
This work presented a measuring
and monitoring system for the structural behavior of a system consisting of a tower and cables subjected to the wind action, based on a real-time monitoring system of transmission lines. The wind speed, strain and temperature values obtained by sensors installed on the structure have been presented.
It was possible to evaluate and
vali-date, through lab tests, the use of com-mercial optical sensors on the analysis of strain in structural steel elements, which had adopted its use.
At the moment, the instrumentation is in the inal testing phase and synchro-nization. After this step, real-time mea-surements will be performed, using all the instruments installed on the structure.