http://dx.doi.org/10.1590/0104-530X3439-16
Resumo: O mundo está vivenciando uma profunda mudança climática, causada pela atividade predatória do homem, tendo em vista que as atividades econômicas foram exercidas sem preocupação com os impactos causados ao meio ambiente. Entretanto, na atualidade, percebe-se a necessidade de se expandir a economia atual sem comprometer os recursos necessários para a sobrevivência das futuras gerações. O uso intensivo de fontes alternativas de energia se conigura uma contribuição a essa nova perspectiva de desenvolvimento. Em outra vertente, as principais técnicas de análise de viabilidade econômico-inanceira são amplamente conhecidas, entretanto, a aplicação de técnicas que considerem o risco não é tão trivial. Assim, o presente trabalho aborda a seguinte questão: é possível analisar a viabilidade econômico-inanceira de um potencial parque de geração de energia eólica em diferentes localidades do Brasil considerando o risco por meio das técnicas auxiliares simulação de Monte Carlo e a distribuição Beta? Para responder tal questionamento, foram realizados testes considerando quatro diferentes localidades no Brasil, aplicando o método da Taxa Interna de Retorno (TIR) aliado às mencionadas técnicas auxiliares a im de considerar o risco na análise de investimentos. Os resultados demonstraram a sensibilidade do projeto eólico à necessidade de inanciamento para todas as regiões estudadas.
Palavras-chave: Energia eólica; Viabilidade econômico-inanceira; Taxa Interna de Retorno.
Abstract: The world is experiencing a deep climate change caused by the predatory activity of man, due to the long time economic activities practiced without concerns on the environmental impacts. However, nowadays there is the necessity to expand the current economy without compromising the necessary resources for the survival of the future generations. The intensive use of alternative energy conigures a contribution to this new development path. In another perspective, the main technical analysis of economic and inancial feasibility is widely known; however, the application of techniques that consider the risk is not so usual. Thus, this current work addresses whether it is possible to identify the economic feasibility of a potential wind power generation plant in different Brazilian locations considering the risk of applying Monte Carlo simulation and Beta distribution techniques. In order to answer this question tests were performed in four different locations in Brazil, utilizing the Internal Rate of Return (IRR) method with the mentioned techniques to consider the risk in investment analysis. The results showed the sensitivity of the wind project to the inancing costs, regardless the region studied.
Keywords: Wind power; Economic and inancial viability; Internal Rate of Return.
Analysis of economic and financial viability and
risk evaluation of a wind project with Monte Carlo
simulation
Análise de viabilidade econômico-financeira de um projeto eólico com simulação Monte Carlo e avaliação de risco
Carlos Alberto Anjoletto Macedo1 Andrei Aparecido de Albuquerque1
Herick Fernando Moralles1
1 Universidade Federal de São Carlos – UFSCar, Rodovia Washington Luís, SP-310, Km 235, CEP 13565-905, São Carlos, SP, Brazil, e-mail: [email protected]; [email protected]; [email protected]
Received Sept. 02, 2016 - Accepted Feb. 07, 2017 Financial support: None.
1 Introduction
Climate change has entered the political and economic debate of the 21st century. Year after
year, natural disasters are recorded around the planet and are usually attributed to human activity
on Earth. According to the Intergovernmental Panel on Climate Change (IPCC), most scientists suggest
that there is a correlation between such climatic
events and global warming, whose main cause is the increased concentration of greenhouse gases in
the atmosphere, especially CO2 from the burning of fossil fuels (Dincer, 2000; IPCC, 2001).
compromising the resources needed for the survival of future generations. For this purpose, the greater use of alternative energy sources would be a good solution, generating great business opportunities on
a global scale (Dincer, 2000; Sims, 2004).
According to the Renewable Energy Policy Network for the 21st Century (REN21) the most commonly used renewable sources are: biomass,
geothermal, ocean tides, hydro, solar and wind
sources. Together, they accounted for 21.7% of all the produced energy in the world in 2012. In absolute terms, renewables had 1,470 GW of installed capacity, of which 990 GW came from hydroelectric plants.
In that same year, wind energy showed the highest
growth among renewables, around 39% of additional
capacity, followed by hydroelectric and solar plants,
which expanded 26% each (REN21, 2013).
Brazil, is one of the global leaders in renewable
energy generation, according to the Energetic Research Company (EPE), whose reports indicate the share of renewables in the Brazilian Energy Matrix is among the highest in the world, reaching a mark of 42.4% in 2012. When we observe only the Brazilian Electrical Matrix of 2012, this percentage reaches an incredible 84.5%, of which 76.9% came from hydraulic sources, 6.8% from biomass and 0.9% wind (EPE, 2013a). These igures relect
the old strategy of investing only in the country’s water potential.
Dutra & Szklo (2008) argue, on the other hand, that in 2002, Brazil launched the Alternative Energy Sources Incentive Program (PROINFA) in order to
reduce this dependence on hydroelectric dams. In fact, the program consolidated several incentive measures
adopted in the 1990s to explore the potential of the
country’s biomass, small hydroelectric and wind power resources. Therefore, the authors explain
that two stages were deined: the irst one aimed at adding 3,300 MW of installed capacity, 1,100 MW
for each modality, requiring the approved projects
to start operating in December 2006. In the second stage, a wider goal: by 2026, 10% of all energy
consumption in Brazil should come from alternative sources of energy.
In addition to different goals, the second step changed the way of contracting energy projects (Dutra
& Szklo, 2008). The federal government opted for
auctions that would stimulate competition among
the three project types rather than offering a ixed amount per kWh for each. According to Dutra & Szklo (2008), this model is interesting because it allows
greater control over the marginal cost of electricity in the long term, but penalizes wind energy, which
has a cost per kWh higher than the others. So the
solution would be to promote separate auctions for
biomass projects (which has the lowest cost per
KWh), something that has happened sporadically. Currently, in Brazil there is an investment prospect in the generation of wind energy. According to the Brazilian Wind Energy Association (ABEEólica), in August 2014, wind power had around 4.5 GW
of installed capacity in the country, distributed in
181 power plants. Only in 2013, there were four
energy auctions, of which three contemplated the
wind power source, resulting in 4.7 GW of contracted energy, most of it in the Northeast. A record to the sector (ABEEólica, 2014).
In this scenario, the following research question
was deined: Is it possible to analyze the economic and inancial viability of a potential wind power generation facility in different Brazilian locations considering the risk through Monte Carlo simulation techniques and Beta distribution? In order to answer this question, the following
research objective has been established: To develop an economic feasibility study of a potential wind power generation park in different Brazilian locations considering the risk using Monte Carlo simulation techniques and Beta distribution.
So, this paper intends to contribute to the literature
by deining the most relevant cost categories to be studied and, inally, to provide a broader view on the
study of the economic feasibility of wind projects in
Brazil by inserting allied risk analysis techniques.
The present study will address a wind project (one case) considering its implementation in
four alternative locations. According to Dutra & Tolmasquim (2000), wind generation projects should
be treated as case studies and, coincidentally, most
of the works found are characterized as these ones. Some examples in Latin America are Watts & Jara (2011), Melo (2012) and Salles (2004). The accuracy
of the information used in this type of analysis is greater, but these are more limited.
This paper is divided into four other sections, in addition to this introduction. Firstly, a bibliographical review about the main topics related to the research
topic is presented. Next, the research method used in this work is discussed. Finally, the obtained
results are presented and discussed through all the
considerations made throughout the text, and inally,
the last section presents the main conclusions and limitations of the research, besides suggesting possible topics for future studies.
2 Bibliographic review
Over the last few decades, evidence of environmental
degradation has become more apparent, which, according
to Dincer (2000), are the result of a combination
population growth and the economy exclusively
focused on consumption, among others. In the 1970s,
the aim was to understand the relationship between
conventional pollutants such as SO2, NOx and CO
and their respective environmental impacts (Dincer,
2000). As time went by, attention has focused on
pollutants with global impact, especially those related
to global warming, which is deined as an increase in
atmospheric temperature due to the increase in the gases concentration emitted by human activities, of
which highlights CO2 (Dincer, 2000; Sahin, 2004). According to Herbert et al. (2007), energy is the
basic ingredient for the socioeconomic development of any country. Since it is essential to the development of nations and uses fossil fuels, electricity generation
accounts for more than 33% of all CO2 emissions
related to the energy sector in the world (Ang et al., 2011). As a result, these authors state that this is
one of the sectors with the greatest potential for reducing the emission of carbon dioxide in the world,
provided that appropriate measures are taken, such
as the use of renewable sources and the increase of
the eficiency in the processes of energy generation. Sims (2004) believes the most plausible solution
is, in fact, the replacement of fossil fuels with
carbon-free energy sources. According to this author,
many technologies have already been developed in this direction and have a high degree of maturity, such as large hydropower, projects that exploit geothermal energy and nuclear energy. However,
all of them are still subject to socio-environmental
concerns. Hydroelectric dams, for example, result in
large looded areas and the consequent removal of riverine families. Geothermal projects raise doubts about its long-term sustainability, since, in order to
be feasible, it requires the rate of heat extraction from the earth to be greater than its replacement.
Nuclear technology is a matter of concern to society
because it does not have an adequate treatment of its waste, because it helps to proliferate atomic weapons and because they are potential targets for
terrorist attacks (Sims, 2004).
Still, Herbert et al. (2007) believe that renewable
energy sources would be the best solution to reduce the global economy’s dependence on fossil fuels as
well as to eradicate carbon dioxide emissions. Among
the available options, wind energy is considered one of the best alternatives because it is environmentally correct and has a huge potential still unexplored.
Banco Nacional de Desenvolvimento Econômico e Social (BNDES) classiies wind turbines as being
devices that convert the kinetic energy present in the air masses into electric energy (BNDES, 2009).
Technically, wind turbines come in two categories,
depending on the direction of their rotating axis: vertical, which is assembled perpendicular to the
ground, or horizontal, which is assembled parallel to
the ground (BNDES, 2009). Horizontal-axis turbines
are more suitable for electric power generation, as their propellers are suspended many meters above the ground, exploiting higher velocity winds. In addition,
the equipment takes up little space in the soil, which
can be used for other purposes, such as agriculture, for example. The counterpoint of this model is that it requires a mechanism that performs a constant repositioning of the rotating axis in relation to
the direction of the wind, something that makes it more costly (BNDES, 2009). Although they do not
pollute the atmosphere or generate radioactive waste,
Leung & Yang (2012) argue that wind turbines are not totally harmless to the environment. According
to them, in order to guarantee a truly sustainable society, we need to understand their environmental impacts, such as bird noise and death.
2.1 The costs of modern wind turbines According to Blanco (2009), the main factors governing the costs of wind power generation are:
a) Acquisition costs – include turbines, ground foundation, construction of accesses and connection
to the electrical network. This category can account for up to 80% of the cost of a project over its useful life;
b) Energy generation costs – include operating and maintenance costs (most signiicant portion),
land rent, insurance and administration fees. These costs are relatively low, accounting for
around 20% of all investment;
c) Energy produced – depends on local winds, turbine speciications and ground characteristics. The indicator that best deines the capacity
of electricity generation of a wind farm is its
capacity factor, which expresses, in percentage, the time that the wind farm effectively produces
energy during the year;
d) Opportunity cost and lifetime of the venture
– both relecting the risk of the project, the domestic market of each country and the proitability of alternative investments. Blanco (2009) points out that the fundamental
difference between renewable energy generation (wind, solar, hydroelectric, etc.) and other conventional sources of energy (thermal, nuclear, etc.) is in the fact that renewables have a zero cost of fuel.
For example, in a natural gas plant, about 40 to 60%
of the costs refer to the purchase of fuel, operating
On the other hand, Blanco (2009) states that wind
projects require high starting capital. In general, according to the author, the entrepreneur must have a good part of the amount to be invested (approximately
80%) before starting. Therefore, credit access and good inancing conditions are prerequisites to the
sector development. However, after the installation process and considering that wind resources have been correctly estimated, the cost of generating power becomes predictable, something that reduces
the overall risk of a company or the portfolio of a country (Blanco, 2009).
2.2 The wind energy market
According to the Renewable Energy Policy Network for the 21st Century (REN21), the global demand
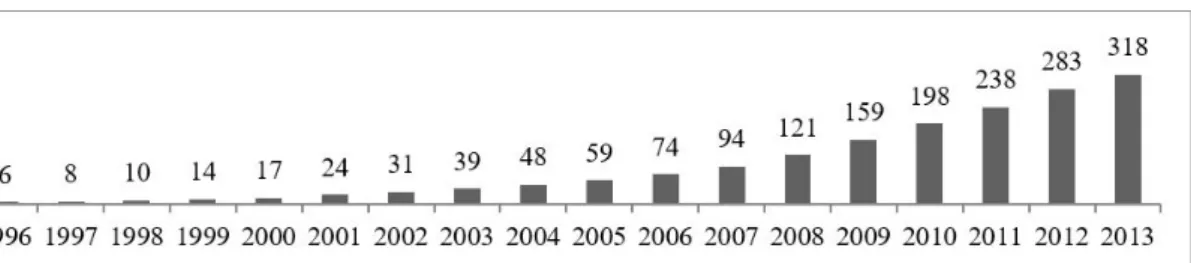
for renewable energy will maintain its growth trend in a short term. The Figure 1 illustrates the growth
of global wind energy capacity from 1996 to 2013. According to the Global World Energy Council (GWEC), the world achieved a signiicant 318 GW of installed capacity in 2013, an increase of 35 GW (12.5%) compared to 2012, which represented a
strong growth in the face of the current economic scenario growth, but below the average growth
observed in the last 10 years (21%). This decline
can be explained in part by the abrupt slowdown in
the US market, which recorded a record expansion in 2012 but did not maintain it during 2013. On the other hand, China had another good year, maintaining
its leadership in the sector and sustaining much of
the global growth (GWEC, 2014).
GWEC also comments that by the end of 2013, only 24 countries had more than 1 GW of installed capacity - Brazil is among them - while only six had more than 10 GW installed. At some point in 2014, China would exceed 100 GW of installed capacity, making Asia the continent with the largest
wind energy production capacity in the world by
the end of 2014, beating Europe (GWEC, 2014).
In the surge of world growth, the Brazilian
energy market, in general, has been showing a
strong expansion in recent years, according to the
Energy Research Company (EPE). Data from the National Energy Balance of 2013 indicate that, in 2012, total energy demand in the country increased by 11.3 million metric tons of oil equivalent (Mtoe), recording a growth rate of 4.1% in relation to 2011. Among all energy-demanding sectors, the
transportation segment, both cargo and people, was
the fastest growing (7.2%).
Within the electricity sector, wind energy appears as a highlight, practically doubling its installed capacity
between 2011 and 2012 (EPE, 2013b). More recent data from the Brazilian Wind Energy Association (ABEEólica) indicate that the month of December 2013 ended with an increase of 10 MW in installed
capacity compared to the previous month, causing
installed wind power to reach 3.46 GW, distributed by 142 parks (ABEEólica, 2014). According to ABEEólica, in August 2014, these numbers jumped to around 4.5 GW of installed capacity, distributed in 181 parks. The Figure 2 illustrates the expected
growth of the Brazilian wind sector up to 2018.
Figure 1. The growth of global capacity of wind energy generation (GW). Source: Adapted from GWEC (2014, p. 21).
2.3 Speciicities of wind generation and
economic viability
The use of hydroelectric plants in Brazil depends on the hydrological regime, which is subject to
signiicant seasonal luctuations, making in some
periods such a matrix is complemented by conventional sources such as the use of thermoelectric power plants. However, wind power can help in generation complementary to hydroelectric power.
Studies such as Silva et al. (2016) show that the
offshore winds of the north and northeast regions of Brazil were highly complementary with the hydrological regimes of the basins of São Francisco,
East Atlantic, Southeast Atlantic, Paraná, Paraguay, Uruguay and South Atlantic; although not correlated
with the Southeast basins.
The same seasonal complementarity between the Brazilian wind and hydroelectric potential is found
in de Jong et al. (2016), demonstrating that wind power can replace all fossil fuel generation by 2020.
In fact, studies have shown that countries in South
America have relevant wind power potential. In fact, Garcia-Heller et al. (2016) observe in their study that large capacity is found in Argentina, followed by Brazil, Mexico and Chile. Speciically, the study
estimates the wind power supply curve in such nations
and creates a scenario for the year 2025, where the Brazilian potential is 26 GWh / year, considering the installation of three-bladed turbines.
Despite its great potential in terms of generation
and sustainability, wind energy presents speciicities in terms of the effects that key attributes such as
location, area, and form of disposal of such systems, so that total output can vary widely according to
such characteristics (Ribeiro et al., 2016).
Such speciicities strongly justify the use of
economical engineering techniques to verify the viability of the installation of such systems, since
the potential of generation in a speciic locality
may not present a return greater than the costs of investment, operation, and capital.
Moreover, most of the recent studies found in the
literature only address the generation potential of the northern and northeastern regions of Brazil, so
this work also contributes to compare the viability
of the installation of such generators in the southeast
region, as well as rarely perform some kind of
investment analysis after calculating the generation potential. In fact, using some search operators with
keywords relevant to the area, few studies not found
in the Scopus database.
Among the studies that address the economical-inancial viability of wind projects, it is possible to ind Li et al. (2013) that they carry out an investment risk analysis of wind projects in
China through a process that estimated the NPV with Monte Carlo method and then analyzed the payback period of the investment. The results of the simulation demonstrated a high investment risk, and
the authors present suggestions for the mitigation or reduction of such possible adversities.
Albadi & El-Saadany (2007) conduct a viability
study considering six wind speed scenarios for different types of wind turbines. However, the study
only presents estimates of IRR, NPV, and payback.
According to Vithayasrichareon & MacGill (2014) and Segura et al. (2007), good inancial planning,
together with a correct data analysis, maximizes the
chance of a successful enterprise. A good example of a inancial study done together with an evaluation of wind data is the work of Kim et al. (2013), which uses the analyzes made by Oh et al. (2012) to deine
the best location for the installation of offshore wind
turbines in South Korea.
In Brazil, Dutra & Tolmasquim (2000) made a
survey of the characteristics pertinent to this type
of project, making use of information about several models of wind turbines available in the market at
that time, thus estimating the costs of installation,
operation and maintenance of the wind parks.
Besides this, other researches were elaborated by Brazilian scholars with the purpose of determining
the viability of Brazilian wind farms. Melo (2012) conducted a study in a Northeastern wind farm, applying several economic and inancial analysis tools - such as Net Present Value (NPV) and Internal Rate of Return (IRR). Salles (2004), on the other
hand, used some stochastic methods to generate
scenarios, such as the Monte Carlo simulation, and
then analyze a hypothetical wind farm economically,
which has been conigured in the most faithful way possible. The situation of cash low in companies
in the sector.
Finally, in spite of the relevance that the viability analyzes have, relatively few studies on wind energy
have been published in Brazil. The present work aims,
therefore, to contribute to the reduction of this gap.
3 Calculation model
This section presents the tools and fundamentals
that were used to prepare an economic-inancial
analysis of the Brazilian wind projects, constituting as the method Internal Rate of Return, Taxa Interna
de Retorno, in risk conditions.
3.1 Internal return rate
According to Ross et al. (2003), the Internal Rate of Return (IRR) of a cash low is the necessary
being considered an intrinsic rate to the project,
since it depends only on the estimated cash inlows and outlows. Its calculation is done as follows:
( ) 0
1
0 1
n t
t t
CF I
IRR =
− =
+
∑
(1)where: CFt = expected inlows of cash in each period; IRR = internal rate of return or periodic equivalent rate of return; I0 = amount of the investment at the time.
As illustrated in this Equation 1, calculating
IRR is not a very simple process, requiring a series
of successive approximations (Ross et al., 2003). Therefore, this work used spreadsheets to calculate
IRR of the studied sites.
According to Melo (2012), once IRR is obtained,
it must be compared to the discount rate (or minimum
acceptable rate of return - MARR) at the moment
the decision on the investment is made. To accept
it, IRR must be greater than MARR, indicating
that the project’s rate of return is greater than its
opportunity cost (Melo, 2012).
3.2 Analysis of investments in risk conditions
According to Melo (2012), the Net Present Value (NPV) and IRR method are classic methods for evaluating any investment; however, they have a deterministic nature, considering the ixed and known cash lows over the useful life of the project
under review.
Thus, considering the complexity of the economic environment and its inherent uncertainty, the present
work makes use of two auxiliary techniques in order
to consider risk in the analysis of investments. These are Monte Carlo Simulation (MCS) and
Beta distribution.
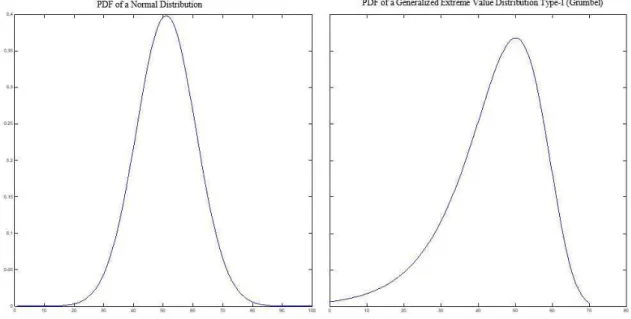
For MCS, the Normal distribution and the distribution of Extreme Values on the left (Gumbel
type I) were considered. The latter, considering its
shape, is intended to relect a pessimistic situation,
considering the higher probability of occurrence of
cash lows below of the expected average value.
Therefore, random numbers were generated
using deterministic lows as the irst moment of the distribution, and the magnitude of 30% of the
same value, as the second moment. The probability
density functions (PDF) of the used distributions
are shown in the Figure 3.
In addition to MCS with the above-mentioned two distributions, we also consider the risk analysis
through the beta distribution, whose moments
are described in Equations 2 and 3, according to Casarotto & Kopittke (1998).
4 6
t
a m b
µ = + + (2)
2
6
t
b a
σ = − (3)
where: µt is the average of the beta distribution; σt2 is
the variance of the beta distribution; a = pessimistic
value; b = optimistic; m = most likely value.
Bearing in mind that beta distribution is truncated, the average and variance moments are based on
optimistic, pessimistic, and more likely estimates for each cash low over time, so there is no need
to posit a priori, a distribution of probability or
variance for cash lows. It should be noted that in
this analysis, the deterministic value was considered the most probable (m), while the pessimistic value (a) represents 60% of “m”, and the optimist 30%
above “m”.
3.3 Weighted average cost of capital
According to Assaf (2002), the resources of a
company can come from its owners or its creditors,
who demand a certain level of return in order to make
capital available for the business. The remuneration formally committed to the creditor, expressed in
the form of interest and other inancial expenses, deines the cost of a loan or inancing operation, i.e. the cost of third-party capital allocated to the project (Assaf, 2002). Similarly, the shareholders or
owners of a corporation expect a certain return on
the investment made in order to offset the risks of
the transaction. Thus, the cost of equity represents that rate of return required by the owners of the
business (Assaf, 2002).
According to Melo (2012), the Weighted Average Cost of Capital (WACC) would be precisely the
balance between these two types of cost and the ideal would be to use it as the discount rate used in
NPV calculations. As a result, WACC was obtained according to Equation 4 (Miller, 2009):
( )
* * 1 *
i i e e
WACC w k= −T +w k (4)
where: wi is the proportion of third-party capital
within the company’s inancing structure; we is the
proportion of equity within the company’s inancing structure; ki is the cost of third-party capital; ke is the
cost of equity; T is the Income Tax rate.
It is important to emphasize that capital costs are calculated, in most cases, according to a method
developed in the 1960s, the Capital Asset Pricing Model (CAPM), which relates which types of risk inluence the expected return for a given portfolio of investment (Perold, 2004). As Perold (2004) describes in his work, the expected minimum
return of a given investment can be expressed in
the Equation 5.
(
)
*
e f M f
k =r +β r −r (5)
where: ke is the minimum rate of return required by
shareholders, which can be understood as the cost of
equity; rf is the rate of return of risk-free assets; rM is
the average rate of return offered by the market in its entirety; β is a systematic risk measure of the asset.
The present study looked at these parameters at Damodaran (2014) and Reuters (2014), which
compile data from various industries and companies in several countries around the world. Unfortunately, there are no data from public sources regarding
Brazil and, therefore, data from the US and Europe will be used, whose markets are better developed
and stable.
The logic of CAPM model was also used to formulate the Minimum Acceptable Rate of Return (MARR) to compute a required minimum return adjusted for risk.
Thus, this indicator was calculated as presented
in Equation 6. That, in performing the calculations, obtained a MARR of 13.12%.
( )
f M f
TMA r= +βr −r (6)
where:rf is the proitability of Tesouro Direto on
09/23/2015 (risk free rate); rM is the total cost of the
BNDES card (market return); β Is the leveraged
beta of the Brazilian electric sector, equal to 0.72, as found in Pinto & Parente (2010).
3.4 The calculation of energy potential According to Masters (2004), the calculation of
the energy potential of a given region is given by
the Equation 7:
*8760*
R
E P= CF (7)
where: PR is the nominal power of the wind farm
(kW); E is the annual energy generated (kWh/year); 8760 is the number of hours in a year (h/year); CF is the capacity factor (percentage of the time that the
park actually produces energy during the year).
Finally, when analyzed wind data were characterized as a statistical distribution of Rayleigh (Weibull with factor k = 2), the capacity factor (CF) could be
obtained from the following Formula 8 (Masters, 2004).
2
0,087* PR
CF V
D
= − (8)
where: V is the average velocity of the winds (m/s);
R
P is the nominal power of the wind farm (kW); D is
the rotor diameter of wind turbines (m).
3.5 The deinition of the data sample The database that guided the present study was
made available on the Internet by the Environmental Data Organization System, Sistema de Organização
de Dados Ambientais (SONDA), which is a project of the National Institute of Space Research, Instituto Nacional de Pesquisas Espaciais (INPE)
aimed at implementing physical infrastructure and human resources in some Brazilian cities with the objective of improving the database on solar and wind energy resources in Brazil. The municipalities
João do Cariri (PB) and Ouro Preto d’Oeste (RO).
In order to compare the different regions of Brazil, we analyzed the winds of four different federative
units: Brasília (DF), Ourinhos (SP), São Martinho da Serra (RS) and Triunfo (PE).
In general, SONDA measuring stations collect data at 25 m and 50 m in height, but this work only made use of the information referring to 50 m for a period of 12 consecutive months. An interesting point is that these data, available at SONDA (2014),
underwent a validation process by the project’s own collaborators in order to guarantee their reliability.
Care was taken, therefore, to select only the bases whose data had been classiied as “approved”.
3.6 Calculation racional
In order to determine if a wind farm was viable in a city, the anemometric database of that municipality
was irst analyzed in order to estimate the average
annual velocity of the wind from that location.
Then, Formulas 7 and 8 were used to determine the
expected annual energy generation for that locality. This amount multiplied by the average sales price
of GWh of wind energy by the federal government
results in the expected revenue for the entrepreneur. The second part of the study focused on estimating wind energy costs in the country. For
this, the annual reports for 2012 and 2013 of CPFL Renováveis, Renova Energia and EDP Renováveis
were analyzed, as well as the documents issued by
the Energy Research Company, Empresa de Pesquisa
Energética (EPE) at the end of each wind energy auction of 2013.
Finally, it was assumed that, in case of inancing
need, the funds for the implementation of the project
would come from BNDES through the BNDES
Finem credit line, which is focused on wind farms. With these data the IRR method was used to evaluate the economic feasibility of the same wind project case located in each of the four cities analyzed. The results are presented in the following sections.
4 Introduction to the brazilian case
This section presents aspects of wind energy generation and the elements used in calculating the
economic-inancial viability of a wind farm in Brazil.
It should be noted that the investment analysis was carried out in order to consider the wind project in
two different ways. The irst considers the project
as small as possible, that is, without considering
the need for inancing, and therefore, debt services. On the other hand, it incorporates debt inancing
and services into the project, which results in lower
magnitude cash lows.
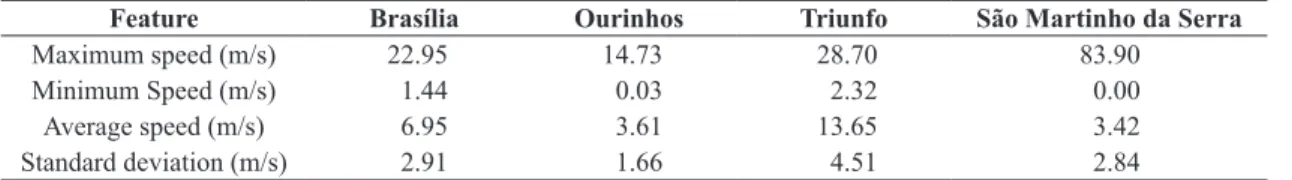
4.1 The energy potential
In order to estimate the energy potential of a given locality, the mean wind speed of the site in
question was calculated over a period of 12 months,
as discussed above. The summary of the analyzes can be found in the following Table 1.
In order to estimate the energy potential of each municipality. the average velocity of the winds should follow a Weibull probability distribution with form
factor k equal to 2. As shown in the Figure 4 below,
this condition is satisied for all locations except Triunfo (3). Because of this. it was not possible to use Formulas 7 and 8 for that particular location. To work around this situation. the work of Lima & Bezerra (2010) was used. which argues that the northeast city has a capacity factor of 0.62. which
means that a wind farm in the municipality would
Table 1. The characteristic of the winds to 50 m of height.
Feature Brasília Ourinhos Triunfo São Martinho da Serra
Maximum speed (m/s) 22.95 14.73 28.70 83.90
Minimum Speed (m/s) 1.44 0.03 2.32 0.00
Average speed (m/s) 6.95 3.61 13.65 3.42
Standard deviation (m/s) 2.91 1.66 4.51 2.84
Source: Prepared from data available in SONDA (2014).
generate energy for approximately 5,462 hours in
the year.
The summary of the energy potential of each city is expressed in the following Table 2. For the calculations.
the technical speciications of Renova Energia wind
farm in the interior of Bahia were considered. which
is composed of 184 General Electric (GE) wind turbines. model 1.6 XLE. whose nominal power is 1.6 MW. supported by towers of 80 meters of height and equipped with rotors with 82.5 meters of diameter.
4.2 The estimation of the price of sale Once the energy potential of the studied locations is estimated. it is necessary to know how much the entrepreneur will receive for each MWh of energy
sold. In Brazil. producers of renewable energy are remunerated based on contracts signed with the federal government during the auctions of energy contracting
promoted by state entities. The Ministry of Mines and Energy. Ministério de Minas e Energia (MME) classiies the auctions that contemplated wind projects in 2013 as follows:
a) Auction A-5 – aims to contract electricity from
new generation projects and is carried out ive
years in advance of the beginning of the supply;
b) Auction A-3 – aims to contract electricity
from new generation projects and is carried
out 3 years in advance of the beginning of the supply;
c) Reserve Energy Auction (LER) – aim to raise
the level of security in the supply of electricity
to the National Interconnected System. Sistema
Interligado Nacional (SIN).
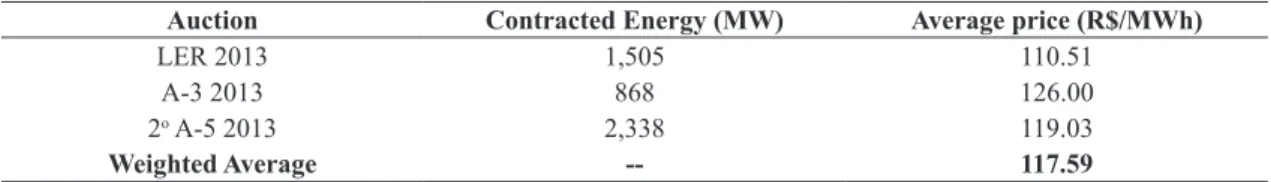
Thus. based on the average prices of the auctions
held in 2013. the average price per MWh was deined
as the weighted average of the amounts agreed at each auction. In this case. the weights were represented
by the amount of energy (MW) contracted in each
of them. Thus. it was established that the estimated sale price to be used in the economic viability calculations is R$ 117.59/MWh. as presented in the Table 3 below.
4.3 The costs of acquisition
Based on the documents issued by the Energy Research Company. Empresa de Pesquisa Energética (EPE) at the end of each auction. the average acquisition cost of wind projects in Brazil in 2013 was deined as shown in Table 4. The second auction
A-5 of 2013 was disregarded because it contemplated
other sources of energy other than wind power and. consequently. the cost of acquisition estimated in this auction represented the sum of all categories of energy generation traded in that trading session and is therefore incompatible with the objectives
of this work. which focuses only on wind energy. Conirming the evidence presented in Blanco (2009)
on the high acquisition and installation costs of wind
Table 2. The energy potential of each locality.
Feature Brasília Ourinhos Triunfo São Martinho da Serra
Average Speed (m/s) 6.95 3.61 13.65 3.42
Capacity Factor (CF) 0.56 0.27 0.62 0.25
Energy Potential (GWh/year) 1,448 695 1,599 656
Source: Own elaboration.
Table 3. Average price of wind energy contracted in each auction of 2013.
Auction Contracted Energy (MW) Average price (R$/MWh)
LER 2013 1,505 110.51
A-3 2013 868 126.00
2o A-5 2013 2,338 119.03
Weighted Average -- 117.59
Source: Adapted from ABBEólica (2014, p. 2).
Table 4. Estimated acquisition cost per MW
Auction Contracted Energy (MW) Planned Investment
LER 2013 1,505 R$ 5.5 billion
A-3 2013 868 R$ 3.3 billion
TOTAL 2,373 R$ 8.8 billion
Average -- R$ 3.7 million/MW
equipment. the average initial investment per MW
installed in Brazil was close to R$ 3.7 million/MW.
4.4 The costs of generation of wind energy Once the wind power potential of each locality. the revenue forecast and the acquisition / installation
costs of the wind infrastructure has been estimated. it is left to determine the costs of generating a wind farm. To this end. the annual reports released by three
large companies in the sector (CPFL Renováveis. Renova Energia and EDP Renováveis) were analyzed.
where they were searched for the following cost
categories:
a) operation and maintenance; b) taxes;
c) insurance; d) rent and lease;
e) other administrative costs.
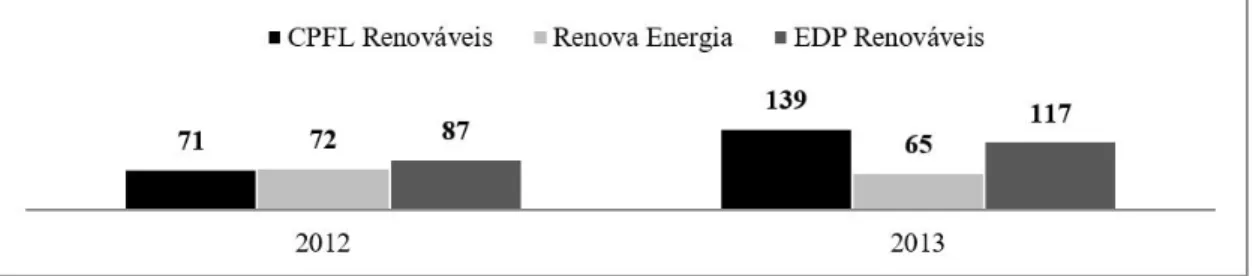
The following Figure 5 presents the conclusions of what was announced by the companies in the
years 2012 and 2013. Then. considering the total costs of energy generation (R$/MWh) as a function of the energy actually generated (GWh) by each
company in each year. it was concluded that the costs of generating wind energy revolve around
R$95.09/MWh.
4.5 The average weighted cost of capital As discussed in topic 3. a company’s cost of capital deines the minimum rate of return on capital
invested by a company.
Through the analysis of the annual reports of the three companies. information was obtained on the proportion of equity and third parties used by each company and its respective third parties.
Equity costs were obtained considering a 34% income tax rate. based on a Leveraged Beta (β�)
of 0.98 for EDP Renováveis. as observed on the website Reuters (2014). Then. an Unleveraged Beta
(β�) was estimated for the sector of approximately
0.56. as deined by Assaf (2002). Then. β� served as input for the calculation of β� of the other two companies. With this information it was possible to determine the respective capital costs of the
companies according to Equation 5. After this the weighted average cost of capital (WACC) of the
three companies.
Finally. considering the WACC for the energy produced (GWh) during the year 2013 by each company. it was determined for this work that the
average weighted cost of capital of a wind farm in Brazil is approximately 8.24%.
4.6 Financing conditions
The funds to inance this project would come from the BNDES. through the credit line that serves wind farms (BNDES Finem). According to its rules. interest rates charged vary between 6% and 10.18% pa. depending on the risk proile presented by the
applicant. In addition. the maximum holding of
the bank may not exceed 80% of the value of the inanceable items and the debt must be paid in up to 16 years. four years before the expiration of the
power supply contracts to the government. whose
validity is 20 years. Lastly. the bank’s grace period
is up to six months after the start of the commercial operation of the wind farm.
In summary, the assumptions for IRR calculations
were:
a) there will be no change in energy production
over the years;
b) nominal power of the park = 294 MW installed; c) cost of acquisition = R $ 3.7 million per installed
MW;
d) cost of energy generation = R $ 95.09 per MWh produced;
e) reduction of the cost of energy generation = 0.65% per year;
f) sale price = R $ 117.59 per MWh produced;
g) increase in the sale price = 9% per year; h) time for the park to start operating = 24 months; i) BNDES grace period (interest only) = 24 months; j) term of payment of the inancing = 16 years; k) inancing interest rate = 10.18% per year
(as conservative as possible);
l) amount inanced by BNDES = 80% of the total cost of acquisition;
m) project lifetime = 20 years after completion of works;
n) the effects of Income Tax and depreciation were disregarded.
5 Results of the application of
economic and inancial viability
analysis methods
Finally. the feasibility of this project was calculated if it was installed in each of the four cities. whose
anemometric data were analyzed in Section 4.1.
The assumptions for all projects were the same. with the wind potential of each locality being the only possible variable.
Therefore. Triunfo (PE) was the one that presented the best economic result. followed closely by Brasília (DF). The representatives of São Paulo and Rio
Grande do Sul were economically unviable. Table 5
below shows the IRR values for each location.
According to the results presented in Table 5.
if there is no need for bank inancing. all projects are
feasible even in pessimistic conditions as demonstrated
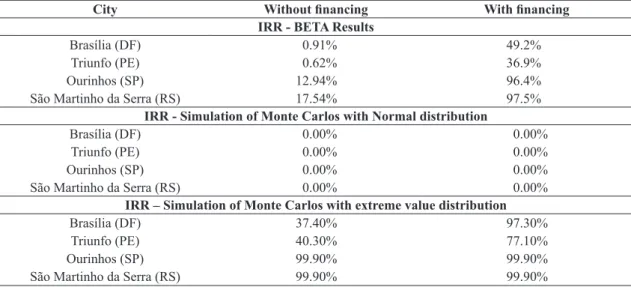
in MCS with Distribution of Extreme Values. In order to quantify the inherent risk of each
project. the area of the accumulated probability
density function of each case was calculated. taking
into account the distributions used in the analysis. in order to calculate the probability of occurrence
of a negative NPV.
In the case of the analysis performed using the Beta distribution. we calculated the probability based on a normal cumulative probability density function. considering that the sum of Beta distributions results in a normal distribution. These results are presented in Table 6.
The results presented in Table 5 are corroborated
according to the inherent risk of each project. as
presented in Table 6.
As for bank inancing. the results obtained are in perfect agreement with the work of Lima & Bezerra (2010). which also veriied the economic viability of the city of Triunfo. In addition. the Atlas of Brazilian Wind Potential 2001 (Brasil, 2001) clearly shows that the Northeast region is the one with the best average
winds during the year. also showing the volume of winds in the Federal District. mainly in the second half of the year. It is also easy to observe that the
regions of Ourinhos and São Martinho da Serra lack
Table 5. Results.
City Without inancing With inancing IRR - Deterministic Results
Brasília (DF) 28.9%* 13.3%*
Triunfo (PE) 30.3%* 14.6%*
Ourinhos (SP) 20.3%* 4.3%
São Martinho da Serra (RS) 19.0%* 3.2%
IRR - Beta Results
Brasília (DF) 28.9%* 13.2%*
Triunfo (PE) 30.2%* 14.5%*
Ourinhos (SP) 20.3%* 4.3%
São Martinho da Serra (RS) 19.0%* 3.2%
IRR - Simulation of Monte Carlos with Normal distribution
Brasília (DF) 29.0%* 13.4%*
Triunfo (PE) 28.9%* 13.3%*
Ourinhos (SP) 20.2%* 4.3%
São Martinho da Serra (RS) 18.9%* 3.2%
IRR - Monte Carlos simulation with extreme value distribution
Brasília (DF) 26.4%* 10.6%
Triunfo (PE) 27.7%* 12.0%
Ourinhos (SP) 18.3%* 1.8%
São Martinho da Serra (RS) 17.3%* 3.2%
strong winds during most of the year. a fact that
makes wind power projects in their municipalities
in the absence of own resources.
In view of the above. it can be stated that Brazil has interesting regions for investments in wind
energy generation (Brasil, 2001). Despite this. the initial disbursement (Blanco, 2009) and the lack of reliable and updated anemometric data (Martins & Pereira. 2011) continue to be some of the obstacles
to the full development of this sector in the country.
6 Conclusions
Brazil has regions with great wind potential. as
illustrated in the Atlas of Brazilian Wind Potential of 2001 (Brasil, 2001). which can be economically
viable. It is important to emphasize that this is
the last oficial government study on the subject.
signaling a strong outdated data sources in the sector.
In addition. the igures involved in these projects are
restrictive to small entrepreneurs. and can only be supported by large players in the sector. provided
that they are inanced at low cost. Therefore. the sustainable and long-term development of wind
energy in Brazil still depends on government support to be possible. as already pointed out by Dutra &
Tolmasquim (2000).
With respect to the investment analysis developed. all regions presented economic feasibility when
analyzing the cash lows without the need to make payments related to the inancing of the initial investment. On the other hand. in a borrowing scenario. only Brasília (DF) and Triunfo (PE)
managed to prove economically viable. indicating that the use of own resources is vital for projects
that aim to take advantage of the potential of the
wind for the generation of energy in the south and southeast regions.
These results reinforce the northeast’s vocation for wind power generation. even in pessimistic
scenarios such as those demonstrated in MCS with
extreme values distribution. Thus. it is expected that
such results may support the decision-making of
energy managers in Brazil. especially with regard to the location of projects and the policies for the provision of capital.
Another relevant point is the fact that only four
cities are chosen for this study. This was due to the
lack of data on the behavior of the country’s winds (Martins & Pereira, 2011). In order to minimize this
fact. cities were chosen from four different regions of Brazil. thus showing how different the results of an economic feasibility study can be in a country of continental dimensions. whose diversity of
climates and vegetation inluences the atmospheric circulation. factor Crucial for estimating the wind
potential of a given site.
Another limitation of the research was the fact
that Triunfo did not follow a Weibull distribution with factor k = 2. According to Brasil (2001), the
northeastern city has a k factor close to 3.5, that is.
a Normal probability distribution. This question would make it impossible to use Equations 7 and 8
to calculate the city’s wind potential. In order to
overcome this problem. the results of the work of Lima & Bezerra (2010) were used, which also
needed to calculate the necessary parameters for the estimation of energy generation during the year.
Finally, the present study approached wind energy in a comprehensive way. touching on points not very
discussed in the Brazilian scientiic literature. for
what was perceived in the bibliographic survey of
Table 6. Probability of NPV <0.
City Without inancing With inancing
IRR - BETA Results
Brasília (DF) 0.91% 49.2%
Triunfo (PE) 0.62% 36.9%
Ourinhos (SP) 12.94% 96.4%
São Martinho da Serra (RS) 17.54% 97.5%
IRR - Simulation of Monte Carlos with Normal distribution
Brasília (DF) 0.00% 0.00%
Triunfo (PE) 0.00% 0.00%
Ourinhos (SP) 0.00% 0.00%
São Martinho da Serra (RS) 0.00% 0.00%
IRR – Simulation of Monte Carlos with extreme value distribution
Brasília (DF) 37.40% 97.30%
Triunfo (PE) 40.30% 77.10%
Ourinhos (SP) 99.90% 99.90%
for the Alternative Energy Sources Incentive Program (PROINFA) under the New Brazilian electric power sector regulation. Renewable Energy, 33(1), 65-76. http://dx.doi.org/10.1016/j.renene.2007.01.013. Dutra, R. M., & Tolmasquim, M. T. (2000). Estudo de
viabilidade econômica para projetos eólicos com base no novo contexto do setor elétrico. Revista Brasileira de Energia, 9(1), 135-158.
Empresa de Pesquisa Energética – EPE. (2013a). Balanço energético nacional. Brasília: EPE. Recuperado em 1 de maio de 2014, de www.ben.epe.gov.br
Empresa de Pesquisa Energética – EPE. (2013b). Balanço energético nacional: relatório síntese. Brasília: EPE. Recuperado em 1 de maio de 2014, de www.ben.epe. gov.br
Empresa de Pesquisa Energética – EPE. (2013c). Informe à imprensa – Leilão de energia A-3/2013. Brasília: EPE. Recuperado em 2 de agosto de 2014, de www. ben.epe.gov.br
Empresa de Pesquisa Energética – EPE. (2013d). Informe à imprensa: Leilão de energia de reserva 2013. Brasília: EPE. Recuperado em 2 de agosto de 2014, de www. ben.epe.gov.br
Garcia-Heller, V., Espinasa, R., & Paredes, S. (2016). Forecast study of the supply curve of solar and wind technologies in Argentina, Brazil, Chile and Mexico. Renewable Energy, 93, 168-179. http://dx.doi.org/10.1016/j. renene.2016.02.065.
Global Wind Energy Council – GWEC. (2014). 2013 annual market update. Recuperado em 1 de maio de 2014, de www.gwec.net
Herbert, G. M. J., Iniyan, S., Sreevalsan, E., & Rajapandian, S. (2007). A review of wind energy technologies. Renewable & Sustainable Energy Reviews, 11(11), 1117-1145. http://dx.doi.org/10.1016/j.rser.2005.08.004. Intergovernmental Panel on Climate Change – IPCC. (2001). Third assessment report: climate change. Working Group I. Switzerland: IPCC. Recuperado em 1 de maio de 2014, de www.ipcc.ch
Jong, P., Kiperstok, A., Sánchez, A. S., Dargaville, R., & Torres, E. A. (2016). Integrating large scale wind power into the electricity grid in the Northeast of Brazil. Energy, 100, 401-415. http://dx.doi.org/10.1016/j. energy.2015.12.026.
Kim, J. Y., Oh, K.-Y., Kang, K.-S., & Lee, J.-S. (2013). Site selection of offshore wind farms around the Korean Peninsula through economic evaluation. Renewable Energy, 54, 189-195. http://dx.doi.org/10.1016/j. renene.2012.08.026.
Leung, D. Y. C., & Yang, Y. (2012). Wind energy development and its environmental impact: a review. Renewable & Sustainable Energy Reviews, 16(1), 1031-1039. http:// dx.doi.org/10.1016/j.rser.2011.09.024.
this research. It can be said that the classiication
and estimation of the main cost categories in energy generation represent the main contribution sought by this study.
Based on these conclusions. future works could
(i) apply statistical tests to the anemometric data of
Brasília (DF), Ourinhos (SP) and São Martinho da
Serra (RS) in order to verify if they actually follow a Weibull distribution with factor k = 2 or even test
if the winds of Triumph (PE) really do not follow such a distribution; (ii) carry out similar studies for
other renewable energy sources. such as solar and small hydroelectric plants.
References
Albadi, M. H., & El-Saadany, E. F. (2007). Wind power in Ontario: an economical valuation. In Proceedings of the Electrical Power Conference (pp. 496-501). Canada: IEEE.
Ang, B. W., Zhou, P., & Tay, L. P. (2011). Potential for reducing global carbon emissions from electricity production: a benchmarking analysis. Energy Policy, 39(5), 2482-2489. http://dx.doi.org/10.1016/j.enpol.2011.02.013. Assaf, A. (2002). Estrutura e análise de balanços: um
enfoque econômico-inanceiro (7. ed.). São Paulo: Atlas. 320 p.
Associação Brasileira de Energia Eólica – ABEEólica. (2014). Boletim mensal de dados do setor eólico. São Paulo: ABEEólica. Recuperado em 1 de abril de 2014, de www.portalabeeolica.org.br
Banco Nacional do Desenvolvimento – BNDES. (2009). Um panorama da indústria de bens de capital relacionados à energia eólica. Brasília: BNDES. Recuperado em 1 de maio de 2014, de www.bndes.gov.br
Blanco, M. I. (2009). The economics of wind energy. Renewable & Sustainable Energy Reviews, 13(6-7), 1372-1382. http://dx.doi.org/10.1016/j.rser.2008.09.004. Brasil. Ministério de Minas e Energia – MME. (2001). Atlas do potencial eólico brasileiro. Brasília: MME. Recuperado em 1 de junho de 2014, de www.cresesb. cepel.br
Casarotto, N., Fo., & Kopittke, B. H. (1998). Análise de investimentos: matemática inanceira, engenharia econômica e tomada de decisão (8. ed.). São Paulo: Atlas. 458 p.
Damodaran. (2014). Recuperado em 2 de agosto de 2014, de www.damodaran.com
Dincer, I. (2000). Renewable energy and sustainable development: a crucial review. Renewable & Sustainable Energy Reviews, 4(4), 157-175. http://dx.doi.org/10.1016/ S1364-0321(99)00011-8.
wind power in Brazil: the influence of location, area and shape. Renewable Energy, 85, 554-563. http://dx.doi. org/10.1016/j.renene.2015.06.071.
Ross, S. A., Westerfield, R. W., & Jaffe, J. (2003). Corporate inance (6. ed.). New York: McGraw-Hill. 961 p. Sahin, A. D. (2004). Progress and recent trends in wind
energy. Progress in Energy and Combustion Science, 30(5), 501-543. http://dx.doi.org/10.1016/j.pecs.2004.04.001. Salles, A. C. N. (2004). Metodologia de análise de risco para avaliação inanceira de projetos de geração eólica (Dissertação de mestrado). Instituto Alberto Luiz Coimbra de Pós-graduação e Pesquisa de Engenharia – COPPE, Universidade Federal do Rio de Janeiro, Rio de Janeiro. Segura, I., Pereznavarro, A., Sanchez, C., Ibanez, F.,
Paya, J., & Bernal, E. (2007). Technical requirements for economical viability of electricity generation in stabilized wind parks. International Journal of Hydrogen Energy, 32(16), 3811-3819. http://dx.doi.org/10.1016/j. ijhydene.2007.06.009.
Silva, A. R., Pimenta, F. M., Assireu, A. T., & Spyrides, M. H. C. (2016). Complementarity of Brazil׳s hydro and offshore wind power. Renewable & Sustainable Energy Reviews, 56, 413-427. http://dx.doi.org/10.1016/j. rser.2015.11.045.
Sims, R. E. H. (2004). Renewable energy: a response to climate change. Solar Energy, 76(1-3), 9-17. http:// dx.doi.org/10.1016/S0038-092X(03)00101-4. Sistema de Organização Nacional de Dados Ambientais
– SONDA. (2014). São José dos Campos: INPE. Recuperado em 1 de julho de 2014, de http://sonda. ccst.inpe.br
Vithayasrichareon, P., & MacGill, I. F. (2014). Incorporating short-term operational plant constraints into assessments of future electricity generation portfolios. Applied Energy, 128, 144-155. http://dx.doi.org/10.1016/j. apenergy.2014.04.052.
Watts, D., & Jara, D. (2011). Statistical analysis of wind energy in Chile. Renewable Energy, 36(5), 1603-1613. http://dx.doi.org/10.1016/j.renene.2010.10.005. Li, C.-B., Lu, G.-S., & Wu, S. (2013). The investment risk
analysis of wind power project in China. Renewable Energy, 50, 481-487. http://dx.doi.org/10.1016/j. renene.2012.07.007.
Lima, L. A., & Bezerra, C. R., Fo. (2010). Wind energy assessment and wind farm simulation in Triunfo, PE, Brazil. Renewable Energy, 35(12), 2705-2713. http:// dx.doi.org/10.1016/j.renene.2010.04.019.
Martins, F. R., & Pereira, E. B. (2011). Enhancing information for solar and wind energy technology deployment in Brazil. Energy Policy, 39(7), 4378-4390. http://dx.doi. org/10.1016/j.enpol.2011.04.058.
Masters, G. M. (2004). Renewable and eiciente power systems (1. ed.). New Jersey: Wiley-IEEE. 680 p.
Melo, M. S. M. (2012). Energia eólica: aspectos técnicos e econômicos (Dissertação de mestrado). Instituto Alberto Luiz Coimbra de Pós-graduação e Pesquisa de Engenharia – COPPE, Universidade Federal do Rio de Janeiro, Rio de Janeiro.
Miller, R. A. (2009). The weighted average cost of capital is not quite right. The Quarterly Review of Economics and Finance, 49(1), 128-138. http://dx.doi.org/10.1016/j. qref.2006.11.001.
Oh, K. Y., Kim, J.-Y., Lee, J.-S., & Ryu, K.-W. (2012). Wind resource assessment around Korean Peninsula for feasibility study on 100 MW class offshore wind farm. Renewable Energy, 42, 217-226. http://dx.doi. org/10.1016/j.renene.2011.08.012.
Perold, A. F. (2004). The capital asset pricing model. The Journal of Economic Perspectives, 18(3), 3-24. http:// dx.doi.org/10.1257/0895330042162340.
Pinto, R. C., & Parente, V. (2010). CAPM e regulação no segmento de distribuição do setor elétrico brasileiro. Revista Brasileira de Energia, 16(2), 23-33.
Reuters. (2014). Recuperado em 2 de agosto de 2014, de www.reuters.com