External Validation of a Brazilian Predictive Nomogram for
Pathologic Outcomes Following Radical Prostatectomy in
Tertiary Teaching Institutions: the USP Nomograms
_______________________________________________
Aguinel José Bastian Júnior, Marcos Francisco Dall’Oglio, Alexandre Crippa, Getúlio Rodrigues de
Oliveira Filho, Luís Felipe Piovesan, Ricardo Kupka da Silva, Katia R. M. Leite, Miguel Srougi
Urology Division, University of São Paulo Medical School, São Paulo, Brazil and Cancer Institute of São Paulo, São Paulo, Brazil
ABSTRACT
ARTICLE
INFO
______________________________________________________________ ______________________
Purposes: (a) To externally validate the Crippa and colleagues’ nomograms combining PSA, percentage of positive biopsy cores (PPBC) and biopsy Gleason score to predict organ-confined disease (OCD) in a contemporary sample of patients treated at a tertiary teaching institution. (b) To adjust such variables, resulting in predictive nomograms for OCD and seminal vesicle invasion (SVI): the USP nomograms.
Materials and Methods: The accuracy of Crippa and colleagues’ nomograms for OCD prediction was examined in 1002 men submitted to radical prostatectomy between 2005 and 2010 at the University of São Paulo (USP). ROC-derived area under the curve (AUC) and Brier scores were used to assess the discriminant properties of nomograms for OCD. Nomograms performance was explored graphically with LOESS smoothing plots. Furthermore, univariate analysis and logistic regression models targeted OCD and SVI. Variables consisted of PSA, PPBC, biopsy Gleason score and clinical stage. The resulted predictive nomograms for OCD and SVI were internally validated with bootstrapping and the same abovementioned procedures.
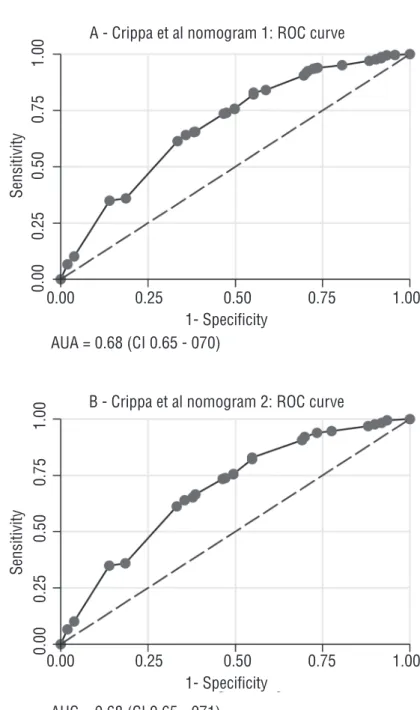
Results: Crippa and colleagues’ nomograms for OCD showed ROC AUC = 0.68 (CI: 0.65-0.70), Brier score = 0.17 and overestimation in LOESS plots. USP nomograms for OCD and SVI showed ROC AUC of 0.73 (CI: 0.70-0.76) and 0.77 (CI: 0.73-0.79), respectively, and Brier scores of 0.16 and 0.08, respectively. The LOESS plots showed excellent ca-libration for OCD and underestimation for SVI.
Conclusions: Crippa and colleagues’ nomograms showed moderate discrimination and considerable OCD overestimation. USP nomograms showed good discrimination for OCD and SVI, as well as excellent calibration for OCD and SVI underestimation.
Key words:
Prostate; Prostatic Neoplasms; Risk Factors; Nomograms; Models, Statistical
Int Braz J Urol. 2014; 40: 161-71
_____________________
Submitted for publication: May 10, 2013
_____________________
Accepted after revision: January 21, 2014
INTRODUCTION
Prostate cancer (PCa) is the second most pre-valent malignancy among Brazil’s male population. Its estimated incidence was 53.84 per 100,000 men in 2010 (1). The pathologic stage of PCa is critical for
ex-tension, seminal vesicle invasion (SVI) and lymph node status based on levels of PSA, clinical stage and Gleason score from prostate biopsy. The number of mathematical models used to predict the patho-logical stage has increased over the past 10 years. One systematic review identified 16 predictive and 22 prognostic models suitable for clinical use, most of them requiring external validation (4). According to Touijer and Scardino (5), there is a large degree of uncertainty when assessing the prognosis and pre-dicting the outcomes in PCa management.
In 2006, Crippa et al. (6) published the first population-based study in Brazil aimed to predict organ-confined disease (OCD). PSA levels, Gleason score from prostate biopsies and percentages of po-sitive biopsy cores (PPBC) were used as predictor variables. The model was constructed and internally validated on 898 private-practice patients submit-ted to radical retropubic prostatectomy (RRP) per-formed by one surgeon. The corresponding surgical specimens were examined by the same pathologist. The resulting nomograms correctly estimated OCD in 91.1% of patients. The main limitations of pre-dictive nomograms included lack of external vali-dation and of periodic updates to accommodate for changes occurring over time in populations, diseases and diagnostic methods [4]. Prediction tools become increasingly robust as they are successively valida-ted in distinct environments because the variability improves the accuracy (calibration and discrimina-tion) and the generalizability of the model (7). As a consequence, adjustment is strongly indicated when applying a prediction model to populations with dis-tinct characteristics or when temporal changes in di-sease or variable behavior are suspected (8).
The University Hospital of the University of São Paulo Medical School and the Cancer Institute of the State of São Paulo are public reference centers for PCa in Brazil. As tertiary centers, their population of patients is quite heterogeneous, as most patients have their biopsies performed at their original insti-tutions, while surgical procedures and pathological examinations are performed by supervised residents at distinct levels of training. We hypothesized that such heterogeneity could (a) significantly challenge the generalizability and transportability of a nomo-gram constructed on a more homogenous popula-tion and (b) require adjustments of the predictive
no-mogram to accommodate the characteristics of the population assisted at public tertiary centers.
The objectives of this study were (a) to per-form the external validation of Crippa and colle-agues’ nomograms and (b) to develop an adjusted nomogram for prediction of organ-confined disease and seminal vesicle invasion based on the popula-tion assisted at the abovemenpopula-tioned public tertiary institutions (USP nomograms).
MATERIALS AND METHODS
This study was approved by the Institutional Review Board. The patients’ informed consent was waived. Electronic medical records of 1,094 conse-cutive prostate cancer patients who underwent RRP by the Walsh technique (9) as modified by Srougi (10) between January 2005 and December 2010 were retrospectively reviewed. All surgeries were perfor-med by a urology resident assisted by an experien-ced urologist assistant. The following data were ex-tracted: (a) clinical staging based on the 2002 TNM classification (11). The T class was based on rectal examinations performed by urology residents and confirmed by a faculty urologist; (b) preoperative PSA levels, which were updated within the institu-tion if measured more than 90 days from the preope-rative consultation; (c) prostate biopsy findings, in-cluding total number of specimens obtained, number of positive fragments, and Gleason scores (12) strati-fied on primary and secondary components, and to-tal scores; (d) TNM pathologic staging (11) and Gle-ason histological classification based on electronic reports of standardized pathological examinations of surgical specimens consisting of prostate, seminal vesicles and, eventually, the removed lymph nodes. Organ-confined disease was defined as the absence of tumoral cells in periprostatic adipose tissue and/or in neurovascular bundles. Seminal vesicle invasion was characterized by the infiltration of tumoral cells not limited to the adventitia.
Statistical analysis
Accordingly, the available 1002 subject sample was considered suitable for the study.
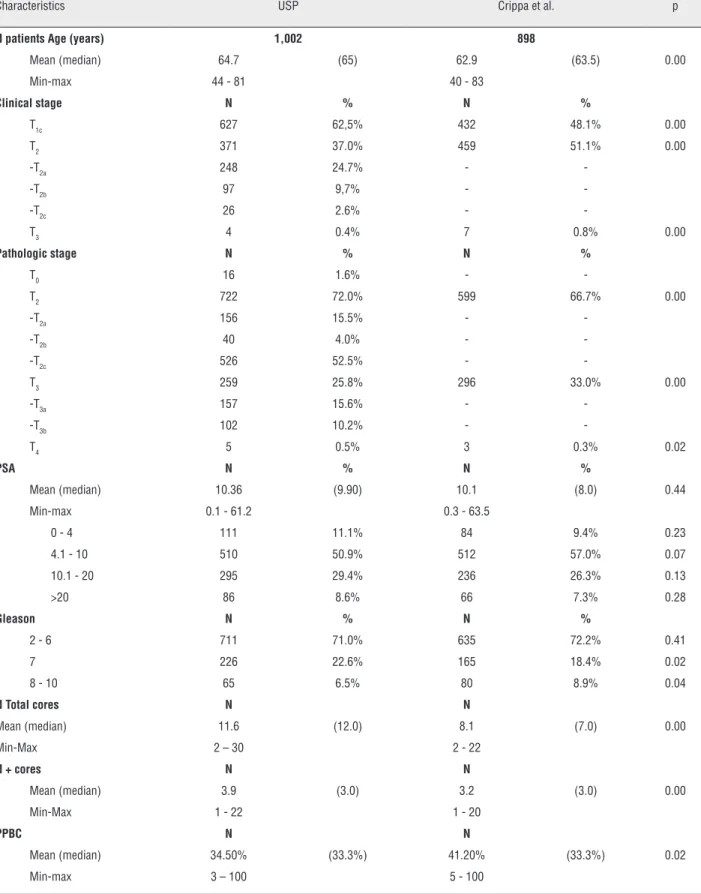
This study was based on the premise that the current sample would differ in significant as-pects from that of Crippa and colleagues’ original study (6). To test this hypothesis, demographic data, including the clinical stage, PSA values, and patho-logical findings presented in Table-1 of the original study were compared to data from the sample of the current study by two-sided unpaired t-tests and z--tests for proportions, as appropriate. The outcomes of interest were organ-confined disease and seminal vesicle invasion.
External validation of Crippa and colleagues’ no-mograms
Crippa and colleagues’ nomograms were de-signed to predict OCD. For external validation, the probability of OCD was estimated for each patient in the validating sample as the average probability pre-dicted by nomograms 1 and 2 of the original study (6), based on the respective ranges of PSA levels (0-4, 4.1-10, 10.1-20, and above 20ng.mL−1), of
Glea-son scores (2-6, 7 and 8-10 in nomogram 1, and 2-6 and 7-10 in nomogram 2) and PPBC (0-25%, 25.1-50%, 50.1-75% and 75.1-100%). Receiver operating characteristic (ROC) curves and the respective areas under the curves (AUC) accessed the discriminatory capability of the nomograms. Brier scores estimated the predictive performance of the nomograms ba-sed on mean squared deviations between predicted and observed outcomes and varied from 0 (perfect) to 0.25, which indicates that the model lacked any predictive capability. The extent of nomogram over- or underestimation was explored graphically within LOESS calibration plots (14). Coincidence of curves best fitted to scatterplots of predicted and observed outcomes with the diagonal lines on the plots in-dicates good model calibration along the ranges of prediction.
Construction of the USP nomograms
The USP nomograms aimed to predict both OCD and SVI based on ranges of PSA levels, of cli-nical stages, of Gleason scores and of PPBC.
For each predictor variable, cases were clas-sified as follows: (a) PSA levels were categorized as 0-4, 4.1-10, 10.1-20, or above 20ng.mL−1. To
incre-ase the number of cincre-ases in extreme categories, three categories were rebuilt by collapsing the 0-4 and the 4.1-10ng.mL−1 ranges. (b) Clinical stage was
classi-fied according to the T component of the TNM class. (c) Gleason scores were grouped in three categories: 2-6, 7 and 8-10. To increase the number of cases at the extremes, two categories were rebuilt: 2-6 and 7-10. (d) PPBC were initially grouped into four cate-gories: 0-25%, 25.1-50%, 50.1-75% and 75.1-100%. The categories 25.1-50% and 50.1-75% were collap-sed to increase the representativeness of cases at the extremes.
Chi-squared tests were used to assess the association between predictor variables and binary outcomes (OCD and SVI). Significantly associated variables were entered into stepwise logistic regres-sion analyses to identify independent predictors of the respective outcomes. Final coefficients and odds ratios and the respective 95% confidence intervals were obtained from 1000 bootstrap resampling pro-cedures (15). Hosmer and Lemeshow tests were used to assure the adequacy of the models. ROC curves were constructed. Areas under the curves, positive and negative predictive values of each model asses-sed discriminatory capabilities. Brier scores and LO-ESS plots were also constructed, as described above. Statistical analyses were performed on Stata v.10 (StataCorp LP, College Station). The significance level (alpha) was set at 0.05.
RESULTS
Of the total of 1,094 patients, seventy-seven incomplete records, thirteen records of patients who received neoadjuvant hormonal therapy and two records of patients diagnosed following endoscopic resection of the prostate were excluded, resulting in 1,002 patients.
External validation of nomograms from Crippa et al.
Table 1 – Demographic, clinical and pathological data.
Characteristics USP Crippa et al. p
N patients Age (years) 1,002 898
Mean (median) 64.7 (65) 62.9 (63.5) 0.00
Min-max 44 - 81 40 - 83
Clinical stage N % N %
T1c 627 62,5% 432 48.1% 0.00
T2 371 37.0% 459 51.1% 0.00
-T2a 248 24.7% -
--T2b 97 9,7% -
--T2c 26 2.6% -
-T3 4 0.4% 7 0.8% 0.00
Pathologic stage N % N %
T0 16 1.6% -
-T2 722 72.0% 599 66.7% 0.00
-T2a 156 15.5% -
--T2b 40 4.0% -
--T2c 526 52.5% -
-T3 259 25.8% 296 33.0% 0.00
-T3a 157 15.6% -
--T3b 102 10.2% -
-T4 5 0.5% 3 0.3% 0.02
PSA N % N %
Mean (median) 10.36 (9.90) 10.1 (8.0) 0.44
Min-max 0.1 - 61.2 0.3 - 63.5
0 - 4 111 11.1% 84 9.4% 0.23
4.1 - 10 510 50.9% 512 57.0% 0.07
10.1 - 20 295 29.4% 236 26.3% 0.13
>20 86 8.6% 66 7.3% 0.28
Gleason N % N %
2 - 6 711 71.0% 635 72.2% 0.41
7 226 22.6% 165 18.4% 0.02
8 - 10 65 6.5% 80 8.9% 0.04
N Total cores N N
Mean (median) 11.6 (12.0) 8.1 (7.0) 0.00
Min-Max 2 – 30 2 - 22
N + cores N N
Mean (median) 3.9 (3.0) 3.2 (3.0) 0.00
Min-Max 1 - 22 1 - 20
PPBC N N
Mean (median) 34.50% (33.3%) 41.20% (33.3%) 0.02
ROC curves of predictions based on Crippa and colleagues’ nomograms on the observed ou-tcomes of patients in the validation sample. AUC and the respective 95% confidence limits for the predictions based on nomograms 1 and 2 were 0.68 (0.65-0.70) and 0.68 (0.65-0.71). Both nomo-grams had Brier scores of 0.17 (Figure-1).
LOESS plots for predictions based on both nomograms. Considerable overestimation of OCD in all ranges of prediction is suggested (Figure-2).
USP nomograms
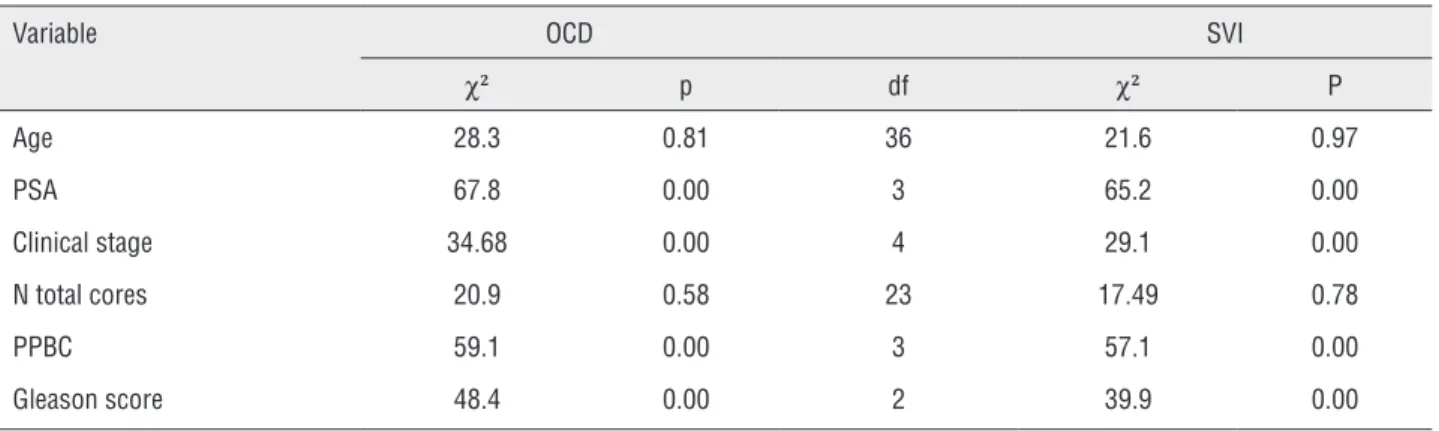
Table-2 shows the results of the chi-squared tests used in univariate analyses. No significant
as-Figure 1 - ROC curves of predictions based on Crippa and colleagues’ nomograms.
A - Crippa et al nomogram 1: ROC curve
B - Crippa et al nomogram 2: ROC curve AUA = 0.68 (CI 0.65 - 070)
AUC = 0.68 (CI 0.65 - 071) 1- Specificity
1- Specificity
0.00 0.25 0.50 0.75 1.00
0.00 0.25 0.50 0.75 1.00
0.00 0.25 0.50 0.75 1.00
0.00 0.25 0.50 0.75 1.00
Sensitivity
Table 2 - Univariate analysis for OCD and SVI prediction.
Variable OCD SVI
χ2 p df χ2 P
Age 28.3 0.81 36 21.6 0.97
PSA 67.8 0.00 3 65.2 0.00
Clinical stage 34.68 0.00 4 29.1 0.00
N total cores 20.9 0.58 23 17.49 0.78
PPBC 59.1 0.00 3 57.1 0.00
Gleason score 48.4 0.00 2 39.9 0.00
A - Crippa et al nomogram 1: LOESS plot
B - Crippa et al nomogram 2: LOESS plot OCD probabilty
OCD probabilty
.2 .4 .6 .8 1
.2 .4 .6 .8 1
0 .2 .4 .6 .8 1
0 .2 .4 .6 .8 1
Organ confined desease
Organ confined desease
sociations with either OCD or SVI were found for the total number of fragments in prostate biopsies or patient’s age. PSA levels, Gleason scores, PPBC and clinical stage categories were significantly as-sociated with both outcomes.
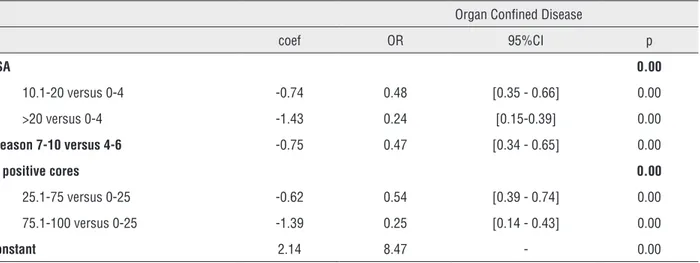
Table-3 summarizes the final logistic mo-dels, with bootstrap odds ratio 95% confidence li-mits. The final categories of PSA levels and Glea-son scores that best fitted the model resulted from the collapsed ranges. Clinical stage was rejected from the final logistic models (Figure-3).
The areas under the curves were 0.73 (0.70-0.76) and 0.77 (0.73-0.79) for OCD and SVI, respec-tively. Brier scores were 0.16 and 0.08, respecrespec-tively. The LOESS plots in Figure-4 depict the cali-bration of USP nomograms. Visual inspection reve-aled that the OCD curve was mostly coincident with the diagonal line, suggesting good calibration in all segments except for the 15% through 30% range, where underestimation occurred. LOESS plots for SVI predictions suggest underestimation of SVI in all ranges of prediction above 2%.
Table 3 - Multivariate analysis for prediction OCD and IVS.
Organ Confined Disease
coef OR 95%CI p
PSA 0.00
10.1-20 versus 0-4 -0.74 0.48 [0.35 - 0.66] 0.00
>20 versus 0-4 -1.43 0.24 [0.15-0.39] 0.00
Gleason 7-10 versus 4-6 -0.75 0.47 [0.34 - 0.65] 0.00
% positive cores 0.00
25.1-75 versus 0-25 -0.62 0.54 [0.39 - 0.74] 0.00
75.1-100 versus 0-25 -1.39 0.25 [0.14 - 0.43] 0.00
Constant 2.14 8.47 - 0.00
Positive predictive value: 77.03%; Negative predictive value: 59.49%; Hosmer and Lemeshow: χ2 =7.9; df = 6; p = 0.24
Organ Confined Disease
coef OR 95%CI p
PSA 0.00
10.1-20 versus 0-4 1.17 3.23 [2,00 - 5.24] 0.00
> 20 versus 0-4 1.74 5.67 [3.08 - 10.44] 0.00
Gleason 7-10 versus 4-6 0.86 2.37 [1.53 - 3.67] 0.00
% positive cores 0.00
25.1-75 versus 0-25 0.65 1.92 [1.16 - 3.20] 0.01
75.1-100 versus 0-25 1.64 5.15 [2.63 - 10.09] 0.00
Constant -3.70 0.025 - 0.03
DISCUSSION
This study has shown moderate discriminati-ve power and considerable OCD odiscriminati-verestimation bias of Crippa and colleagues’ nomograms. Conversely, USP nomogram exhibited good discriminative power and calibration for prediction of OCD. In contrast, USP nomogram for prediction of SVI considerably underestimated that outcome.
Superoptimistic behavior of predictive mo-dels in external validation processes is a common and widely acknowledged phenomenon (16). The wide and persistent use of Partin tables is based more on its clinical usefulness than on its statistical performance (17). Similarly, in spite of the modest predictive accuracy and informative performance of Crippa and colleagues’ nomograms, by incorpo-rating relevant independent predictors of OCD, they
A - USP nomogram: DOC - ROC curve
B - USP nomogram: SVI - ROC curve 1- Specificity
1- Specificity
0.00 0.25 0.50 0.75 1.00
0.00 0.25 0.50 0.75 1.00
Sensitivity
Sensitivity
0.00 0.25 0.50 0.75 1.00
0.00 0.25 0.50 0.75 1.00
AUC = 0.73 (CI 0.70 - 076)
AUC = 0.77 (CI 0.73 - 079)
may contribute valuable prognostic information. In doing so, and considering their limitations, they may be used as a better alternative to clinical staging. The moderate predictive performance of such nomogra-ms may have resulted from sample biases. Such a finding supports the original hypothesis of this study, according to which the heterogeneity of the tertiary teaching center population might disclose eventual weaknesses of nomograms developed in a more ho-mogeneous population. The next logical step in the study was to create new nomograms based on the same variables but originating from and validated in the population of our teaching institutions, including a prediction model for SVI.
The USP predictive models exhibited consis-tency, as confidence intervals of the original sam-ple coincided with those obtained by bootstrap, and adequate predictive performance, as assessed by the tests of Hosmer and Lemeshow. Areas under the ROC curves greater than 0.7 and overall percentage of cor-rect classification equal to 73% (OCD) and 77% (SVI) suggest a moderate to high discriminatory ability of both models. Similarly, calibration of the OCD predic-tive model was robust. In contrast, LOESS diagrams for the SVI predictive model showed underestimation of the outcome in all ranges of prediction over 2%.
It has been suggested that proper calibration of a nomogram is more clinically useful than is its Figure 4 - LOESS curves probability distribution for OCD and SVI.
A - USP nomogram: DOC - LOESS plot
B - USP nomogram: SVI - LOESS plot OCD probability
SVI probability
Organ confined desease
Seminal vesical invasion
.2 .4 .6 .8 1
0 .2 .4 .6 .8
0 .2 .4 .6 .8 1
0 .2 .4 .6 .8 1
discriminatory capability (7). Accordingly, USP nomograms for predicting OCD can be clinically useful. Conversely, given its poor calibration, the SVI nomogram demands extensive external vali-dations and variable adjustments to improve its accuracy. Partin tables have demonstrated good discriminating capability (AUC = 0.74) (18). A re-cent validation in the Surveillance, Epidemiology and End Results (SEER) dataset showed appropriate discrimination of the Partin tables, but the study did not report on their calibrations (18). In contrast, a European validation study failed to confirm their accuracy (17). Reasons for these conflicting results may include the fact that at the time of its cons-truction, in 1993, only 39% of patients had a non--palpable tumor at diagnosis (19). An increasing prevalence of T1c tumors at diagnosis has occurred over recent decades (20). In Crippa and colleagues’ study, clinical stage T1c was present in 48.1% of patients diagnosed between 1988 and 2002, while in our sample, 62.7% of patients were T1c. These findings justify repeated adjustment and revalida-tion procedures to accommodate disease and popu-lation changes over time.
The superiority of PPBC associated with PSA levels and Gleason scores over the clinical stage in predicting extra-prostatic disease has been demonstrated (6,21). This study confirmed these findings.
The use of only a few variables is desirable in nomograms to increase utility in busy practi-ces (16). Clinically useful nomograms should be applicable to individual patients and provide this information as percentages of outcome likelihood (22). The nomograms in this study fulfilled the abovementioned requirements.
Seminal vesicle preservation during RRP may improve erectile function and urinary conti-nence (23). Seminal vesicle involvement demands a wider radiation field during radiotherapy (24) and is associated with higher rates of biochemical recurrence and worse prognosis (25). Such practi-cal issues stress the importance of accurate predic-tion of organ-confined disease.
The growing number of low-risk PCa pa-tients managed by active surveillance continues to generate controversy about the concepts of in-dolent disease, the criteria for treatment and the
impact on patient survival compared to treated patients (26). Nomograms for predicting indolent disease (27) are in use, but require extensive exter-nal validation.
This study included 419 (41.1%) low-risk patients who were treated surgically. Of these, 86.4% had OCD. The USP nomogram predicted 86.1% of OCD in low-risk cases. Active surveillan-ce requires periodic measurements of PSA and re-peated prostate biopsies (28). The availability of such data allows sequential recalculations of OCD likelihood in USP nomograms.
The retrospective nature of this study and the impossibility of reviewing prostate biopsies deri-ved from several centers may have biased our data. Furthermore, clinical staging did not include imaging examinations. Inter-examiner bias may have caused eventual misclassifications of clinical stage and of pa-thological examinations of surgical specimens (29).
The abovementioned bias-inducing factors are inherent to retrospectively collected data from referral teaching centers and were acknowledged du-ring planning. This study shares these features with other major validation studies.
Predictive values of further models may in-crease by the inclusion of additional variables as an-giolymphatic or perineural invasion and novel cellu-lar, molecucellu-lar, and genetic biomarkers (30).
CONCLUSIONS
USP nomograms showed good discrimina-tion for OCD and SVI, as well as excellent calibradiscrimina-tion for OCD and SVI underestimation.
CONFLICT OF INTEREST
None declared.
REFERENCES
1. Brasil. Ministério da Saúde. Instituto Nacional do Câncer. Estimativa 2010: incidência de câncer no Brasil; 2010. [cited April 2011]. Available from: http://www2.inca.gov.br/wps/wcm/ connect/agencianoticias/site/home/noticias/2009/lancamento_ estimativa_2010
3. Partin AW, Yoo J, Carter HB, Pearson JD, Chan DW, Epstein JI, et al.: The use of prostate specific antigen, clinical stage and Gleason score to predict pathological stage in men with localizedprostate cancer. J Urol. 1993; 150: 110-4.
4. Lughezzani G, Briganti A, Karakiewicz PI, Kattan MW, Montorsi F, Shariat SF, et al.: Predictive and prognostic models in radical prostatectomy candidates: a critical analysis of the literature. Eur Urol. 2010; 58: 687-700.
5. Touijer K, Scardino PT: Nomograms for staging, prognosis, and predicting treatment outcomes. Cancer. 2009; 115: 3107-11. 6. Crippa A, Srougi M, Dall’Oglio MF, Antunes AA, Leite KR,
Nesrallah LJ, et al.: A new nomogram to predict pathologic outcome following radical prostatectomy. Int Braz J Urol. 2006; 32: 155-64.
7. Justice AC, Covinsky KE, Berlin JA: Assessing the generalizability of prognostic information. Ann Intern Med. 1999; 130: 515-24. 8. Karakiewicz PI, Bhojani N, Capitanio U, Reuther AM, Suardi N,
Jeldres C, et al.: External validation of the updated Partin tables in a cohort of North American men. J Urol. 2008; 180: 898-902; discussion 902-3.
9. Walsh PC, Lepor H, Eggleston JC: Radical prostatectomy with preservation of sexual function: anatomical and pathological considerations. Prostate. 1983; 4: 473-85.
10. Srougi M, Nesrallah LJ, Kauffmann JR, Nesrallah A, Leite KR: Urinary continence and pathological outcome after bladder neck preservation during radical retropubic prostatectomy: arandomized prospective trial. J Urol. 2001; 165: 815-8. 11. Edge SB, Compton CC: The American Joint Committee on
Cancer: the 7th edition of the AJCC cancer staging manual and the future of TNM. Ann Surg Oncol. 2010; 17: 1471-4.
12. Gleason DF, Mellinger GT; Veterans Administration Cooperative Urological Research Group: Prediction of prognosis for prostatic adenocarcinoma by combined histological grading and clinical staging. 1974. J Urol. 2002; 167: 953-8.
13. Peduzzi P, Concato J, Kemper E, Holford TR, Feinstein AR: A simulation study of the number of events per variable in logistic regression analysis. J Clin Epidemiol. 1996; 49: 1373-9. 14. Harrell FE: Binary logistic regression. In: ___ Regression
modeling strategies: with applications to linear models, logistic regression, and survival analysis. New York: Springer Verlag. 2001; pp. 215-68.
15. Efron B, Tibshirani RJ: An Introduction to the bootstrap: monographs on statistics and applied probability. Boca Raton, Fla.: Chapmann and Hall; 1998; v. 57.
16. Altman DG, Royston P: What do we mean by validating a prognostic model? Stat Med. 2000; 19: 453-73.
17. Bhojani N, Ahyai S, Graefen M, Capitanio U, Suardi N, Shariat SF, et al.: Partin Tables cannot accurately predict the pathological stage at radical prostatectomy. Eur J Surg Oncol. 2009; 35: 123-8. 18. Yu JB, Makarov DV, Sharma R, Peschel RE, Partin AW, Gross
CP: Validation of the partin nomogram for prostate cancer in a national sample. J Urol. 2010; 183: 105-11.
19. Smith DS, Catalona WJ: The nature of prostate cancer detected through prostate specific antigen based screening. J Urol. 1994; 152: 1732-6.
20. Boevee SJ, Venderbos LD, Tammela TL, Nelen V, Ciatto S, Kwiatkowski M, et al.: Change of tumour characteristics and treatment over time in both arms of the European Randomized study of Screening for Prostate Cancer. Eur J Cancer. 2010; 46: 3082-9.
21. Sebo TJ, Bock BJ, Cheville JC, Lohse C, Wollan P, Zincke H: The percent of cores positive for cancer in prostate needle biopsy specimens is strongly predictive of tumor stage andvolume at radical prostatectomy. J Urol. 2000; 163: 174-8.
22. Steyerberg EW, Vickers AJ, Cook NR, Gerds T, Gonen M, Obuchowski N, et al.: Assessing the performance of prediction models: a framework for traditional and novel measures. Epidemiology. 2010; 21: 128-38.
23. Albers P, Schäfers S, Löhmer H, de Geeter P: Seminal vesicle-sparing perineal radical prostatectomy improves early functional results in patients with low-risk prostatecancer. BJU Int. 2007; 100: 1050-4.
24. Jacob R, Hanlon AL, Horwitz EM, Movsas B, Uzzo RG, Pollack A; Role of prostate dose escalation in patients with greater than 15% risk of pelvic lymph node involvement. Int J Radiat Oncol Biol Phys. 2005; 61: 695-701.
25. Chun FK, Graefen M, Zacharias M, Haese A, Steuber T, Schlomm T, et al.: Anatomic radical retropubic prostatectomy-long-term recurrence-free survival rates for localized prostate cancer. World J Urol. 2006; 24: 273-80.
26. Klotz L: Active surveillance for favorable-risk prostate cancer: who, how and why? Nat Clin Pract Oncol. 2007; 4: 692-8. 27. Steyerberg EW, Roobol MJ, Kattan MW, van der Kwast TH, de
Koning HJ, Schröder FH: Prediction of indolent prostate cancer: validation and updating of a prognostic nomogram. J Urol. 2007; 177: 107-12; discussion 112.
28. Raaijmakers R, Kirkels WJ, Roobol MJ, Wildhagen MF, Schrder FH: Complication rates and risk factors of 5802 transrectal ultrasound-guided sextant biopsies of the prostate within apopulation-based screening program. Urology. 2002; 60: 826-30.
29. Simsir A, Kismali E, Mammadov R, Gunaydin G, Cal C: Is it possible to predict sepsis, the most serious complication in prostate biopsy? Urol Int. 2010; 84: 395-9.
30. Lowrance WT, Scardino PT: Predictive models for newly diagnosed prostate cancer patients. Rev Urol. 2009; 11: 117-26.
_______________________ Correspondence address:
Marcos F. Dall’Oglio, MD Rua Barata Ribeiro, 398, 5º. Andar.