Abstract
Objective: To assess the inluence of low birth weight in full-term infants on body composition at school age.
Method: This is a cross-sectional study nested in a cohort of 375 infants recruited at birth between 1993 and 1994 in the state of Pernambuco, Brazil. At 8 years of age, the body composition of 213 children from this cohort was assessed by measurement of triceps and subscapular skinfold thickness and mid upper arm circumference. Multivariable linear regression analysis was used to identify the inluence of low birth weight, socioeconomic condition, maternal nutritional status, and child morbidity on triceps skinfold thickness.
Results: Mean triceps and subscapular skinfold thickness, mid upper arm circumference, and upper arm muscle and fat areas were lower in children born at term with low weight than in those with appropriate birth weight. However, these differences were not statistically signiicant. Multivariable linear regression analysis showed that the relative majority of variance in triceps skinfold thickness (12.3%) was explained by socioeconomic variables, particularly per capita family income (9.1%), followed by anemia and past hospitalization (which, together, explained 5.6% of variance) and maternal body mass index, which contributed toward 2.4% of this variance. Low birth weight had no inluence on triceps subcutaneous fat deposition in this age group.
Conclusion: Socioeconomic factors and a history of morbidity had a greater inluence on body composition than low birth weight in schoolchildren born at term.
J Pediatr (Rio J). 2011;87(1):29-35: Low birth weight, fetal growth retardation, skinfold thickness, body composition, nutritional status, cohort studies.
O
RiginAlA
RtiCle Jornal de PediatriaCopyright © 2011 by Sociedade Brasileira de Pediatria
29 introduction
Fetal growth restriction is the foremost cause of low birth weight (LBW) in developing countries, and is a characteristic relection of the pervasive social and economic inequalities of these regions.1 Studies have shown that fetal malnutrition is a predisposing factor for increased morbidity in the irst year of life and higher hospitalization rates in economically underprivileged regions, particularly due to respiratory
infections and diarrheal diseases, and consequent increases in child mortality.2,3
A relationship exists between infectious diseases and nutritional issues. Nutritional status compromise leads to a decline in resistance to infection, and infections, in turn, jeopardize nutritional status by producing negative effects on appetite and food acceptance, thus maintaining the
Does fetal growth restriction inluence
body composition at school age?
Marilia C. lima,1 Henrique F. Dantas,2 Rosemary J. M. Amorim,3 Pedro i. C. lira4
1. Doutora, Medicina. Professora adjunta, Departamento Materno Infantil, Universidade Federal de Pernambuco (UFPE), Recife, PE, Brazil. 2. Mestre, Saúde da Criança e do Adolescente. Professor assistente, Departamento Materno Infantil, UFPE, Recife, PE, Brazil.
3. Doutora, Nutrição. Professora adjunta, Departamento Materno Infantil, UFPE, Recife, PE, Brazil. 4. Doutor, Medicina. Professor associado, Departamento de Nutrição, UFPE, Recife, PE, Brazil.
No conflicts of interest declared concerning the publication of this article. Financial support: The Wellcome Trust, UK (Grant No 064220Z/01Z).
Suggested citation: Lima MC, Dantas HF, Amorim RJ, Lira PI. Does fetal growth restriction influence body composition at school age? J Pediatr (Rio J).
2011;87(1):29-35.
Manuscript submitted Jul 23 2010, accepted for publication Oct 12 2010.
vicious circle of infectious disease and nutritional deicits. Micronutrient deiciencies, including iron deiciency, are frequently associated with decline in nutritional status and can induce poor host response to infection.4,5
If health conditions in childhood are affected by the synergistic action of a biological risk (fetal growth restriction) and infectious diseases and poor nutritional status, in adulthood, a history of fetal malnutrition has been associated with various chronic conditions, such as obesity, type 2 diabetes, hypertension, dyslipidemia, and ischemic stroke.6,7
Meas et al.8 found that adults who had been born full-term small for gestational age (SGA) gained a greater percentage of fat mass than those born appropriate for gestational age. These data suggest that the consequences of intrauterine growth restriction on body composition persist beyond the period of accelerated growth in early postnatal life.
There is a dearth of published studies assessing body composition at school age by means of body fat and lean mass percentages. In Northeast Brazil, a birth cohort has been followed since 1993, providing the opportunity to conduct the present study in this age range, in an attempt to determine the inluence of LBW on body composition at 8 years of age in children born full-term, with low or appropriate birth weight (ABW), after adjusting for socioeconomic factors, maternal nutritional status, and past medical history.
Methods
The study was carried out in ive municipalities of the southern Zona da Mata region of the state of Pernambuco (Água Preta, Catende, Joaquim Nabuco, Palmares, and Ribeirão), each located approximately 120 km from the state capital, Recife. This geographic area is traditionally characterized by sugarcane monoculture, which constitutes the livelihood of the majority of the economically active population in the region, thus contributing to underemployment or unemployment during the off-season.
This cross-sectional study was nested in a cohort of full-term infants (163 LBW, 212 ABW) that sought to follow growth and development over the irst two years of life. Neonates were recruited in the irst hours of life from six local maternity hospitals, between January 1993 and August 1994. The LBW group comprised infants weighing 1,500 to 2,499 g at delivery. The control group was constructed by pairing each LBW infant with the next baby of the same gender with an appropriate birth weight (3,000-3,499 g).3
Gestational age was assessed by a pediatrician using the method described by Capurro et al.,9 and a series of anthropometric parameters were measured in the irst 24 hours of life.3 Nutritional status at birth was assessed on
the basis of birth weight and body proportionality, deined by a combination of the ponderal index (PI) and length-for-age. PI was calculated with the Rohrer formula [PI = mass (g) / length (cm)3 x 100]. LBW infants were classiied as stunted when length-for-age was < -2 z scores and the PI was ≥ 2.5; wasted when length-for-age was ≥ -2 z scores and the PI was < 2.5; and both stunted and wasted when length-for-age was < -2 z scores and the PI was < 2.5.10 As this latter group comprised only 17 children, it was pooled with the stunted group (n = 13) for analysis. Five children could not be classiied into any of the three categories and were thus excluded from the sample.
Data collection at 8 years of age was carried out by a trained researcher between May 2001 and August 2002. At this time, a new interview was conducted, using a structured questionnaire to inquire as to family socioeconomic status and health of the child (morbidity and hospitalizations) over the previous year.
After the interview, body composition was assessed. Mid upper arm circumference was measured in triplicate with a non-stretch Lasso-o® circumference tape (Child Growth Foundation, London, UK). Skinfold thickness was also measured in triplicate with a Holtain skinfold caliper. In case measurements did not agree within 1 mm, the extreme value was ignored and measurements were repeated. The arithmetic mean of the three measurements was used for data analysis. Maternal height and weight was also measured, and maternal BMI was calculated from the data obtained [BMI = mass (kg)/height (m)2].10
Upper arm volume measurements were calculated on the basis of triceps skinfold (TSF) thickness and mid upper arm circumference (C), according to the formulae described by Frisancho11: total upper arm area = C2 / (4 x
π
); upper arm muscle area = [C – (TSF xπ
)2] / (4 xπ
)]; upper arm fat area = total upper arm area – upper arm muscle area; and arm fat index = (upper arm fat area / total arm area) x 100.Hemoglobin levels were measured with a portable photometer (HemoCue Ltd., Shefield, UK), using capillary blood samples obtained by the ingerstick method. Children were considered anemic when hemoglobin levels were lower than 11.5 g/dL.12
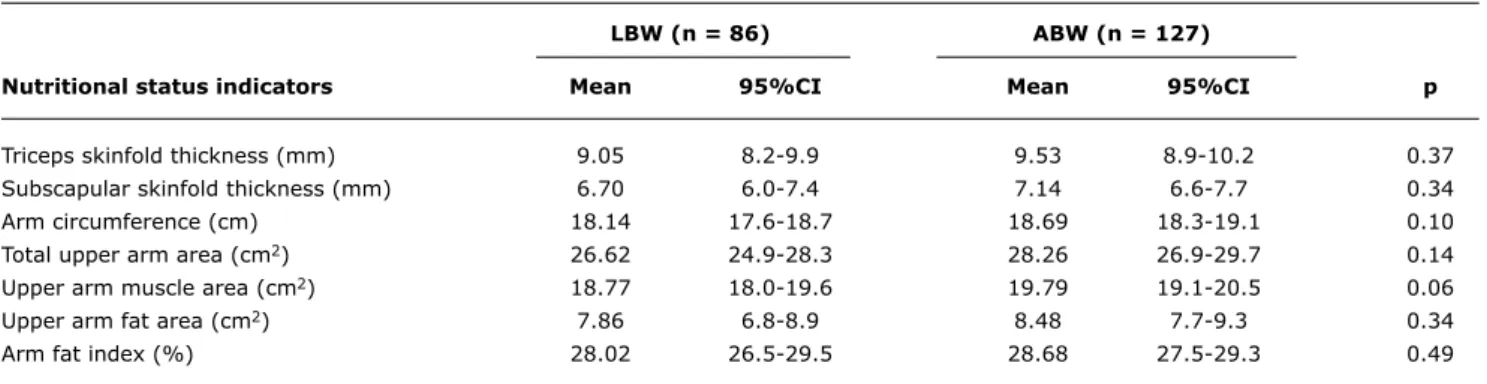
lBW (n = 86) ABW (n = 127)
nutritional status indicators Mean 95%Ci Mean 95%Ci p
Triceps skinfold thickness (mm) 9.05 8.2-9.9 9.53 8.9-10.2 0.37
Subscapular skinfold thickness (mm) 6.70 6.0-7.4 7.14 6.6-7.7 0.34
Arm circumference (cm) 18.14 17.6-18.7 18.69 18.3-19.1 0.10
Total upper arm area (cm2) 26.62 24.9-28.3 28.26 26.9-29.7 0.14
Upper arm muscle area (cm2) 18.77 18.0-19.6 19.79 19.1-20.5 0.06
Upper arm fat area (cm2) 7.86 6.8-8.9 8.48 7.7-9.3 0.34
Arm fat index (%) 28.02 26.5-29.5 28.68 27.5-29.3 0.49
table 1 - Anthropometry at 8 years of age, according to birth weight was used to compare differences in proportion in bivariate analysis. The signiicance level was set at ≤ 0.05.
Multivariate linear regression analysis was performed to assess the individual impact of independent variables on TSF thickness, using a hierarchical model in which variables were entered in blocks. Of the explanatory variables, hemoglobin level was treated as a continuous variable and all others as dichotomous variables, except for body proportionality at birth, which was treated as a dummy. All variables with p < 0.20 on bivariate analysis were selected for inclusion in the regression analysis model. The initial model thus included 10 socioeconomic variables (per capita family income, maternal educational attainment, family size, persons per room, paternal cohabitation, looring material, availability of lush toilets, waste disposal, ownership of refrigerator and cassette player); the second block included two maternal variables (age and BMI); the third, body proportionality at birth; and the fourth, hospitalization during the year preceding the study and hemoglobin levels at 8 years of age. Variables with p < 0.20 in each block were kept for inal analysis.
The study was approved by the Centro de Ciências da Saúde da Universidade Federal de Pernambuco Research Ethics Committee and by the London School of Hygiene and Tropical Medicine Ethics Committee. Informed consent was provided by the guardians of all children included in the study sample.
Results
A total of 213 children were available for enrollment at 8 years of age: 86 (40.4%) LBW and 127 (59.6%) ABW – 56.8% of the original cohort. Of those lost to follow-up, 15.4% had died (17 children in the LBW group and eight in the ABW group); 26% had migrated; and 58.6% could not be located. Comparison of socioeconomic status at birth of children who completed the study and those lost to follow-up according to birth weight showed that, regardless
of birth weight, the highest percentage of loss to follow-up occurred among children living in the worst socioeconomic conditions.14
Table 1 shows that anthropometric indicators of nutritional status (triceps and subscapular skinfold thickness, arm circumference, total upper arm area and upper arm muscle and fat area, and arm fat index) had lower mean values in full-term LBW infants, with no signiicant between-group differences, however.
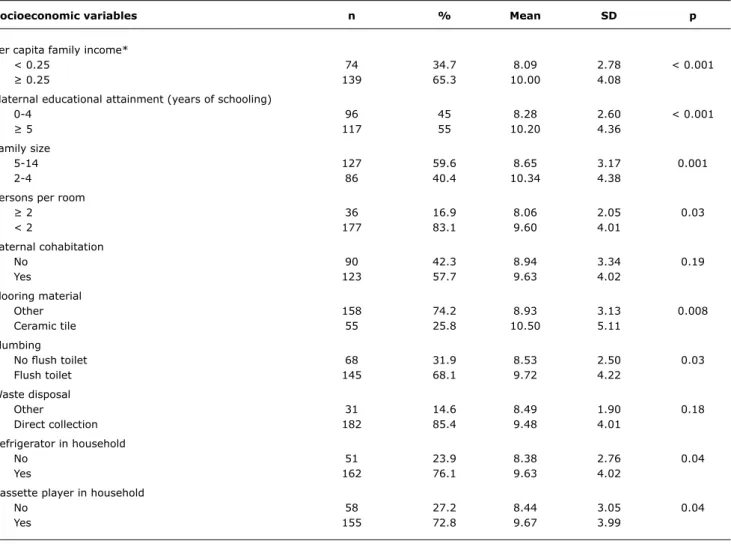
Table 2 shows signiicant reductions in TSF in children whose families had lower income, lower levels of maternal education, greater numbers of people residing in the household, and poor sanitation and low ownership of domestic appliances.
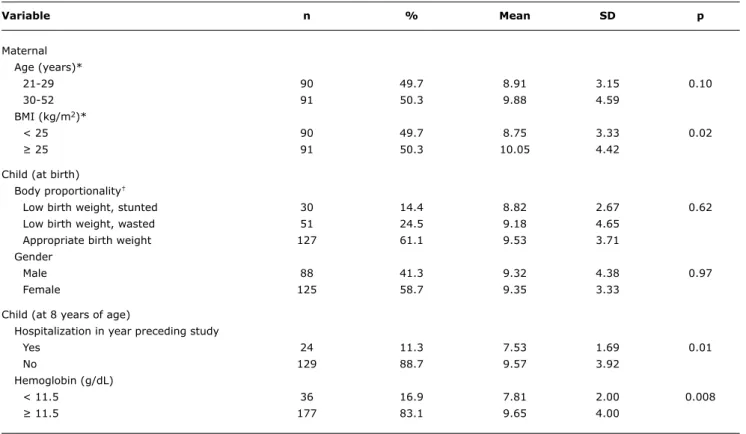
Table 3 shows that mean TSF thickness values were lower in children born to mothers younger than 30 years and with a BMI below 25 kg/m2 differences were only statistically signiicant for BMI, however. Analysis of body proportionality at birth showed that LBW infants had lower mean TSF thickness values than ABW infants, although the difference did not reach statistical signiicance. There were no gender-related between-group differences in mean TSF thickness. At 8 years of age, mean TSF thickness values were lower in children who had been hospitalized in the year preceding the study and in those with hemoglobin levels below 11.5 g/dL.
Regression analysis with TSF thickness as a dependent variable yielded the results shown in Table 4. In model 1, only per capita family income and maternal educational attainment remained signiicant after adjustment for the remaining socioeconomic variables. Model 2 shows that maternal BMI remained signiicant after adjusting for socioeconomic variables and maternal age. Body proportionality at birth, despite a p-value > 0.20, was kept in model 3 as a variable of interest for the study and a variable required for model adjustment. A similar result was obtained when birth weight was used instead of body proportionality in this model. In model 4, the hemoglobin
Socioeconomic variables n % Mean SD p
Per capita family income*
< 0.25 74 34.7 8.09 2.78 < 0.001
≥ 0.25 139 65.3 10.00 4.08
Maternal educational attainment (years of schooling)
0-4 96 45 8.28 2.60 < 0.001
≥ 5 117 55 10.20 4.36
Family size
5-14 127 59.6 8.65 3.17 0.001
2-4 86 40.4 10.34 4.38
Persons per room
≥ 2 36 16.9 8.06 2.05 0.03
< 2 177 83.1 9.60 4.01
Paternal cohabitation
No 90 42.3 8.94 3.34 0.19
Yes 123 57.7 9.63 4.02
Flooring material
Other 158 74.2 8.93 3.13 0.008
Ceramic tile 55 25.8 10.50 5.11
Plumbing
No lush toilet 68 31.9 8.53 2.50 0.03
Flush toilet 145 68.1 9.72 4.22
Waste disposal
Other 31 14.6 8.49 1.90 0.18
Direct collection 182 85.4 9.48 4.01
Refrigerator in household
No 51 23.9 8.38 2.76 0.04
Yes 162 76.1 9.63 4.02
Cassette player in household
No 58 27.2 8.44 3.05 0.04
Yes 155 72.8 9.67 3.99
table 2 - Mean triceps skinfold thickness at 8 years of age, according to socioeconomic variables
SD = standard deviation. * In minimum wages.
level and history of hospitalization variables maintained signiicance after adjustment for the remaining variables. Overall, independent variables accounted for 21.6% of variation in TSF thickness; the socioeconomic variables block explained much of this variation (12.3%), with particular emphasis on per capita family income (9.1%), followed by child morbidity-related variables (5.6%).
Discussion
This study has several positive points in its favor. It is a cohort study that has at its disposal a database on the socioeconomic and environmental conditions of participating families, maternal reproductive history, gestational age, and weight and length at birth, and has taken a strict methodological stance to follow-up of the participating children. The main limitation of this study concerns the substantial loss to follow-up 8 years after enrollment. This is
a common issue in cohort studies, particularly those carried out in developing countries. This study was conducted in a poor region of the state of Pernambuco, in Northeast Brazil, an area that features high unemployment rates and intense migration of local populations to the South and Southeast of the country in search of better living conditions. This is a major limitation; however, any possible selection bias will have had the effect of underestimating the negative effects of individuals in more disadvantaged socioeconomic conditions.14
Variable n % Mean SD p
Maternal Age (years)*
21-29 90 49.7 8.91 3.15 0.10
30-52 91 50.3 9.88 4.59
BMI (kg/m2)*
< 25 90 49.7 8.75 3.33 0.02
≥ 25 91 50.3 10.05 4.42
Child (at birth) Body proportionality†
Low birth weight, stunted 30 14.4 8.82 2.67 0.62
Low birth weight, wasted 51 24.5 9.18 4.65
Appropriate birth weight 127 61.1 9.53 3.71
Gender
Male 88 41.3 9.32 4.38 0.97
Female 125 58.7 9.35 3.33
Child (at 8 years of age)
Hospitalization in year preceding study
Yes 24 11.3 7.53 1.69 0.01
No 129 88.7 9.57 3.92
Hemoglobin (g/dL)
< 11.5 36 16.9 7.81 2.00 0.008
≥ 11.5 177 83.1 9.65 4.00
table 3 - Mean triceps skinfold thickness at 8 years of age according to maternal and child variables
BMI = body mass index; SD = standard deviation. * Missing data for 32 cases.
† Unclassifiable in 5 cases.
95%CI = 95% confidence interval; ß = unstandardized regression coefficient; BMI = body mass index; LBW = low birth weight; MWs = minimum wages; R2 = coefficient
of determination; TSF = triceps skinfold.
* Model 1: adjusted for family size, persons per room, paternal cohabitation, flooring material, availability of flush toilets, waste disposal, and refrigerator and cassette player ownership.
† Reference categories for categorical variables: per capita family income >0.25 MWs; maternal education >5 years of schooling; maternal BMI >25 kg/m2; maternal
age > 29 years; LBW, stunted: wasted LBW and appropriate birth weight; LBW, wasted: stunted LBW and appropriate birth weight; hemoglobin levels >11.5 g/dL; no history of hospitalization.
‡ p <0.001. § p <0.01. || p <0.05.
table 4 - Linear regression of factors associated with TSF thickness in children at 8 years of age
Variable Unadjusted β 95%CI Adjusted β 95%CI R2(%)
Model 1*
Per capita family income† < 0.25 MWs -1.92‡ -2.96:-0.87 -2.02§ -3.26:-0.78 9.1 (9.1) Maternal education† 0-4 years of schooling -1.91‡ -2.91:-0.92 -1.52|| -2.71:-0.32 3.2 (12.3)
Model 2
Maternal BMI† < 25 kg/m2 -1.30|| -2.45:-0.15 -1.11|| -2.23:-0.01 2.4 (14.7)
Maternal age† 21-29 years -0.97 -2.13:0.19 -0.80 -1.94:0.33 1.0 (15.7)
Model 3
LBW, stunted† -0.61 -2.10:0.88 0.03 -1.73:1.79 0.0 (15.7)
LBW, wasted† -0.21 -1.43:1.01 0.51 -0.87:1.90 0.3 (16.0)
Model 4
Hemoglobin† < 11.5 g/dL -1.84§ -3.18:-0.49 -1.70|| -3.16:-0.25 2.5 (18.5)
TSF thickness varies according to gender and age; it increases progressively, particularly in females.18,19 One hypothesis that may arise from this study is that school age may not be the most appropriate time to prove an association between LBW and body fat deposition. Several physiological differences in body composition are found in adolescence, and in girls in particular20,21; however, the presence of a risk factor – fetal growth restriction – could have future health implications in terms of higher risk of metabolic syndrome and cardiovascular disease.6
Another interesting inding was the decreased upper arm muscle area in children born LBW, although the difference did not reach statistical signiicance. In a study of LBW infants, Sarni et al.22 found that these children were affected both by stunting and by lean mass loss, whereas Loos et al.23,24 found LBW to be associated with body composition in adulthood, with high body fat percentages and reduced lean mass. These authors suggest that fetal growth restriction in the third trimester, a period in which considerable weight gain normally occurs, could be a determining factor of changes in metabolism and muscle structure, which could, in turn, be associated with decreased lean mass percentages.
According to Kuh et al.,25 lean mass loss secondary to fetal growth restriction has been associated with reduced muscle strength in adulthood. According to the authors, this damaging effect on muscle strength during intrauterine life is due to a reduction in the number of muscle ibers, which would be irreversible outside the womb and would actually be compounded by the inevitable lean mass loss of advancing age, with dire consequences on quality of life and independence in adulthood.25 In the present study, lower lean mass percentages suggest that these children have trouble replenishing their protein stores, as muscle tissue mass is a relection of body protein reserves. One might speculate that this inding provides further evidence of the repercussions of the perverse socioeconomic conditions to which these children are subjected.
One limitation of using body composition assessment indicators is the fact that these parameters are based on indirect measurements, obtained by mathematical means, and have low accuracy, as they regard the upper arm as a perfectly cylindrical structure with uniform fat distribution and thus underestimate adiposity. Furthermore, their use on a population-wide level is rather unfeasible.13
Motta et al.26 found that LBW infants are at increased odds of nutritional risk in the irst year of life. This birth weight disadvantage was also reported by Eickmann et al.,27 at 2 years of age, in the present cohort. In this same population, Amorim et al.14 reported that, at 8 years of age, LBW had no inluence on weight-for-age and height-for-age, whereas maternal height and BMI and socioeconomic conditions played a major role in variation in these nutritional status indicators.
Analysis of the factors associated with TSF thickening showed that socioeconomic variables contributed most to TSF variation, which suggests a strong association between these variables and body composition at 8 years of age. The negative inluence of maternal BMI < 25 kg/m2 on TSF thickness could be considered both a proxy indicator of adverse socioeconomic and environmental conditions and a result of genetic inheritance, as mothers and their offspring share these same factors.28
Children with a history of fetal growth restriction are prone to infectious diseases in the irst few months of life due to immune and nutritional deicits.2,3 However, at 8 years of age, unfavorable socioeconomic conditions are still present in the family environment, which may play a substantial role in worsening the nutritional status of this children during school age and, consequently, increasing morbidity. In this context of poverty, ignorance, low purchasing power, unhealthy and unsafe environmental conditions, and little access to health services, morbidity in this age range – represented in this study by anemia and hospitalization – also has a substantial negative effect on nutritional status.
In a study conducted in Africa, Delpeuch et al.29 found that the socioeconomic determinants of health can have a negative inluence on child nutrition and that, as found in the present study, the combination of socioeconomic conditions and maternal characteristics is strongly associated with the nutritional status of the child. In a similar setting, Ulukanligil & Seyrek30 found high prevalence rates of anemia, intestinal parasite infestation, and nutritional deicits in a sample of Turkish schoolchildren living in poor sanitation conditions – an environment comparable to that in which children in the southern Zona da Mata region of Pernambuco live.
In conclusion, our inding that socioeconomic factors and morbidity had a greater inluence than LBW on TSF thickness in school-age children born full term may help health care providers and public health administrators gain a better understanding of the social reality of this region, providing them with a tool to guide short-, medium-, and long-term actions geared to reducing morbidity in these children and their families.
References
1. Kramer MS. The epidemiology of adverse pregnancy outcomes: an overview. J Nutr. 2003;133:1592S-6S.
2. Barros FC, Huttly SR, Victora CG, Kirkwood BR, Vaughan JP. Comparision of the causes and consequences of prematurity and intrauterine growth retardation: a longitudinal study in southern Brazil. Pediatrics. 1992;90:238-44.
3. Lira PI, Ashworth A, Morris SS. Low birth weight and morbidity from diarrhea and respiratory infection in northeast Brazil. J
4. Branca F, Ferrari M. Impact of micronutrient deiciencies on growth: the stunting syndrome.Ann Nutr Metab. 2002;46 Suppl 1:8-17.
5. Rivera AJ, Hotz C, González-Cossío T, Neufeld L, García-Guerra A. The effect of micronutrient deiciencies on child growth: a review of results from community-based supplementation trials. J Nutr. 2003;133:4010S-20S.
6. Barker DJ. The developmental origins of adult disease. J Am Coll Nutr. 2004;23:588S-95S.
7. Gluckman PD, Hanson MA, Pinal C. The developmental origins of adult disease. Matern Child Nutr. 2005:1:130-41.
8. Meas T, Deghmoun S, Armoogum P, Alberti C, Levy-Marchal C. Consequences of being born small for gestational age on body composition: an 8-year follow-up study. J Clin Endocrinol Metab. 2008;93:3804-9.
9. Capurro H, Konichezky S, Fonseca D, Caldeyro-Barcia R. A simpliied method for diagnosis of gestacional age in the newborn infant. J
Pediatr. 1978;93:120-2.
10. World Health Organization (WHO). Physical Status: the use and interpretation of anthropometry. WHO Technical Report Series 854. Geneva; 1995.
11. Frisancho AR. Anthropometric standards for the assessment of growth and nutritional status. Ann Arbor: The University of Michigan Press; 1990.
12. World Health Organization (WHO). The Clinical use of Blood in Medicine, Obstetrics, Paediatrics, Surgery & Anaesthesia, Trauma & Burns. Geneva; 2001.
13. Gibson RS. Principles of Nutritional Assessment. 2nd ed. New York: Oxford University Press; 2005.
14. Amorim RJ, Lima MC, Lira PI, Emond AM. Does low birthweight inluence the nutritional status of children at school age? a cohort study in northeast Brazil. Matern Child Nutr. Publicado on line: Feb 5 2010.
15. Malina RM, Katzmarzyk PT, Beunen G. Birth weight and its relationship to size attained and relative fat distribution at 7 to 12 years of age. Obes Res. 1996;4:385-90.
16. Hediger ML, Overpeck MD, Kuczmarski RJ, McGlynn A, Maurer KR, Davis WW. Muscularity and fatness of infants and young children born small- or large-for-gestational age. Pediatrics. 1998;102E60.
17. Hack M, Schluchter M, Cartar L, Rahman M, Cuttler L, Borawski E. Growth of very low birth weight infants to age 20 years.Pediatrics. 2003;112:e30-8.
18. dos Anjos LA. Índices antropométricos e estado nutricional de escolares de baixa renda de um município do Estado do Rio de Janeiro (Brasil): um estudo piloto. Rev Saude Publica. 1989;23:221-9.
19. Monyeki KD, Kemper HC, Makgae PJ. Development and tracking of central patterns of subcutaneous fat of rural South African youth: Ellisras longitudinal study. BMC Pediatrics. 2009;9:74.
Correspondence:
Rosemary de Jesus Machado Amorim Rua Xavier Marques, 209/1101 – Graças CEP 52050-230 – Recife, PE – Brazil Tel.: +55 (81) 2126.8514
Fax: +55 (81) 2126.8514 E-mail: [email protected]
20. Barker M, Robinson S, Osmond C, Barker DJ. Birth weight and body fat distribution in adolescent girls. Arch Dis Child. 1997;77:381-3.
21. Santos EB, Amâncio OM, Oliva CA. Estado nutricional, ferro, cobre e zinco em escolares de favelas da cidade de São Paulo. Rev Assoc
Med Bras. 2007;53:323-8.
22. Sarni RO, Souza FI, Pitta TS, Fernandez AP, Hix S, Fonseca FA. Baixo peso ao nascer: inluência na pressão arterial, composição corporal e antropometria. Arq Med ABC. 2005;30:76-82. 23. Loos RJ, Beunen G, Fagard R, Derom C, Vlietinck R. Birth weight
and body composition in young adult men-a prospective twin study. Int J Obes Relat Metab Disord. 2001;25:1537-45. 24. Loos RJ, Beunen G, Fagard R, Derom C, Vlietinck R. Birth weight
and body composition in young women: a prospective twin study. Am J Clin Nutr. 2002;75:676-82.
25. Kuh D, Bassey J, Hardy R, Aihie Sayer A, Wadsworth M, Cooper C. Birth weight, childhood size, and muscle strength in adult life: evidence from a birth cohort study. Am J Epidemiol. 2002;156:627-33.
26. Motta ME, Silva GA, Araújo OC, Lira PI, Lima MC. O peso ao nascer inluencia o estado nutricional ao inal do primeiro ano de vida? J Pediatr (Rio J). 2005;81:377-82.
27. Eickmann SH, Lima MC, Motta ME, Romani AS, Lira PI. Crescimento de nascidos a termo com peso baixo e adequado nos dois primeiros anos de vida. Rev Saude Publica. 2006;40:1073-81.
28. Engstrom EM, Anjos LA. Déicit estatural nas crianças brasileiras: relação com condições sócio-ambientais e estado nutricional materno. Cad Saude Publica. 1999;15:559-67.
29. Delpeuch F, Traissac P, Martin-Prével Y, Massamba JP, Maire B. Economic crisis and malnutrition: socioeconomic determinants of anthropometric status of preschool children and their mothers in an African urban area. Public Health Nutr. 2000;3:39-47. 30. Ulukanligil M, Seyrek A. Anthropometric status, anaemia and