ABSTRACT: The large volume of sewage sludge (SS) generated with high carbon (C) and nutrient content suggests that its agricultural use may represent an important alternative to soil carbon sequestration and provides a potential substitute for synthetic fertilizers. However, emissions of CH4 and N2O could neutralize benefits with increases in soil C or saving fertilizer production be-cause these gases have a Global Warming Potential (GWP) 25 and 298 times greater than CO2, respectively. Thus, this study aimed to determine C and N content as well as greenhouse gases (GHG) fluxes from soils historically amended with SS. Sewage sludge was applied between 2001 and 2007, and maize (Zea mays L.) was sowed in every year between 2001 and 2009. We evalu-ated three treatments: Control (mineral fertilizer), 1SS (recommended rate) and 2SS (double rate). Carbon stocks (0-40 cm) were 58.8, 72.5 and 83.1 Mg ha–1 in the Control, 1SS and 2SS, respectively, whereas N stocks after two years without SS treatment were 4.8, 5.8, and 6.8 Mg ha–1,respectively. Soil CO
2 flux was highly responsive to soil temperature in SS treatments, and soil water content greatly impacted gas flux in the Control. Soil N2O flux increased under the residual effects of SS, but in 1SS, the flux was similar to that found in moist tropical forests. Soil remained as a CH4 sink. Large stores of carbon following historical SS application indicate that its use could be used as a method for carbon sequestration, even under tropical conditions. Keywords: biosolid, nitrogen, carbon dioxide, methane, nitrous oxide
Introduction
The use of organic wastes for agricultural fertil-ization is a growing practice worldwide following the guidelines of the modern concepts of waste management, where they should be viewed as byproducts (Wilson, 2007). Especially in developing countries, sewage sludge (SS) agricultural use is being increasingly adopted as a way of managing urban wastewater treatment chains and preventing the scarcity of water and landfill sites (Beech-er, 2008; Wang, 2011). From the perspective of agricul-tural sustainability, SS use promotes the recycling of nu-trients previously removed from the soil by crops (Elser, 2012), while reducing the use of synthetic fertilizers and their detrimental environmental effects (Childers et al., 2011). Also, SS may help prevent soil erosion (Galdos et al., 2009; Garcia-Orenes et al., 2005), increase enzymatic activity in soils (Singh and Agrawal, 2008) and decrease the incidence and viability of phytopathogenic organisms detrimental to crops (Bonanomi et al., 2010).
Despite the benefits, the use of SS in agriculture could also be associated with serious environmental, agricultural, and health risks if not properly planned, managed and im-plemented. Among the most frequently discussed issues are the high concentrations of organic pollutants and heavy met-als in SS and their potential accumulation in soils (Nogueira et al., 2010; Smith, 2009). Contamination of soils, water, and crops with human pathogens has also been an important study subject (Gerba and Smith, 2005; Navarro et al., 2009). However, while climate change is an increasing global con-cern, the impact of SS use in agriculture on GHG emissions such as CO2, CH4 and N2O has hardly been addressed.
Similar to the application of other organic fertil-izers in soils, the use of SS in agriculture is prone to alter soil C and N dynamics and, consequently, change the rates of GHG emissions. For instance, part of the organic C present in SS might be stored more permanently in the soil and help mitigate the effects of agriculture on greenhouse emissions (Lal, 2008). On the other hand, much of the organic C and N in SS applied to soils can be used by the microbial community to fuel processes such as nitrification and denitrification, which will
in-crease emissions of N2O (Davidson et al., 2000; Stein,
2011; Ward, 2008). Moreover, the application of SS, rich in organic matter and with high water holding capacity, may create anaerobic sites in soils and promote microbi-al methanogenic activity (Le Mer and Roger, 2001; Sey et al., 2008). In contrast, well-drained soils are recognized as CH4 sinks (Conrad, 2009; Holmes et al., 1999).
We hypothesized that the application of SS to sup-ply N for maize cropping increases N and C content in soil, as well as the emissions of greenhouse gases such as CH4, N2O, and CO2. This study aimed to: (i) quantify changes in soil carbon and nitrogen stocks after succes-sive applications of SS; (i) determine if greenhouse gas fluxes from soil increase with increases in soil organic C and N availability; and (iii) verify how soil physical-chemical parameters influence these fluxes.
Materials and Methods
Site description
The experiment was conducted in Campinas, in the state of São Paulo, located in the southeast region
1Agronomic Institute/Center for Research and Development in Soil and Environmental Resources, Av. Barão de Itapura, 1481 – 13012-970 – Campinas, SP – Brazil.
2Federal University of São Carlos – Dept. Environmental Sciences – Rod. João Leme dos Santos km 110 – 18052-780 – Sorocaba, SP – Brazil.
3Embrapa Environment, Rod. SP 340 km 127.5 – 13820-000 – Jaguariúna, SP – Brazil.
Corresponding author <lmpitombo@ufscar.br>
Edited by: Paulo Cesar Sentelhas
Carbon sequestration and greenhouse gases emissions in soil under sewage sludge
Leonardo Machado Pitombo1,2*,Janaina Braga do Carmo2, Isabela Clerici de Maria1, Cristiano Alberto de Andrade3
residual effects
of Brazil (22º09’ S, 47º01’ W). The soil at the site was classified as Haplic Ferralsol according to the Food and Agriculture Organization system (FAO, 1998), with clay texture (58.3 % clay, 10.3 % silt, and 31.4 % sand). The climate is humid-tropical with rainy summers and dry winters, and is considered to be a Cwa type, according to the Köppen classification system (Alvares et al., 2013). The mean annual temperature and rainfall are 20.5 °C and 1,400 mm, respectively, and 76 % of the precipita-tion occurs between Oct and Mar (Galdos et al., 2009).
Experimental design
The area of the experimental site was divided into twelve 4 × 25 m plots of uniform declivity (10 %) and separated by cemented borders and frames (2 m). The plots included three treatments (four replicates)
on maize crops (Zea mays L.), including a control and
two treatments with SS application (1SS and 2SS). In the Control, no SS was ever applied to the maize crops but synthetic fertilized N was added at the rate
equiv-alent to 120 kg N ha–1; the 1SS plots were amended
with the recommended amount of SS (1SS ≈ 10 Mg ha–1 yr–1 of SS on dry bases); while the 2SS plots were amended with twice the recommended amount (2SS ≈ 20 Mg ha–1 yr–1 of SS on dry bases). The average
con-tents of C and N in SS were 279 and 30 kg Mg–1,
re-spectively (Table 1).
Sewage sludge was applied in 1SS and 2SS for seven years (2001 to 2007), while the Control had no SS application but was fertilized with mineral N. An-nual phosphorus (P) and potassium (K) fertilizers were also applied to the Control, and 1SS and 2SS received
supplementary fertilization with K only. Therefore, the GHG emissions and C and N stocks presented in this study represent the effects of residual SS fertilizer appli-cation on soils. Thus, it was expected that labile material would be readily degraded and organic matter would be in a more stabilized form as verified by Fernandez et al. (2007).
Sewage sludge application - The recommended sew-age sludge rate was determined according to its chemical composition (Table 1) and the N fertilization rate rec-ommended for maize crops (Raij et al., 1997). Based on treatment adopted for wastewater treatment plant, the N mineralization rate used is equal to 30 % in accordance with Brazilian legislation (CONAMA, 2006), which adopts the same N mineralization rates established by USEPA (USEPA, 1994). The SS used in the experiments was generated at the Jundiaí city water reclamation plant (23º08’ S, 47º00’ W), in the state of São Paulo, Brazil, where the water treatment process consists of a complete-mix aerated lagoon followed by decantation. At the plant, SS was centrifuged and subjected to poly-electrolyte, physical and sanitary conditioning over 60 to 90 days by revolving in an enclosure patio (Galdos et al., 2004). Sewage sludge was manually applied to the entire treatment area and then incorporated into the soil (0-10 cm) using mattock, while synthetic fertilizer was applied in rows. Maize was planted annually during the summer. During the intercrop period, the soil remained uncovered.
Gas and soil sampling and analysis
On Sep 18, 2009, composite soil samples from
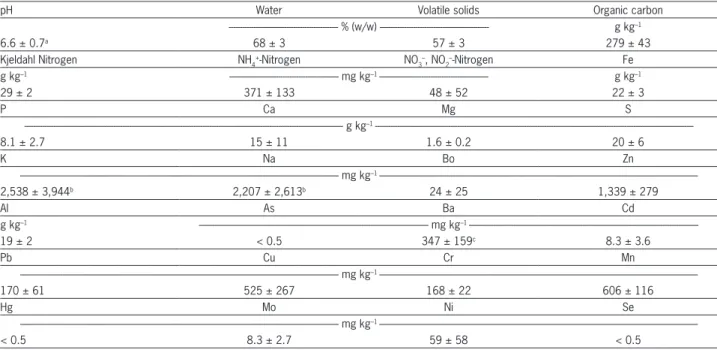
Table 1 – Physicochemical parameters of sewage sludges (SS) applied between the years 2001 and 2007.
pH Water Volatile solids Organic carbon
--- % (w/w) --- g kg–1
6.6 ± 0.7a 68 ± 3 57 ± 3 279 ± 43
Kjeldahl Nitrogen NH4+-Nitrogen NO
3 –, NO
2
–-Nitrogen Fe
g kg–1 --- mg kg–1 --- g kg–1
29 ± 2 371 ± 133 48 ± 52 22 ± 3
P Ca Mg S
--- g kg–1
---8.1 ± 2.7 15 ± 11 1.6 ± 0.2 20 ± 6
K Na Bo Zn
--- mg kg–1
---2,538 ± 3,944b 2,207 ± 2,613b 24 ± 25 1,339 ± 279
Al As Ba Cd
g kg–1 --- mg kg–1
---19 ± 2 < 0.5 347 ± 159c 8.3 ± 3.6
Pb Cu Cr Mn
--- mg kg–1
---170 ± 61 525 ± 267 168 ± 22 606 ± 116
Hg Mo Ni Se
--- mg kg–1
---< 0.5 8.3 ± 2.7 59 ± 58 < 0.5
each plot and the same soil depth were obtained from five randomly collected subsamples. These samples were taken at depths of 0-5 cm, 5-10 cm, 10-20 cm and 20-40 cm using hand augers. Soil samples were air-dried, grounded and sieved at 150 µm for total C and N analy-sis using a CN analyzer. For bulk density determinations, undisturbed soil samples were collected using steel cyl-inders (5 × 5 cm) in triplicate from each plot at different depths in the trenches. C and N stocks were calculated using the following equation:
Stock=C*Ws*h*10,000 (1)
where: Stock is C or N soil stock (Mg ha–1); C is the ele-ment concentration (g g–1); Ws is the soil bulk density (Mg m–3); h is the soil depth (m); and 10,000 is the coef-ficient for converting m2 into hectare.
We determined soil N2O and CH4 fluxes using
a chamber-based method (Davidson et al., 2002) in which polyvinyl chloride chambers (30-cm diameter) were inserted 2-cm deep into the soil at randomly dis-tributed points. After closing the chambers, 60 mL samples were collected using syringes at 1, 10, 20 and 30 min and stored under pressure in 20 mL evacuated penicillin flasks sealed with gas-impermeable butyl-rubber septa (Bellco Glass 2048). The samples were analyzed by gas chromatography with electron
cap-ture and flame ionization detectors for N2O and CH4,
respectively (Shimadzu 2014). Each gas chamber flux was calculated from slope regressions between gas con-centration and collection time. Measurements of atmo-spheric pressure, chamber height and air temperature were taken during gas sampling to determine the air chamber volume.
Soil CO2 fluxes were determined using a
dynam-ic chamber as proposed by Davidson et al. (2002) and adapted by Carmo et al. (2006). For these measurements, we used the same polyvinyl chloride chambers (30 cm in diameter) used for N2O and CH4 sampling. The cham-ber was coupled to a portable infrared gas analyzer that
determined changes in CO2 concentration (ppmv) over
time. Gas concentrations were measured in situ ev-ery 15 s for 5 min, and the data were stored using the Graph-Term Datastick software installed on a palmtop connected to the equipment. Subsequently, data were transferred to another computer where the flux for each chamber was calculated using Palm Flux software, which employs a regression slope to obtain the flux mea-surement in µmol CO2 m–2 s–1.
Soil temperature was measured at a depth of 0-10 cm using probe thermometers to assist in the interpreta-tion of results. All chambers were installed in the be-tween-row position. Thus, in the Control plots the fluxes do not represent direct emissions from fertilizer because it was applied parallel to the planting line. Gas samples were collected over 20 days between Oct 14, 2009 and Sep 29, 2010. Precipitation and daily mean temperatures are shown in Figure 1.
Gas emissions were estimated by weighting the data with seasonal fluxes (dry or wet period) to isolate conditions that support denitrification (water availabili-ty) and CO2 soil flux (temperature and water availability), because at the study site, lower temperatures coincide with lesser precipitation. The emissions representing the wet season were calculated based on the fluxes observed from Oct 1, 2009 to 31 Mar 31, 2010 (182 days). The emissions representing the dry season were calculated based on the fluxes from Apr to Sep (183 days). These periods are the same as the historically wetter and drier periods at the experimental site, respectively, according
to the reported by Galdos et al. (2009). Seasonal CO2,
N2O and CH4 mean fluxes for these periods were
esti-mated, as well as weighting the emissions to allow for seasonal fluxes (Table 3).
After collecting the gases, soil samples were taken from inside the chambers to determine N mineral con-centration and soil moisture. Soil moisture was deter-mined by gravimetry, and mineral N content was de-termined by colorimetry of soil extracts (2M KCl) using flow injection analysis based on the methods proposed
by Kamphake et al. (1967) for NO3– and by Krom (1980)
for NH4+. Soil water-filled pore space (WFPS) was calcu-lated as follows:
WFPS=Vol/(1–Ws/Ss) (2)
where: WFPS is the water-filled pore space (%); Vol is the volumetric water content (%); Ws is the soil bulk density (Mg m–3); and S
s (2.65 Mg m
–3) is the particle density
commonly used for tropical soils (ISO, 1998).
Statistical analysis
Differences in soil characteristics and in gas flux-es among treatments were determined using analysis of variance (ANOVA), where the historical SS rate, or amount of SS applied, was considered to be the vari-able factor (randomized set). The mean values for each treatment were compared using Tukey test (p < 0.05 for chemical parameters; p < 0.10 for soil density). To assist with the interpretation of gas fluxes, we used simple and multiple regressions in which y represented gas flux and
x represented either temperature, or WFPS or both
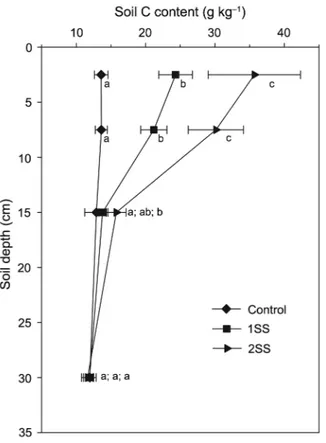
Figure 2 – A profile of carbon content distribution in soil. Different letters indicate differences between treatments (p < 0.05). Bars indicate standard deviation. Control represents the treatment with no SS but N mineral used instead, 1SS represents the treatment in which the recommended SS rate was applied and 2SS represents the treatment in which two times the recommend SS rate was applied.
Figure 3 – A profile of nitrogen content distribution in soil. Different letters indicate differences between treatments (p < 0.05). Bars indicate standard deviation. Control represents the treatment with no SS but N mineral used instead, 1SS represents the treatment in which the recommended SS rate was applied and 2SS represents the treatment in which two times the recommend SS rate was applied.
cording to the following equation:
x = (Tsoil/Trange) + (WFPS/WFPDrange) (3)
where: Tsoil is the verified temperature at the respective point; Trange is the temperature range observed for the respective treatment; WFPS is the WFPS verified at the
respective point; and WFPSrange is the WFPS range
ob-served for the respective treatment.
Results and Discussion
Soil carbon and nitrogen
In 1SS, soil C contents were 79 %, 56 % and 7 % higher than in the Control series at 0-5, 5-10 and 10-20 cm layers, respectively; whereas in 2SS, soil C contents were 163 %, 121 % and 22 % higher than in the same layers of the Control. In samples collected at a depth below 20 cm, there was no effect of SS on soil C content. According to soil C content data, the amount of SS
ap-plied explained the variance in the total soil C content in studied soil even two years after SS application stopped. However, variations tended to decrease with soil depth (Figure 2).
Soil N content was highly associated with C con-tent (r = 0.996; p < 0.0001), as it changed accordingly with it (Figure 3). In 1SS, soil N contents were 68 % and 60 % higher than in the Control series at 0-5 and 5-10 cm layers, respectively; whereas in 2SS treatment, soil N contents were 174 % and 118 % higher than in same layers of the Control. Below 10 cm, soil N content was not statistically different across treatments.
Table 2 – Soil density across soil depth after two years with no sewage sludge application in treatments *Control, 1SS and 2SS.
Treatment Soil depth
0-5 5-10 10-20 20-40
--- g cm–3
---Control ϑ1.17b 1.18b 1.21a 1.13a
1SS 1.08a 1.22b 1.20a 1.22a
2SS 1.07a 1.07a 1.16a 1.25a
bCV (%) 5.04 4.10 7.74 5.78
*Control represents the treatment with no SS but N mineral used instead, 1SS represents the treatment in which the recommended SS rate was applied and 2SS represents the treatment in which two times the recommend SS rate was applied; ϑValues followed by different letters indicate differences between treatments (p < 0.10); bcoefficient of variation.
it improves soil porosity (Dexter et al., 2008). These lay-ers were also the most affected by SS addition in terms of C content (Figure 2).
Although there was no difference between C and N soil content in the deepest layer, as well as soil density, we calculated the total increases in C and N stocks attributable to changes in management practices. The mean C stocks were 58.8 Mg ha–1 in the Control, 72.5 and 83.1 Mg ha–1 for 1SS and 2SS, respectively. The mean N stocks were 4.8, 5.8, and 6.8 Mg ha–1inthe Control, 1SS and 2SS
, respectively. Soil nitrate content (NO3–-N) in the samples col-lected from inside each chamber after gas sampling ranged from 1.38 to 7.69 mg kg–1 for the Controls, 2.97-15.47 mg kg–1 for 1SS and 5.43-37.34 mg kg–1 for 2SS. The mean nitrate values (NO3–-N) were 3.62 mg kg–1 for the Control, 8.20 for 1SS and 15.59 for 2SS. Soil ammonium (NH4+-N) ranged from 0.04 to 4.08 mg kg–1 for the Con-trol, 0.27-11.09 mg kg–1 for 1SS and 0.76-24.31 mg kg–1
for 2SS. Mean ammonium values (NH4+-N) were 1.50
mg kg–1 for the Control, 3.85 for 1SS and 7.39 for 2SS.
Carbon and nitrogen relationship and elemental stocks
Considering mean C and N values of the annually applied SS (Table 2), we determined the total amount of
elements added to the soil after seven SS applications and compared it with respective stocks to assess the C and N
dynamic. In 1SS, 19.5 and 2.0 Mg ha–1 of C and N were
added, respectively. In 2SS, 39.1 and 4.1 Mg ha–1of C and N were added, respectively. Thus, comparing these values with N increase we infer that 50 % of the N applied with SS remained in the soil both in 1SS and 2SS. Disregard-ing differences in residues from crop production and soil incorporation over years of different treatments, 70 % of C and 62 % of C applied to the 2SS explains the increases in soil C stocks at 1SS and 2SS, respectively. Because the C:N ratio settles around 12 and the fact that the same fraction of N from SS remained in both 1SS and 2SS sug-gest that N output is the primary variable that determines how much C is stored. Indeed, stoichiometry between C, N and P is a key factor that controls the C storage capacity in ecosystems (Hessen et al., 2004). Despite SS application having ceased 2 years before this research was conducted, it appears that plant uptake of N was greater in 1SS and 2SS than in the Control (data not shown).
Another important factor that might determine the amount of C stored in soil is the C:N ratio of the SS. Be-cause the parameter that limits the amount of SS applied is generally N content, materials with different C:N ratios deposit the same amount of N and different amounts of
Table 3 – Mean CO2, CH4 and N2O fluxes during wetter and drier periods after 2 year with no sewage sludge application in treatments *Control, 1SS and 2SS.
Mean fluxes in wetter period
Treatment CO2 N2O CH4
--- µmol m–2 h–1
---Control ϑ2.37a 0.11a -0.82a
1SS 3.62ab 0.31ab -0.37a
2SS 4.30b 0.70b -0.49a
bCV (%) 51.02 187.98 -304.50
Mean fluxes in drier period
Treatment CO2 N2O CH4
--- µmol m–2 h–1
---Control 0.21a 0.01a -0.83a
1SS 0.23a -0.01a -0.96a
2SS 0.27a -0.02a -0.19a
CV (%) 76.84 -1065.23 -114.64
C. In addition, SS with lower C:N ratios might provide faster N mineralization, and thus element stocks stabilize at lower levels of N and C because the soil C:N ratio tends to stabilize at values close to those observed in Control treatments after successive SS applications as showed by Adani and Tambone (2005), Fernandez et al. (2009), Hallin et al. (2009), Lima et al. (2009) and in this study.
We can compare the data collected in the pres-ent study with those reported by Dias et al. (2007). The study sites for both sets of experiments have similar soil texture and classification, and were managed using the same practices and subjected to the same climatic con-ditions because they are in neighboring counties and at the same altitude. However, Dias et al. (2007) used SS with a mean C:N ratio of 7.3 and C content in soil 0-10 cm deep was estimated as 12 % greater than in N fertilized soil (Control) six years after treatment. In our study, the mean C:N ratio of SS was 9.6 and C content in 1SS-amended soil 0-10 cm deep remained 67 % higher than in N fertilized soil (Control) even after two years with no SS application. Adani and Tambone (2005) did not find any changes in C soil content (0-25 cm depth) between SS and Control treatments after 10 annual SS applications; thus, the C:N ratio was equal to 5.3. In this context, we attribute to the C:N ratio the high C stor-age achieved in this work, which reflects characteristics of recalcitrance. In this case, C accumulation overcomes those observed in Ferralsols after long term conversion from conventional tillage to no-tillage in subtropical cli-mates in Brazil (Boddey et al., 2010).
Lower C:N ratios are found in less stable SS generated by the activated sludge process (Beecher, 2008). The activated sludge process is highly efficient in smaller areas and it is used in metropolitan regions abroad (Boon, 2003). Conversely, SS with a higher C:N ratio is produced by slower stabilization processes in water reclamation stations as the one used in this study. This slower process uses an aerated lagoon followed by decantation. In a region with the largest waste rec-lamation treatment plants in the world, SS is quickly generated by fast processing. However, it becomes bio-logically stabilized remaining for a relatively extended time period in patios (Tian et al., 2009). Thereafter, the soil supported high C storage after consecutive SS ap-plications (Tian et al., 2009). Thus, an alternative for obtaining more stabilized SS could be implemented with secondary treatments.
CO2
We found significant correlations between CO2
fluxes and water availability (p-values in Control< 1SS< 2SS), temperature (p-values 2SS< 1SS< Control) and both variables together (p < 0.0001). In 2SS alone, an exponential adjustment was included in the regression equation (Figure 4). For N2O and CH4, we found no sig-nificant correlations between these measurements or any other variables, including mineral N or WFPS. In addition, by curve inclination (Figure 4) and probability
levels obtained from regressions, we found that after SS treatment, CO2 flux from soil is more dependent on tem-perature than the Control. The angular coefficients for the Control, 1SS and 2SS were 0.105, 0.3276 and 0.404 µmol CO2 m–2 s–1 per oC change in temperature, respec-tively.
Temperature dependence of organic matter mineralization in soils is a function of organic matter availability (Davidson and Janssens, 2006). The more organic matter became available (i.e. as result of mois-ture status, less aggregation or adsorption capacity), the more intense the effects of temperature on C miner-alization. On the other hand, Davidson and Janssens (2006) also highlighted the role of organic matter qual-ity in temperature sensitivqual-ity. Although the added or-ganic matter might in part be more available in the soil, it also presented intrinsic characteristics which led to C sequestration. Moreover, since N has been indicated as a primary parameter for C sequestration by regulat-ing organic matter turnover, the higher C mineraliza-tion might be balanced by increases in crop residues’ deposition (Kirschbaum, 2006), which corroborates the retention of the great amount of C observed. Although this feedback may contribute to retention of C in the system, it is not well established and is a gap in the pre-cursor models developed to predict soil organic matter dynamics (Kirschbaum, 2006).
The simulations using these models have pointed to C accumulation as a result of global warming in trop-ical ecosystems due to this gap concerning N turnover (Kirschbaum, 2006). Recently, modules considering N use efficiency have been proposed to improve the mod-els’ performance (Mooshammer et al., 2014; Wieder et al., 2013) but it still needs to be validated under dif-ferent scenarios. Considering the lack of response of maize respiration to temperature and the same autotro-phic respiration rates in all treatments, we were able to estimate the effects of temperature on C release from the soil. According to our observations, C mineraliza-tion increased 0.2226 µmol m–2 s–1 per oC from the Con-trol to 1SS. Using stoichiometry (C:N=12:1; m:m), it is equivalent to 0.0159 µmol of N m–2 s–1. Following the same estimates, each 1 oC stimulates the mineralization
of 840 kg of C and 70 kg of N ha–1 yr–1 in 1SS when
compared with the Control. When comparing the
Con-trol and 2SS, each 1 oC stimulates the mineralization
of 1131 kg of C and 94 kg of N ha–1 yr–1.Since the C:N ratio tends to remain stable, the fraction of this N lost by leaching, denitrification or exported as grains was proportional to the C decay in the SS-amended soil as a result of increases in soil temperature. For maize, Vicca et al. (2010) verified that CO2 emissions from plant res-piration under water-sufficient conditions do not show
sensitivity to temperature, unlike CO2 emissions from
organic matter in soil. However, other factors, such
as water content, might also regulate CO2 flux, which
high significance levels for multiple regressions
be-tween CO2 flux and temperature associated with WFPS
for all treatments, but in 2SS, an exponential adjust-ment was included in the regression equation.
Because heterotrophic and autotrophic metabo-lisms are significant sources of CO2 from soil and the ra-tio between them is unknown (Kuzyakov, 2006), and we did not use plant productivity values, we were unable to predict the rate of C decay. However, emissions from 1SS and 2SS were 50 % and 78 % greater than from the Control, respectively (Table 4). Hence, we can use the same concepts as described for the effects of tempera-ture to estimate the C lost related to the residual effects. In terms of N, these values represent 202 and 315 kg ha–1 for 1SS and 2SS, respectively. The N exported from the system or lost by biogeochemical processes were pro-portional to the C lost. When we observed changes in soil management practices and C sequestration, it is as-sumed that this C could be returned to the atmosphere if the practices are reversed. This will follow as long as the system gets close to a new equilibrium in terms of C balance, which occurs in long term scales (Wutzler and Reichstein, 2007). As an example, Urzedo et al. (2013)
Figure 4 – Relationships between CO2 flux, water-filled pore space (A, B and C), temperature (D, E and F) and multiple regression with both variables (G, H and I; see statistical methods) in the Control (A, D and G), 1SS (B, E and H) and 2SS (C, E and I) treatments. Control represents the treatment with no SS but N mineral used instead, 1SS represents the treatment in which the recommended SS rate was applied and 2SS represents the treatment in which two times the recommend SS rate was applied. Ap < 0.0001; Bp = 0.0005; Cp = 0.02882; Dp = 0.28626; Ep = 0.01265; Fp = 0.0042; Gp < 0.0001; Hp < 0.0001; Ip < 0.0001. In “I”, an exponential regression adjustment was applied.
Table 4 – Weightingδ seasonal fluxes of CO
2, CH4 and N2O and
estimated **emissions in treatments *Control, 1SS and 2SS.
Treatment CO2
µmol m–2 s–1 Mg C ha–1 yr–1 Mg eqCO 2 ha
–1 yr–1
Control 1.29 4.88 17.90
1SS 1.93 7.30 26.78
2SS 2.29 8.67 31.78
Treatment N2O
µmol m–2 h–1 kg N ha–1 yr–1 kg eqCO 2 ha
–1 yr–1
Control 0.06 0.15 68.54
1SS 0.15 0.37 172.84
2SS 0.34 0.83 390.28
Treatment CH4
µmol m–2 h–1 kg C ha–1 yr–1 kg eqCO 2 ha
–1 yr–1
Control -0.82 -0.86 -28.75
1SS -0.66 -0.69 -23.00
2SS -0.34 -0.36 -12.00
δWeighting accounts for wetter and drier seasonal fluxes; **CO
observed that in the first growing season after SS
appli-cation less than 1 % of the added C was released as CO2
in a forestry experiment.
N2O and CH4
Because the GWP of N2O is 298 times greater than
CO2 (IPCC, 2007), emissions of this compound might
re-duce agriculture sustainability or compromise benefits arising from management changes. While IPCC (2006) recommends using a default value of 1 % for the applied N emitted as N2O, Crutzen et al. (2008) suggests that this amount ranges from 3 % to 5 %. Considering this range, ethanol from maize crops does not mitigate global warm-ing. Briefly, Crutzen et al. (2008) obtained this range cor-relating increases in fertilizer use and N2O atmospheric concentrations. Thus, their estimate includes indirect emissions from agricultural N lost to the environment as those described by Galloway et al. (2004).
After SS use, indirect emissions would come from residual effects, in which C and N are still abundantly available to stimulate N2O emission. The residual SS ef-fect increased N2O flux from soil, but our results in 1SS are similar to those found in non-fertilized moist tropical forests, as shown by Konda et al. (2010). In this report,
the authors obtained a mean N2O flux of 0.39 µmol m–2
h–1 in the wet season. Souza-Neto et al. (2011) reported annual means ranging from 0.32 to 0.36 µmol m–2 h–1 in the Brazilian Atlantic forest. In 1SS, we found a mean flux of 0.31 µmol m–2 h–1in the wetter season (Table 3).
No correlations between N2O flux and
environ-mental variables were verified in any of the treatments. This might be explained by simultaneous processes in-volving production or consumption of N2O, like nitrifica-tion and denitrificanitrifica-tion, as demonstrated by Farquhar-son and Baldock (2008).
Between GHG emissions related to agriculture
and land use changes, only CH4 atmospheric
concentra-tion was decreased to levels comparable to those mea-sured in the 1990’s (Bousquet et al., 2006). Well-drained soils usually act as a sink for CH4 (Conrad, 2009; Holmes et al., 1999), which was confirmed regardless of season either in the presence or absence of SS. For each treat-ment, no differences were observed between treatments
or seasons, although gradual CH4 uptake inhibition had
been verified according to the SS rate.
Conclusions
Carbon dioxide flux from soil under the residual effect of SS shows high temperature dependence, indi-cating that its organic matter is more available than in SS non-amended soil. However, large stores of carbon fol-lowing historical SS application demonstrate that its use could be a method for carbon sequestration, even under tropical conditions. Sewage sludge properties (e.g. C:N ratio) contribute to the determination of carbon storage capacity. Although the residual effects of sewage sludge
caused increases in N2O flux, after recommended rates
the fluxes were similar to those found in moist forest ecosystems and might not be considered an important indirect impact of SS residual effects.
Acknowledgements
The authors would like to acknowledge the invalu-able help of Dr. Fábio R. P. Rocha for optimization of the flow inject analysis methods. We also thank Eráclito Sousa Neto, Fabiana Fracassi, Daniel L. G. Monaro and Renan C. Fantini for contributions in the laboratory and field.
References
Adani, F.; Tambone, F. 2005. Long-term effect of sewage sludge application on soil humic acids. Chemosphere 60: 1214-1221. Alvares, C.A.; Stape, J.L.; Sentelhas, P.C.; Gonçalves, J.L.M.;
Sparovek, G. 2013. Koppen's climate classification map for Brazil. Meteorologische Zeitschrift 22: 711-728.
Beecher, N. 2008. Overview. In: Blanc, R.J.; Matthews, P.; Richard, R.P., eds. Global Atlas of Excreta, Wastewater Sludge, and Biosolids Management: Moving Forward the Sustainable and Welcome Uses of a Global Resource. UN-HABITAT, New Brunswick, Canada.
Boddey, R.M.; Jantalia, C.P.; Conceicao, P.C.; Zanatta, J.A.; Bayer, C.; Mielniczuk, J.; Dieckow, J.; Santos, H.P.; Denardin, J.E.; Aita, C.; Giacomini, S.J.; Alves, B.J.R.; Urquiaga, S. 2010. Carbon accumulation at depth in Ferralsols under zero-till subtropical agriculture. Global Change Biology 16: 784-795. Bonanomi, G.; Antignani, V.; Capodilupo, M.; Scala, F. 2010.
Identifying the characteristics of organic soil amendments that suppress soilborne plant diseases. Soil Biology & Biochemistry 42: 136-144.
Boon, A.G. 2003. Sequencing batch reactors: a review. Journal of the Chartered Institution of Water and Environmental Management 17: 68-73.
Bousquet, P.; Ciais, P.; Miller, J.B.; Dlugokencky, E.J.; Hauglustaine, D.A.; Prigent, C.; Werf, G.R. van der; Peylin, P.; Brunke, E.G.; Carouge, C.; Langenfelds, R.L.; Lathiere, J.; Papa, F.; Ramonet, M.; Schmidt, M.; Steele, L.P.; Tyler, S.C.; White, J. 2006. Contribution of anthropogenic and natural sources to atmospheric methane variability. Nature 443: 439-443. Carmo, J.B.; Keller, M.; Dias, J.D.; de Camargo, P.B.; Crill, P.
2006. A source of methane from upland forests in the Brazilian Amazon. Geophysical Research Letters 33: L04809.
Childers, D.L.; Corman, J.; Edwards, M.; Elser, J.J. 2011. Sustainability challenges of phosphorus and food: solutions from closing the human phosphorus cycle. Bioscience 61: 117-124.
Conselho Nacional de Meio Ambiente [CONAMA]. 2006. Management of wastes and hazardous materials: use = Gestão de resíduos e produtos perigosos: uso. Diário Oficial da União, Brasília, DF, Brazil. Available at: http://www.mma.gov.br/port/ conama/legiabre.cfm?codlegi=506 [Accessed in Mar 13, 2009]. Conrad, R. 2009. The global methane cycle: recent advances in
Crutzen, P.; Mosier, A.; Smith, K.; Winiwarter, W. 2008. N2O release from agro-biofuel production negates global warming reduction by replacing fossil fuels. Atmospheric Chemistry and Physics 389-395.
Davidson, E.A.; Belk, E.; Boone, R.D. 1998. Soil water content and temperature as independent or confounded factors controlling soil respiration in a temperate mixed hardwood forest. Global Change Biology 4: 217-227.
Davidson, E.A.; Keller, M.; Erickson, H.E.; Verchot, L.V.; Veldkamp, E. 2000. Testing a conceptual model of soil emissions of nitrous and nitric oxides. Bioscience 50: 667-680.
Davidson, E.A.; Savage, K.; Verchot, L.V.; Navarro, R. 2002. Minimizing artifacts and biases in chamber-based measurements of soil respiration. Agricultural and Forest Meteorology 113: 21-37.
Davidson, E.A.; Janssens, I.A. 2006. Temperature sensitivity of soil carbon decomposition and feedbacks to climate change. Nature 440: 165-173.
Dexter, A.R.; Richard, G.; Arrouays, D.; Czyz, E.A.; Jolivet, C.; Duval, O. 2008. Complexed organic matter controls soil physical properties. Geoderma 144: 620-627.
Dias, B.D.; Silva, C.A.; Soares, E.M.B.; Bettiol, W. 2007. Organic carbon stock and quantification of humic substances of an oxisol under continuous sewage sludge application. Revista Brasileira de Ciencia do Solo 31: 701-711.
Elser, J.J. 2012. Phosphorus: a limiting nutrient for humanity? Current Opinion in Biotechnology 23: 833-838.
Food and Agriculture Organization [FAO]. 1998. World Reference Base for Soil Resources. FAO, Rome, Italy.
Farquharson, R.; Baldock, J. 2008. Concepts in modelling N2O emissions from land use. Plant and Soil 309: 147-167.
Fernandez, J.M.; Hernandez, D.; Plaza, C.; Polo, A. 2007. Organic matter in degraded agricultural soils amended with composted and thermally-dried sewage sludges. Science of the Total Environment 378: 75-80.
Fernandez, J.M.; Plaza, C.; Garcia-Gil, J.C.; Polo, A. 2009. Biochemical properties and barley yield in a semiarid Mediterranean soil amended with two kinds of sewage sludge. Applied Soil Ecology 42: 18-24.
Galdos, M.V.; De Maria, I.C.; Camargo, O.A. 2004. Soil chemical properties and corn production in a sewage sludge-amended soil. Revista Brasileira de Ciência do Solo 28: 569-577. Galdos, M.V.; De Maria, I.C.; de Camargo, O.A.; Dechen, S.C.F.
2009. Sewage sludge application on cultivated soils: effects on runoff and trace metal load. Scientia Agricola 66: 368-376. Galloway, J.N.; Dentener, F.J.; Capone, D.G.; Boyer, E.W.;
Howarth, R.W.; Seitzinger, S.P.; Asner, G.P.; Cleveland, C.C.; Green, P.A.; Holland, E.A.; Karl, D.M.; Michaels, A.F.; Porter, J.H.; Townsend, A.R.; Vorosmarty, C.J. 2004. Nitrogen cycles: past, present, and future. Biogeochemistry 70: 153-226. Garcia-Orenes, F.; Guerrero, C.; Mataix-Solera, J.;
Navarro-Pedreno, J.; Gomez, I.; Mataix-Beneyto, J. 2005. Factors controlling the aggregate stability and bulk density in two different degraded soils amended with biosolids. Soil & Tillage Research 82: 65-76.
Gerba, C.P.; Smith, J.E. 2005. Sources of pathogenic microorganisms and their fate during land application of wastes. Journal of Environmental Quality 34: 42-48.
Hallin, S.; Jones, C.M.; Schloter, M.; Philippot, L. 2009. Relationship between N-cycling communities and ecosystem functioning in a 50-year-old fertilization experiment. ISME Journal 3: 597-605. Hessen, D.O.; Agren, G.I.; Anderson, T.R.; Elser, J.J.; De Ruiter,
P.C. 2004. Carbon, sequestration in ecosystems: the role of stoichiometry. Ecology 85: 1179–1192.
Holmes, A.J.; Roslev, P.; McDonald, I.R.; Iversen, N.; Henriksen, K.; Murrell, J.C. 1999. Characterization of methanotrophic bacterial populations in soils showing atmospheric methane uptake. Applied and Environmental Microbiology 65: 3312-3318. International Panel on Climate Change [IPCC]. 2007. Climate
Change 2007. In: Metz, B.; Davidson, O.R.; Bosch, P.R.; Dave, R.; Meyer, L.A., eds. The Physical Science Basis, Contribution of Working Group I, II and III to the Fourth Assessment Report of the IPCC. Cambridge University Press, Cambridge, UK. International Panel on Climate Change [IPCC]. 2006. Guidelines
for National Greenhouse Gas Inventories. IGES, Tokyo, Japan. International Organization for Standarlization [ISO]. 1998. ISO
11277 – Determination of Particlesize Distribution in Mineral Soil Material - Method by Sieving and Sedimentation. Geneva, Switzerland.
Kamphake, L.J.; Hannah, S.A.; Cohen, J.M. 1967. Automated analysis for nitrate by hydrazine reduction. Water Research 1: 205-216.
Kirschbaum, M.U.F. 2006. The temperature dependence of organic-matter decomposition - still a topic of debate. Soil Biology & Biochemistry 38: 2510-2518.
Konda, R.; Ohta, S.; Ishizuka, S.; Heriyanto, J.; Wicaksono, A. 2010. Seasonal changes in the spatial structures of N2O, CO2, and CH4 fluxes from Acacia mangium plantation soils in Indonesia. Soil Biology & Biochemistry 42: 1512-1522.
Krom, M.D. 1980. Spectrophotometric determination of ammonia: a study of a modified berthelot reaction using salicylate and dichloroisocyanurate. Analyst 105: 305-316.
Kuzyakov, Y. 2006. Sources of CO2 efflux from soil and review of partitioning methods. Soil Biology & Biochemistry 38: 425-448. Lal, R. 2008. Carbon sequestration. Philosophical Transactions of
the Royal Society B-Biological Sciences 363: 815-830.
Le Mer, J.; Roger, P. 2001. Production, oxidation, emission and consumption of methane by soils: a review. European Journal of Soil Biology 37: 25-50.
Lima, D.L.D.; Santos, S.M.; Scherer, H.W.; Schneider, R.J.; Duarte, A.C.; Santos, E.B.H.; Esteves, V.I. 2009. Effects of organic and inorganic amendments on soil organic matter properties. Geoderma 150: 38-45.
Molen, M.K. van der; Dolman, A.J.; Ciais, P.; Eglin, T.; Gobron, N.; Law, B.E.; Meir, P.; Peters, W.; Phillips, O.L.; Reichstein, M.; Chen, T.; Dekker, S.C.; Doubkova, M.; Friedl, M.A.; Jung, M.; van den Hurk, B.; de Jeu, R.A.M.; Kruijt, B.; Ohta, T.; Rebel, K.T.; Plummer, S.; Seneviratne, S.I.; Sitch, S.; Teuling, A.J.; van der Werf, G.R.; Wang, G. 2011. Drought and ecosystem carbon cycling. Agricultural and Forest Meteorology 151: 765-773. Mooshammer, M.; Wanek, W.; Haemmerle, I.; Fuchslueger, L.;
Navarro, I.; Jimenez, B.; Cifuentes, E.; Lucario, S. 2009. Application of Helminth ova infection dose curve to estimate the risks associated with biosolid application on soil. Journal of Water and Health 7: 31-44.
Nogueira, T.A.R.; Melo, W.J.; Fonseca, I.M.; Marcussi, S.A.; Melo, G.M.P.; Marques, M.Q. 2010. Fractionation of Zn, Cd and Pb in a tropical soil after nine-year sewage sludge applications. Pedosphere 20: 545-556.
Raij, B. van; Cantarella, H.; Quaggio, J.A.; Furlani, A.M.C. 1997. Recommendations for fertilization and liming in the State of São Paulo = Recomendações de adubação e calagem para o Estado de São Paulo. Instituto Agronômico, Campinas, SP, Brazil (in Portuguese).
Sey, B.K.; Manceur, A.M.; Whalen, J.K.; Gregorich, E.G.; Rochette, P. 2008. Small-scale heterogeneity in carbon dioxide, nitrous oxide and methane production from aggregates of a cultivated sandy-loam soil. Soil Biology & Biochemistry 40: 2468-2473. Singh, R.P.; Agrawal, M. 2008. Potential benefits and risks of land
application of sewage sludge. Waste Management 28: 347-358. Smith, S.R. 2009. Organic contaminants in sewage sludge
(biosolids) and their significance for agricultural recycling. Philosophical Transactions of the Royal Society A- Mathematical Physical and Engineering Sciences 367: 4005-4041.
Souza-Neto, E.; Carmo, J.B.; Keller, M.; Martins, S.C.; Alves, L.F.; Vieira, S.A.; Piccolo, M.C.; Camargo, P.; Couto, H.T.Z.; Joly, C.A.; Martinelli, L.A. 2011. Soil-atmosphere exchange of nitrous oxide, methane and carbon dioxide in a gradient of elevation in the coastal Brazilian Atlantic forest. Biogeosciences 8: 733-742.
Stein, L.Y. 2011. Surveying N2O-producing pathways in bacteria. Methods in Enzymology. 486: 131-152.
Tian, G.; Granato, T.C.; Cox, A.E.; Pietz, R.I.; Carlson, C.R.; Abedin, Z. 2009. Soil carbon sequestration resulting from long-term application of biosolids for land reclamation. Journal of Environmental Quality 38: 61-74.
Urzedo, D.I.; Franco, M.P.; Pitombo, L.M.; Carmo, J.B. 2013. Effects of organic and inorganic fertilizers on greenhouse gas (GHG) emissions in tropical forestry. Forest Ecology and Management 310: 37-44.
Vicca, S.; Janssens, I.A.; Wong, S.C.; Cernusak, L.A.; Farquhar, G.D. 2010. Zea mays rhizosphere respiration, but not soil organic matter decomposition was stable across a temperature gradient. Soil Biology & Biochemistry 42: 2030-2033.
Wang, R. 2011. Environmental and resource sustainability of Chinese cities: a review of issues, policies, practices and effects. Natural Resources Forum 35: 112-121.
Ward, B. B. 2008. Nitrification. p. 2511-2518. In: Jorgensen, S.E.; Faith, B.D., eds. Encyclopedia of Ecology. Elsevier, Oxford, UK.
Wieder, W.R.; Bonan, G.B.; Allison, S.D. 2013. Global soil carbon projections are improved by modelling microbial processes. Nature Climate Change 3: 909-912.
Wilson, D.C. 2007. Development drivers for waste management. Waste Management & Research 25: 198-207.